iOS Game Development Cookbook (2014)
Chapter 14. Performance and Debugging
At some point during its development, every game will have performance issues, and every game will crash. Fortunately, iOS has some of the best tools around for squeezing as much performance as possible out of your games and finding bugs and other issues.
In this chapter, you’ll learn about how to use these tools, how to fix problems, and how to get information about how your game’s behaving.
Improving Your Frame Rate
Problem
You need to coax a better frame rate out of your game so that it plays smoothly.
Solution
To improve your frame rate, you first need to determine where the majority of the work is being done. In Xcode:
1. From the Scheme menu, select your device, so that the application will be installed to the device when you build.
2. Open the Product menu and choose Profile (or press Command-I).
The application will build and install onto the device, and Instruments will open and show the template picker (Figure 14-1).
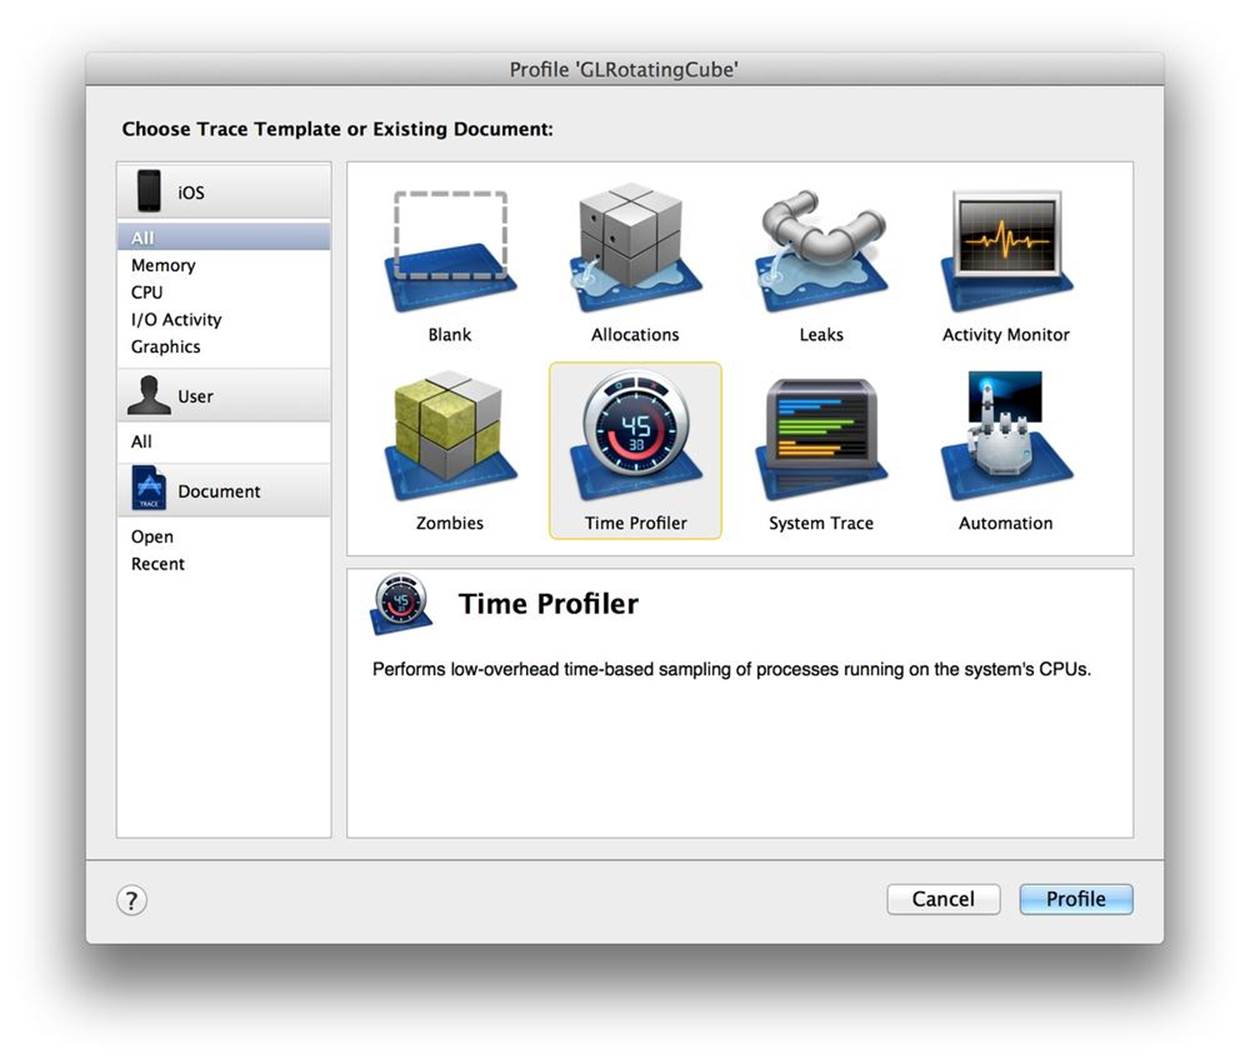
Figure 14-1. Selecting the Instruments template
3. Select the Time Profiler instrument and run your game for a while. You’ll start seeing information about how much CPU time your game is taking up.
4. Turn on Invert Call Tree and Show Obj-C Only, and turn off everything else in the list, as shown in Figure 14-2.
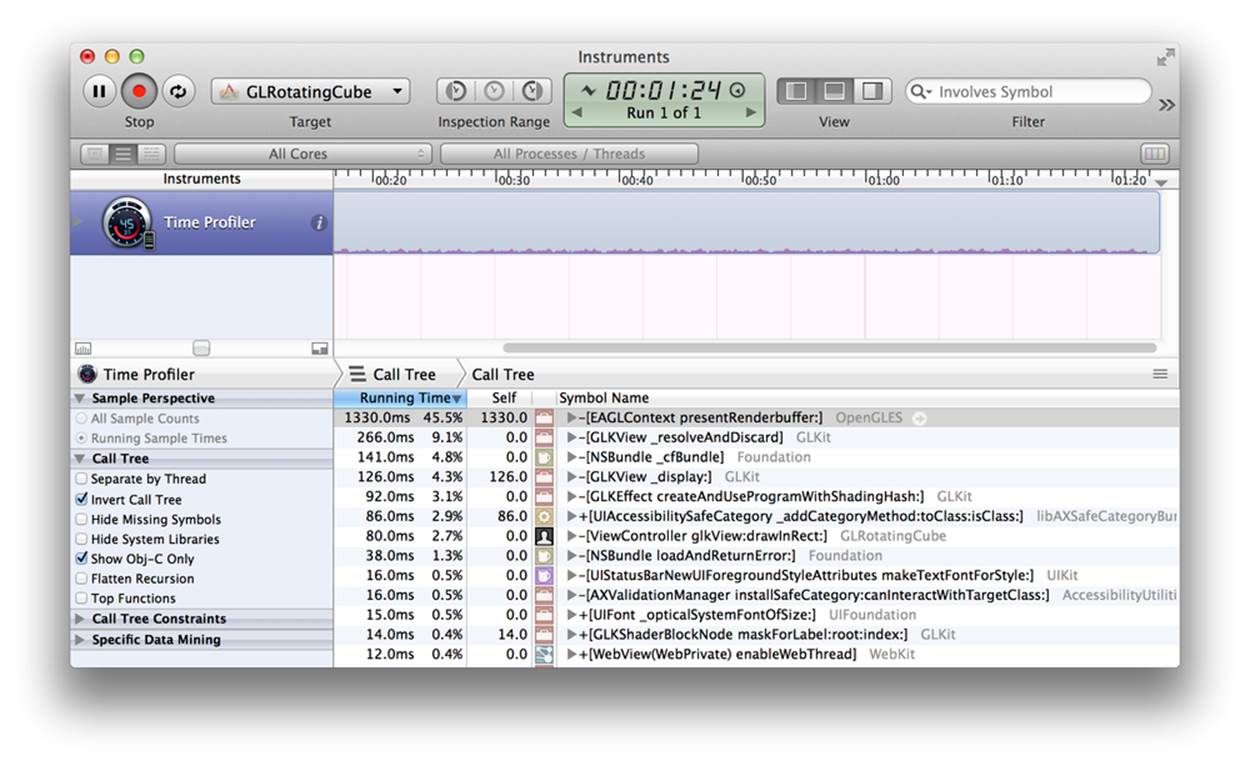
Figure 14-2. Instruments in action
5. Take note of the name of the function that’s at the top of the list:
a. If the top function is [EAGLContext presentRenderbuffer:], the game is spending most of its time rendering graphics. To improve your frame rate, reduce the number of objects on the screen, and make fewer calls to glDrawElements and its related functions.
b. If not, the game is spending most of its time running code on the CPU. Turn on Hide System Libraries; the function at the top of the list is your code, which the game is spending most of its time processing (see Figure 14-3).
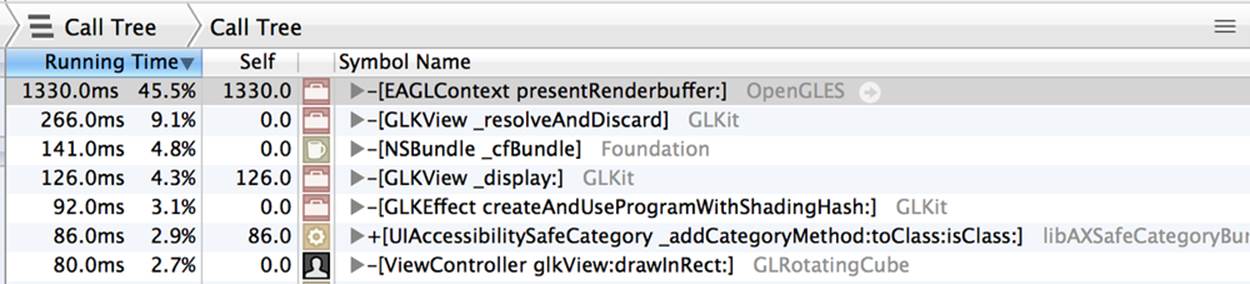
Figure 14-3. In this example, the function that’s consuming the most CPU time is EAGLContext presentRenderBuffer:
If your game is spending most of its time rendering graphics, you can improve the speed by drawing fewer sprites (if you’re using Sprite Kit) or drawing fewer objects (if you’re using OpenGL). If most of the time is spent running code on the CPU, it’s less straightforward, since different games do different things. In this case, you’ll need to look for ways to optimize your code. For example, if a long-running function is calculating a value that doesn’t change very often, store the result in a variable instead of recalculating it.
Discussion
You improve frame rates by taking less time to do the work you need to do per frame. This means either reducing the total amount of work you need to do, or not making the rendering of frames wait for work to complete.
WARNING
You should only profile using a real device, because the simulator performs differently to the real thing. The simulator has a faster CPU, but a slower GPU.
Making Levels Load Quickly
Problem
You want to make your levels load as quickly as possible, so that the player can get into the game immediately.
Solution
There are three main techniques for making a level load faster:
Load smaller or fewer resources
Make the images and sounds that you load smaller. Reduce the dimensions of textures, use compressed textures, and use lower-quality audio. Alternatively, load fewer resources.
Show progress indicators
When you begin loading resources for a new level, first count the number of resources you need to load; every time one gets loaded, show progress to the user, either using a progress indicator (such as a UILabel or UIProgressView) or a text field.
Stream textures
When level loading begins, load very small resources, such as very small textures. Once the game has begun, begin loading full-size textures in the background; once each high-resolution texture has loaded, replace the small texture with the large one.
Discussion
Half the battle is making the game look like it’s fast. The other half is actually being fast.
Loading smaller resources means that less data needs to be sent. An iOS device is really a collection of small, interconnected pieces, and it takes time to transfer data from the flash chips to the CPU and the GPU. In almost all cases, “faster loading” just means “loading less stuff.”
If you can’t increase the speed beyond a certain point, showing progress indicators at least means the user sees some kind of progress. If you just show a static “loading” screen, the player will get bored, and it will feel like it’s taking longer. You can see this technique outside of games, too: when you launch an iOS application, the system first shows a placeholder image while the app launches in the background. Apple encourages developers to make this placeholder image look like part of the application, but without any text or actual data to show, and the result is that the app feels like it’s launching faster.
Finally, it’s often the case that you just want to get something on the screen so that the player can start playing, and it’s OK if parts of the game don’t look their best for the first few seconds. This is called texture streaming, and the idea is that you load a deliberately small texture during the normal loading process, let the player get into the game, and then start slowly loading a better texture in the background.
Texture streaming means that your game’s loading process is faster, since there’s less data that needs to be transferred before the game can start. However, it can lead to visual problems: when the larger, higher-quality texture is loaded, a visible “pop” can happen. Additionally, loading two versions of the same texture at the same time means that more memory is being consumed, which can lead to memory pressure problems on iOS devices.
Dealing with Low-Memory Issues
Problem
Your app is randomly crashing when images or other resources are loaded into memory.
Solution
There are several ways you can reduce the amount of memory that your application is using. For example:
Use fewer textures
If you can reuse an image for more than one sprite or texture, it’s better than having multiple images that vary only slightly.
Trim your textures
If you have a texture that’s got some transparent area around the edges, trim them. When a texture is loaded, every pixel counts toward memory usage, including ones that are entirely transparent.
Use texture atlases
If you’re using Sprite Kit, Xcode makes it pretty easy to create texture atlases. Texture atlases group multiple textures together, which is more efficient, since per-texture overhead is minimized. Xcode also automatically trims your textures for you. To create a texture atlas, create a folder with a name ending in .atlas, and put your images into that. Once that’s done, your textures will be combined into a single image, saving a little memory.
Memory-map large files
If you need to read a large file—for example, a level file, a large collection of data, or a large sound file—you’ll often load it in as an NSData object. However, the usual method of doing this, with dataWithContentsOfFile:, copies the data into memory. If you’re reading from a file that you know won’t change, you can instead memory-map it, which means instructing iOS to pretend that the entire file has been copied into memory, but to only actually read the file when parts of it are accessed. To do this, load your files usingdataWithContentsOfFile:options:error: and use the NSDataReadingMappedIfSafe option:
NSData* data = [NSData dataWithContentsOfFile:filePath
options:NSDataReadingMappedIfSafe error:&error];
Use compressed textures
Compressed textures can dramatically reduce the amount of memory that your game’s textures take up. For more information, see Working with Compressed Textures.
Discussion
iOS has a very limited amount of memory, compared to OS X. The main reason for this is that iOS doesn’t use a swap file, which is a file that operating systems use to extend the amount of RAM available by using the storage medium. On OS X, if you run out of physical RAM (i.e., space to fit stuff in the RAM chips), the operating system moves some of the information in RAM to the swap file, freeing up some room. On iOS, there’s no swap file for it to move information into, so when you’re out of memory, you’re completely out of memory.
NOTE
The reason for this is that writing information to flash memory chips, such as those used in iOS devices, causes them to degrade very slightly. If the system is constantly swapping information out of RAM and into flash memory, the flash memory gradually gets slower and slower. From Apple’s perspective, it’s a better deal for the user to have a faster device and for developers to deal with memory constraints.
Because there’s a fixed amount of memory available, iOS terminates applications when they run out of memory. When the system runs low on memory, all applications are sent a low memory warning, which is their one and only notification that they’re running low.
The amount of memory available to apps depends on the device; however, as of iOS 7, there’s a hard limit of 600 MB per app. If an app ever goes above this limit, it will be immediately terminated by the operating system.
Tracking Down a Crash
Problem
You want to understand why an application is crashing, and how to fix it.
Solution
First, determine what kind of crash it is. The most common kinds of crashes are:
Exceptions
These occur when your code does something that Apple’s code doesn’t expect, such as trying to insert nil into an array. When an exception occurs, you’ll see a backtrace appear in the debugging console.
Memory pressure terminations
As we saw in the previous recipe, iOS will terminate any application that exceeds its memory limit. This isn’t strictly a crash, but from the user’s perspective, it looks identical to one. When a memory pressure termination occurs, Xcode displays a notification.
Once you know what kind of crash you’re looking at, you can take steps to fix it.
Discussion
The approach you take will depend on the kind of issue you’re experiencing.
Fixing exceptions
To fix an exception, you need to know where the exception is being thrown from. The easiest way to do this is to add a breakpoint on Objective-C exceptions, which will stop the program at the moment the exception is thrown (instead of the moment that the exception causes the app to crash).
To add this breakpoint:
1. Open the Breakpoints navigator, and click the + button at the bottom left of the window (Figure 14-4).
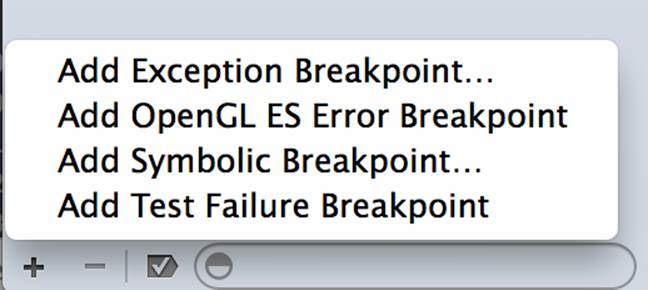
Figure 14-4. The breakpoints menu
2. Click Add Exception Breakpoint.
3. Run the application again; when the exception is thrown, Xcode will stop inside your code.
Fixing memory pressure issues
There are lots of different approaches you can take to reduce the amount of memory being consumed by your application; see Dealing with Low-Memory Issues for some pointers.
Working with Compressed Textures
Problem
You want to use compressed textures, to save memory and loading time.
Solution
To work with compressed textures, you need to have compressed textures to load. Xcode comes with a texture compression tool, but it’s sometimes tricky to use. It’s better to write a simple script that handles many of the details of using the compression tool for you:
1. Create a new, empty file called compress.sh. Place this file anywhere you like.
2. Put the following text in it (note that the path must all appear on one line; it’s broken here only to fit the page margins):
3. PARAMS="-e PVRTC --channel-weighting-perceptual --bits-per-pixel-4"
4.
5. /Applications/Xcode.app/Contents/Developer/Platforms/iPhoneOS.platform/
Developer/usr/bin/texturetool $PARAMS -o "$1.pvrtc" -p "$1-Preview.png" "$1"
6. Open the Terminal, and navigate to the folder where you put compress.sh.
7. Type the following commands:
8. chmod +x ./compress.sh
./compress.sh MyImage.png
After a moment, you’ll have two new images: MyImage.png.pvrtc and MyImage.png-Preview.png. The preview PNG file shows you what the compressed version of your image looks like, and the PVRTC file is the file that you should copy into your project.
Once you have your compressed texture, you load it like any other texture. If you’re using Sprite Kit, you load a texture using the textureWithImageNamed: method, providing it with the name of your PVRTC file:
SKTexture* texture = [SKTexture textureWithImageNamed:
@"MyCompressedTexture.pvrtc"];
With GLKit, it’s much the same process, though you have to get the full path of the image file using NSBundle’s pathForResource:ofType: method. Once you have that, you use GLKTextureLoader’s textureWithContentsOfFile:options:error: method to load the texture:
NSString* textureLocation = [[NSBundle mainBundle] pathForResource:
@"MyCompressedTexture" ofType:@"pvrtc"];
NSError* error = nil;
GLKTextureInfo* texture = [GLKTextureLoader textureWithContentsOfFile:
textureLocation options:nil error:&error];
NOTE
Unfortunately, it’s not possible to load a .pvrtc file using the UIImage class’s methods. This means that you can’t use compressed textures in UIImageViews, which is annoying. The only places you can use compressed textures are in OpenGL or when using Sprite Kit.
Discussion
Compressed textures use much less memory, and take less time to load (because there’s less data to transfer to the graphics chip), but they look worse. How much “worse” depends on the type of image you want to compress:
§ Photos and similar-looking textures do quite well with compression.
§ Line art tends to get fuzzy fringes around the edges of lines.
§ Images with transparent areas look particularly bad, because the transparent edges of the image get fuzzy.
On iOS, compressed textures are available as 2 bits per pixel (not bytes, bits) and 4 bits per pixel. Whereas a full-color 512 x 512 image would take up 1 MB of graphics memory, a 4 bpp version of the same image would take up only 128 kb of graphics memory.
NOTE
The compression system used is called PVRTC, which stands for PowerVR Texture Compression (PowerVR provides the graphics architecture for iOS devices).
An image can only be compressed when it fits all of the following requirements:
§ The image is square (i.e., the width is the same as the height).
§ The image is at least 8 pixels high and wide.
§ The image’s width and height are a power of 2 (i.e., 8, 16, 32, 64, 128, 512, 1024, 2048, 4096).
WARNING
Use compressed textures with care. While they can dramatically improve performance, reduce memory usage, and speed up loading times, if they’re used without care they can make your game look very ugly, as in the zoomed-in Figure 14-5. The image on the left is the compressed version; PVRTC introduces compression artifacts, which creates a slight “noisy” pattern along the edge of the circle. There’s also a subtle color difference between the image on the left and on the right, which is an additional consequence of compression. Experiment, and see what looks best in your game.

Figure 14-5. Compressed image (left) and original image (right)
Working with Watchpoints
Problem
You want to know when a specific variable changes.
Solution
To make Xcode stop your program when a variable changes from one value to another, you use a watchpoint. To set a watchpoint on a variable:
1. First, stop your program using a breakpoint.
When the program stops, the list of visible variables appears in the debugging console.
2. Add the watchpoint for the variable you want to watch.
Find the variable you want to watch, right-click it, and choose “Watch name of your variable,” as shown in Figure 14-6.
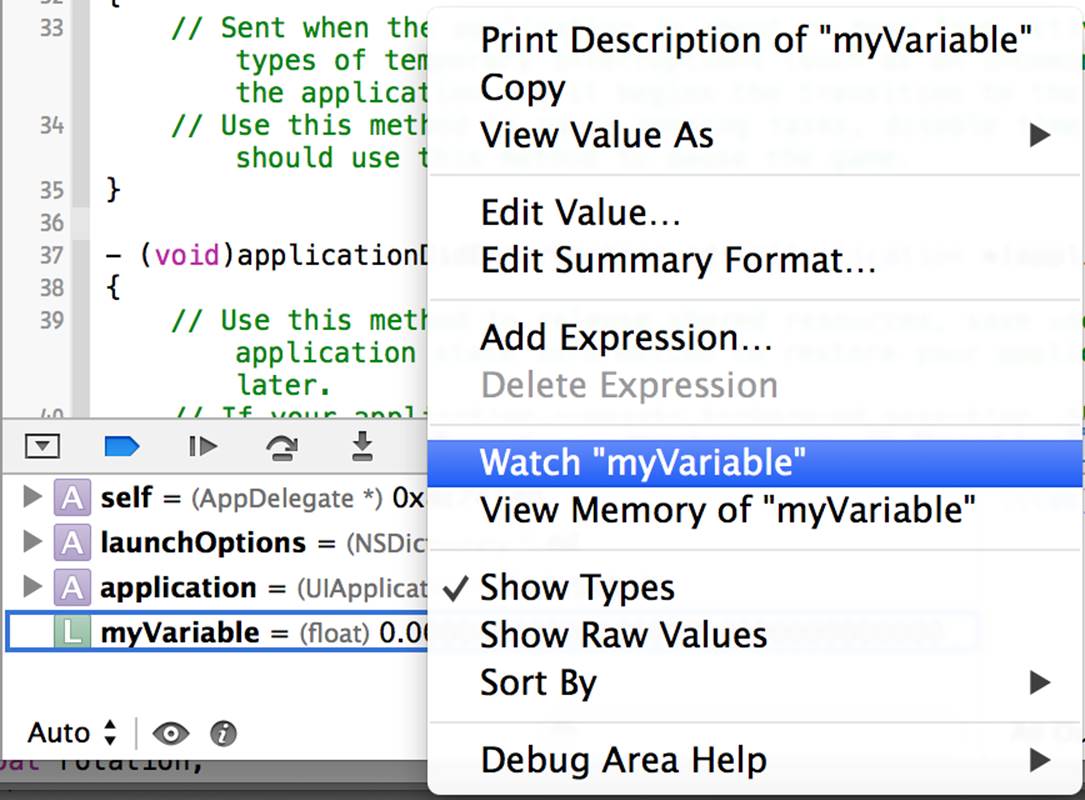
Figure 14-6. Creating a watchpoint
3. Continue the application.
The application will stop when the variable you’ve watched changes value.
Discussion
Watchpoints are breakpoints that “watch” a location in memory and stop the program the moment the value stored in that location changes. Watchpoints can’t be added to properties—they only watch regions of memory. If you want to watch a property, you need to locate the instance variable that that property uses, and watch it.
Keep in mind that when you stop and relaunch a program, the locations of the variables you were watching last time will have changed, and you’ll need to add the watchpoints again.
Logging Effectively
Problem
You want to log additional information about what your application is doing when information is logged to the console.
Solution
You can make NSLog show additional information by overriding it:
1. Open your project’s precompiled header. It’s the file ending in .pch, and is usually in the “Supporting Files” group.
2. Add the following line before the final #endif line:
3. #define NSLog(text, ...) NSLog((@"%s [%@:%d] " text), __PRETTY_FUNCTION__,
[@__FILE__ lastPathComponent], __LINE__, ##__VA_ARGS__)
Now when you use NSLog, the debugging console will show the names of the class and the method that the line is in, as well as the file name and line number of the logging statement:
NSLog(@"Yes");
logs:
2013-11-08 16:14:46.922 Logging[66492:70b] -[AppDelegate
application:didFinishLaunchingWithOptions:] [AppDelegate.m:20] Yes
Discussion
The compiler provides several “magic” variables that change based on where they’re used in your code.
For example, the LINE variable always contains the current line number in the file that’s currently being compiled, and the FILE variable contains the full path to the source code file that’s being compiled. The PRETTY_FUNCTION variable contains a nicely formatted version of the name of the current function, and includes information like the class that the method belongs to and whether it’s an instance method or a class method.
By defining a macro that replaces the NSLog method with one that adds more information, you can make all the existing NSLog calls in your project include a lot more information.
In the solution given in this recipe, we’ve done a little bit of extra coding to make the logs easier to read. We mentioned that the FILE variable contains the full path to the file that’s being compiled, but that’s often way too long—most of the time, you just want the filename. To get just the filename, you can turn the FILE variable into an NSString, and then send that string to the lastPathComponent method, which returns the last part of the path.
Creating Breakpoints That Use Speech
Problem
You want to receive audio notifications when something happens in your game.
Solution
Add a spoken breakpoint that doesn’t stop the game:
1. Add a breakpoint where you want a notification to happen.
2. Right-click the breakpoint, and choose Edit Breakpoint.
3. Turn on “Automatically continue after evaluating.”
4. Click Add Action.
5. Change the action type from Debugger Command to Log Message.
6. Type the text you want to speak.
7. Click Speak Message.
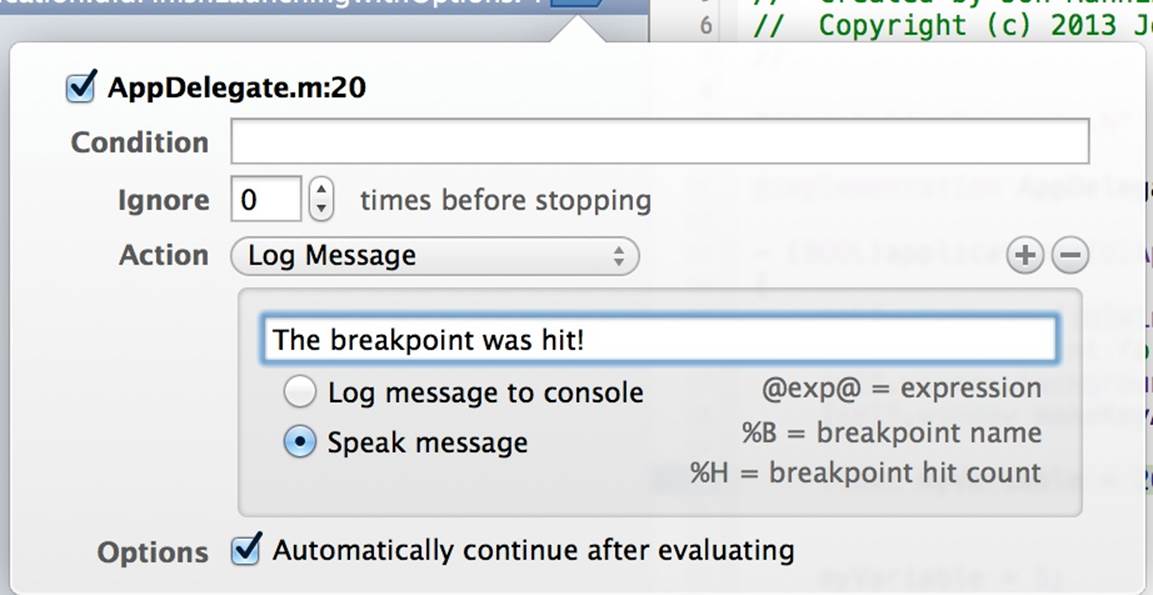
Figure 14-7. Making the breakpoint speak
When the breakpoint is hit, Xcode will speak the log message.
Discussion
Using spoken breakpoints is a really useful way to get notifications on what the game’s doing without having to switch away from the game. Breakpoints are spoken by your computer, not by the device, which means that they won’t interfere with your game’s audio (don’t forget to unmute your computer’s speakers).
All materials on the site are licensed Creative Commons Attribution-Sharealike 3.0 Unported CC BY-SA 3.0 & GNU Free Documentation License (GFDL)
If you are the copyright holder of any material contained on our site and intend to remove it, please contact our site administrator for approval.
© 2016-2025 All site design rights belong to S.Y.A.