iOS 8 Programming Fundamentals with Swift: Swift, Xcode, and Cocoa Basics (2015)
Part II. IDE
Chapter 9. Life Cycle of a Project
This chapter surveys some of the main stages in the life cycle of an Xcode project, from inception to submission at the App Store. This survey will provide an opportunity to discuss some additional features of the Xcode development environment: configuring your build settings and yourInfo.plist; editing, debugging, and testing your code; running your app on a device; profiling; localization; and final preparations for the App Store.
Device Architecture and Conditional Code
As you create a project (File → New → Project), after you pick a project template, in the screen where you name your project, the Devices pop-up menu offers a choice of iPad, iPhone, or Universal. You can change this setting later, using the Devices pop-up menu in the General tab when you edit the app target; but your life will be simpler if you decide correctly here, at the outset, because your decision can affect the details of the template on which your new project will be based. Your choice in the Devices pop-up menu also affects your project’s Targeted Device Family build setting:
iPad
The app will run only on an iPad.
iPhone
The app will run on an iPhone or iPod touch; it can also run on an iPad, but not as a native iPad app (it runs in a reduced enlargeable window, which I call the iPhone Emulator; Apple sometimes refers to this as “compatibility mode”).
iPhone/iPad (Universal in the Devices pop-up menu)
The app will run natively on both kinds of device.
Two additional project-level build settings determine what systems your device will run on:
Base SDK
The latest system your app can run on. As of this writing, in Xcode 6.3, you have just two choices, iOS 8.3 and Latest iOS (iOS 8.3). They sound the same, but the latter is better (and is the default for a new project). If you update Xcode to develop for a subsequent system, any existing projects that are already set to Latest iOS will use that newer system’s most recent SDK as their Base SDK automatically, without your also having to update their Base SDK setting.
iOS Deployment Target
The earliest system your app can run on: in Xcode 6.3, this can be any major iOS system all the way back to iOS 4.3. To change the project’s iOS Deployment Target setting easily, edit the project and switch to the Info tab, and choose from the iOS Deployment Target pop-up menu.
NOTE
To test your app on an earlier system, you’ll need a device, real or simulated, running an earlier system. You can download an iOS 7 SDK through Xcode’s Downloads preference pane (see Chapter 6), but to test on a system earlier than that, you’ll need an older version of Xcode, or preferably an older device.
Backward Compatibility
Writing an app whose Deployment Target differs from its Base SDK — that is, an app that is backward compatible to an earlier system — is something of a challenge. There are two chief problems:
Unsupported features
With each new system, Apple adds new features. Xcode will happily allow you to compile using any features of the Base SDK, even if they don’t exist on the Deployment Target system; but your app will crash if execution encounters features not supported by the system on which it is actually running. Thus, if you were to set the project’s Deployment Target to iOS 7, your project would compile and your app would run on iOS 7 even if it contained iOS 8–only features, but your app would crash on iOS 7 if any of those features were actually encountered.
Changed behavior
With each new system, Apple permits itself to change the way some features work. The result is that some features that exist on different systems may work differently depending what system it is. In some cases, the very same method may do two quite different things, depending on what system the app runs on. In other cases, an entire area of functionality may be handled differently on different systems, requiring you to implement or call a whole different set of methods or use a completely different set of classes.
Thus, backward compatibility will probably require that you write conditional code — that is, code such that one set of code executes when running on one system, another when running on another. There are various ways in which your app’s code can be executed conditionally based on the runtime environment:
Explicit environment test
The UIDevice class lets you query the current device (currentDevice) to learn its system version (systemVersion). Thus, for example:
let v = UIDevice.currentDevice().systemVersion
You could then run code conditionally based on whether the resulting version string is greater than or equal to "8.0".
Member safety
You can ask an object whether it is safe to send it a certain message. For example, there’s no point asking a UIViewController for its traitCollection on iOS 7; you’ll just crash if you do, because the traitCollection property was introduced in iOS 8. To find out if this is a safe move, you can use NSObject’s respondsToSelector: method (see also Chapter 10):
if self.respondsToSelector("traitCollection") {
let tc = self.traitCollection
// ...
}
Class safety
You’ll crash if you refer to a class that doesn’t exist. To learn whether a class exists, call the NSClassFromString function. It takes a string, so it’s safe — you’re not actually referring to the class — and it will return nil if the class doesn’t exist:
if NSClassFromString("UITraitCollection") != nil {
// safe to use UITraitCollection here ...
}
Constant safety
Testing constant names is tricky, because it can’t be done using Swift alone. You’ll have to use an Objective-C helper method. You can then take the address of the name; if it is nil, it isn’t safe to use. For example:
+ (BOOL) safeToUseSettingsString {
return &UIApplicationOpenSettingsURLString != nil;
}
I’ve implemented that class method in a category on UIApplication. Now I can call it from Swift:
if UIApplication.safeToUseSettingsString() {
// safe to refer to UIApplicationOpenSettingsURLString...
}
Framework safety
If a framework doesn’t exist, it isn’t enough to refrain from referring to any of its classes and methods in code; you mustn’t try to link to the framework in the first place, or you’ll crash. The framework is autolinked, because you imported it by its module name (see Chapter 6), but you can solve the problem by weak-linking the framework. This means that the framework won’t really be linked unless code that needs it is encountered. To weak-link a framework, link to it explicitly in the target’s Link Binary With Libraries build phase, and then change the Required pop-up menu item in the Status column of its listing to Optional (Figure 9-1).
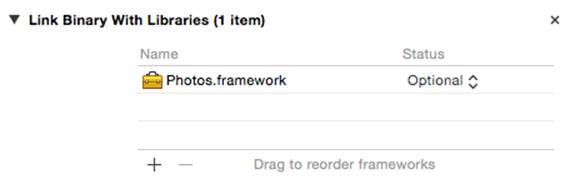
Figure 9-1. Weak-linking a framework
A project can also contain other resources, such as a nib file, that might not be compatible with earlier systems. For example, a nib file that uses size classes will misbehave on iOS 7, because size classes were not introduced until iOS 8. Similarly, setting an image’s rendering mode in an asset catalog won’t have any effect in iOS 7, because that feature of asset catalogs was introduced in iOS 8. And the rules for required icon sizes and launch image configuration, discussed later in this chapter, have changed greatly from system to system.
Device Type
It can be useful, in the case of a universal app, to react to whether your code is running on an iPad, on the one hand, or an iPhone or iPod, on the other. The UIDevice — or, on iOS 8, the current trait collection — will tell you the current device’s type as its userInterfaceIdiom, which will be a UIUserInterfaceIdiom, either .Phone or .Pad.
You can load resources conditionally depending on the device type or screen resolution. The most common case is that of images. If an image is loaded from the top level of your app bundle, name suffixes can be used, such as @2x and @3x (to indicate screen resolution) or ~iphone and~ipad (to indicate device type). In iOS 8, a better approach is to use the asset catalog. If an image set’s Devices pop-up menu is set to Universal, you get three slots for the image, 1x, 2x, and 3x, corresponding to the three possible screen resolutions; if it is set to Device Specific, you get two sets of slots, one for iPhone and one for iPad. By preparing your images in this way, a particular version of an image will be loaded automatically when you call UIImage’s init(named:), appropriate to the current device’s screen resolution or type.
Similarly, certain Info.plist settings come in multiple sets with name suffixes, so you can adopt one setting on one device type and another setting on another. It is quite common, for example, for a universal app to adopt one set of possible orientations on iPhone and another set on iPad: typically, the iPhone version permits a limited set of orientations and the iPad version permits all orientations. You can configure this in the General pane when you edit the target:
1. Switch the Devices pop-up menu to iPhone and check the desired Device Orientation checkboxes for the iPhone.
2. Switch the Devices pop-up menu to iPad and check the desired Device Orientation checkboxes for the iPad.
3. Switch the Devices pop-up menu to Universal.
Even though you’re now seeing just one set of orientations, both sets are remembered. What you’ve really done is to configure two groups of “Supported interface orientations” settings in the Info.plist, a general set (UISupportedInterfaceOrientations) and an iPad-only set that overrides the general case when the app launches on an iPad (UISupportedInterfaceOrientations~ipad). Examine the Info.plist file to see that this is so.
In the same way, your app can load different nib files, and thus different interfaces, depending on the device type. For example, you can have two main storyboards, loading one of them at launch if this is an iPhone and the other if this is an iPad. Again, you can configure this in the General pane when you edit the target, and again, what you’re really doing is telling the Info.plist setting “Main storyboard file base name” to appear twice, once for the general case (UIMainStoryboardFile) and once for iPad only (UIMainStoryboardFile~ipad). If your app loads a nib file by name, the naming of that nib file works like that of an image file: if there is an alternative nib file by the same name with ~ipad appended, it will load automatically if we are running on an iPad. For example, if you load a nib by the name "View" and there’s a file View~ipad.xib in your project, that nib will load on iPad.
If your app runs only on iOS 8 or later, however, you are less likely than in the past to need to distinguish one device type from another. In iOS 7 and before, entire interface object classes (such as popovers) were available only on the iPad; in iOS 8, there are no iPad-only classes, and the interface classes themselves adapt if your code is running on an iPhone. Similarly, in iOS 7 and before, a universal app might need a completely different interface, and hence a different set of nib files, depending on the device type; in iOS 8, size classes allow a single nib file to be configured conditionally depending on the device type. And in general the physical distinction between an iPad and an iPhone is not so sharp as in the past: thanks to the intermediate iPhone 6 and (especially) the iPhone 6 Plus, it’s more of a continuum.
Version Control
Sooner rather than later in the life of any real app, you should consider putting your project under version control. Version control is a way of taking periodic snapshots (technically called commits) of your project. Its purpose might be:
Security
Version control can help you store your commits in a repository offsite, so that your code isn’t lost in case of a local computer glitch or some equivalent “hit by a bus” scenario.
Collaboration
Version control affords multiple developers ready, rational access to the same code.
Freedom from fear
A project is a complicated thing; often, changes must be made experimentally, sometimes in many files, possibly over a period of many days, before a new feature can be tested. Version control means that I can easily retrace my steps (to some previous commit) if things go badly; this gives me confidence to start down some tentative programmatic road whose outcome may not be apparent until much later. Also, if I’m confused about what programmatic road I seem to be taking, I can ask a version control system to list the changes I’ve made recently. If an ancillary bug is introduced, I can use version control to pinpoint when it happened and help discover the cause.
Xcode provides various version control facilities, which are geared chiefly to git (http://git-scm.com) and Subversion (http://subversion.apache.org, also called svn). This doesn’t mean you can’t use any other version control system with your projects; it means only that you can’t use any other version control system in an integrated fashion from inside Xcode. That’s no disaster; there are many other ways to use version control, and even with git and Subversion, it is perfectly possible to ignore Xcode’s integrated version control and rely on the command line in Terminal, or use a specialized third-party GUI front end such as svnX for Subversion (http://www.lachoseinteractive.net/en/products) or SourceTree for git (http://www.sourcetreeapp.com).
If you don’t want to use Xcode’s integrated version control, you can turn it off more or less completely. If you uncheck Enable Source Control in the Source Control preference pane, the only thing you’ll be able to do is choose Check Out from the Source Control menu, to fetch code from a remote server. If you check Enable Source Control, three additional checkboxes let you select which automatic behaviors you want. Personally, I like to check Enable Source Control along with “Refresh local status automatically,” so that Xcode displays a file’s status in the Project navigator; I leave the two additional checkboxes unchecked, because I’m a manual control kind of person.
When you create a new project, the Save dialog includes a checkbox that offers to place a git repository into your project folder from the outset. This can be purely local to your computer, or you can choose a remote server. If you have no reason to decide otherwise, I suggest that you check that checkbox!
When you open an existing project, if that project is already managed with Subversion or git, Xcode detects this and is ready instantly to display version control information in its interface. If a remote repository is involved, Xcode automatically enters information for it in the Accounts preference pane, which is the unified interface for repository management. To use a remote server without having a working copy checked out from it, enter its information manually in the Accounts preference pane.
Source control actions are available in two places: the Source Control menu and the contextual menu in the Project navigator. To check out and open a project stored on a remote server, choose Source Control → Check Out. Other items in the Source Control menu are obvious, such as Commit, Push, Pull (or Update), Refresh Status, and Discard Changes. Note particularly the first item in the Source Control menu, which lists all open working copies by name and branch; its hierarchical menu items let you perform rudimentary branch management.
Files in the Project navigator are marked with their status. For example, if you’re using git, you can distinguish modified files (M), new untracked files (?), and new files added to the index (A). (If you’ve unchecked “Refresh local status automatically,” those markings may not appear until you choose Source Control → Refresh Status.)
When you choose Source Control → Commit, you’re shown a comparison view of all changes in all changed files. Each change can be excluded from this commit (or reverted entirely), so it’s possible to group related file hunks into meaningful commits. A similar comparison view is available for any commit by choosing Source Control → History. (But Xcode has nothing like the visual branch representation of git’s own gitk tool.) Merge conflicts are also presented in a useful graphical comparison interface.
You can also see a comparison view for the file being currently edited, at any time, through the Version editor; choose View → Version Editor → Show Version Editor, or click the third Editor button in the project window toolbar. The Version editor actually has three modes: Comparison view, Blame view, and Log view (choose from View → Version Editor, or use the pop-up menu from the third Editor button in the toolbar when the Version editor is showing).
For example, in Figure 9-2, I can see that in the more recent version of this file (on the left) I’ve changed my supportedInterfaceOrientations implementation (because the Swift language changed). If I choose Editor → Copy Source Changes, the corresponding diff text (a patch file) is placed on the clipboard. If I switch to Blame view I can see my own commit message. The jump bar at the bottom of the Version editor permits me to view any commit’s version of the current file in the editor.
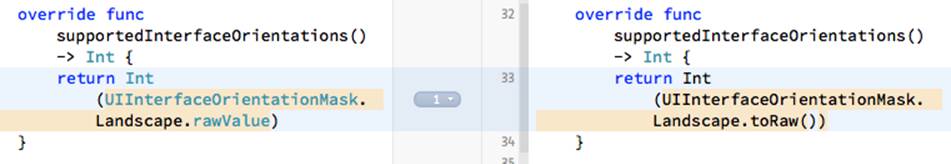
Figure 9-2. Version comparison
Another way to learn how a line was changed is to select within that line (in the normal editor) and choose Editor → Show Blame For Line. A popover appears, describing the commit where this line changed to its current form; using buttons in that popover, you can switch to Blame view or Comparison view.
Xcode also contains its own way of taking and storing a snapshot of your project as a whole; this is done using File → Create Snapshot (and, according to your settings, some mass operations such as find-and-replace or renaming a project may offer to take a snapshot first). Although these snapshots are not to be treated as full-fledged version control, they are in fact maintained as git repositories, and can certainly serve the purpose of giving confidence in advance of performing some change that might subsequently engender regret. Snapshots are managed in the Projects tab of the Organizer window; here you can export a snapshot, thus resurrecting an earlier state of your project folder.
Editing and Navigating Your Code
Many aspects of Xcode’s editing environment can be modified to suit your tastes. Your first step should be to pick a Source Editor font face and size you like in Xcode’s Fonts & Colors preference pane. Nothing is so important as being able to read and write code comfortably! I like a largish size (13, 14 or even 16) and a pleasant monospaced font such as Menlo or Consolas, or the freeware Inconsolata (http://levien.com/type/myfonts/) or Source Code Pro (https://github.com/adobe-fonts/source-code-pro).
Xcode has some automatic formatting, autotyping, and text selection features. Exactly how these behave depends upon your settings in the Editing and Indentation tabs of Xcode’s Text Editing preference pane. I’m not going to describe these settings in detail, but I urge you to take advantage of them. Under Editing, I like to check just about everything, including Line Numbers; visible line numbers are useful when debugging. Under Indentation, I like to have just about everything checked too; I find the way Xcode lays out code to be excellent with these settings.
TIP
If you like Xcode’s smart syntax-aware indenting, but you find that once in a while a line of code isn’t indenting itself correctly, choose Editor → Structure → Re-Indent (Control-I), which autoindents the current line or selection.
With “Enable type-over completions” checked, Xcode helps balance delimiters. For example, suppose I intend to make a UIView by calling its initializer init(frame:). I type as far as this:
let v = UIView(fr
Xcode automatically appends the closing right parenthesis, with the insertion point still positioned before it:
let v = UIView(fr)
// I have typed ^
That closing right parenthesis, however, is tentative; it’s in gray. Now I finish typing the parameter; the right parenthesis is still gray:
let v = UIView(frame:r)
// I have typed ^
I can now confirm the closing right parenthesis in any of several ways: I can actually type a right parenthesis, or I can type Tab or Right arrow. The tentative right parenthesis is replaced by a real right parenthesis, and the insertion point is now positioned after it, ready for me to continue typing. Xcode behaves similarly with double quotes, right curly braces, right square brackets, and so on.
Autocompletion
As you write code, you’ll take advantage of Xcode’s autocompletion feature. Cocoa type names and method names are astonishingly verbose, and whatever reduces your time and effort typing will be a relief. However, I personally do not check “Suggest completions while typing” under Editing; instead, I check “Use Escape key to show completion suggestions,” and when I want autocompletion to happen, I ask for it manually, by pressing Esc.
For example, suppose I want my code to create an alert. I type as far as UIAlertController( and press Esc. A menu pops up, listing the four initializers appropriate to a UIAlertController (Figure 9-3). You can navigate this menu, dismiss it, or accept the selection, using only the keyboard. So, if it were not already selected by default, I would navigate to title:... with the Down arrow key, and press Return to accept the selected choice.
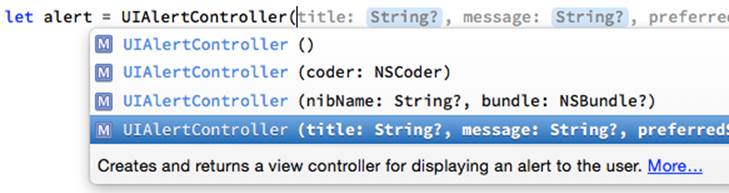
Figure 9-3. The autocompletion menu
When I choose an alternative from the autocompletion menu, the template for the method call is entered in my code (I’ve broken it into multiple lines here):
let alert = UIAlertController(
title: <#String?#>,
message: <#String?#>,
preferredStyle: <#UIAlertControllerStyle#>)
The expressions in <#...#> are placeholders, showing the type of each parameter. They appear in Xcode as cartouche-like “text tokens” (see Figure 9-3) to prevent them from being edited accidentally. You can select the next placeholder with Tab or by choosing Navigate → Jump to Next Placeholder (Control-/). Thus I can select a placeholder and type over it, entering the actual argument I wish to pass, select the next placeholder and type that argument, and so forth. To convert a placeholder to a normal string without the delimiters, select it and press Return, or double-click it.
Autocompletion and its contextual intelligence works for object type names, method calls, and property names. It also works when you’re entering a declaration for a function that’s inherited or defined in an adopted protocol. You don’t need to type even the initial func; just type the first few letters of the method’s name. For example, in my app delegate class I might type:
applic
If I then press Esc, I see a list of methods such as application:didFinishLaunchWithOptions:; these are methods that might be sent to my app delegate (by virtue of its being the app delegate, as discussed in Chapter 11). When I choose one, the entire declaration is filled in for me, including the curly braces:
func application(application: UIApplication,
didFinishLaunchingWithOptions launchOptions: [NSObject : AnyObject]?)
-> Bool {
<#code#>
}
A placeholder for the code appears between the curly braces, and it is selected, ready for me to start entering the body of the function. If a function needs an override designation, Xcode’s code completion provides it.
Snippets
Code autocompletion is supplemented by code snippets. A code snippet is a bit of text with an abbreviation. Code snippets are kept in the Code Snippet library (Command-Option-Control-2), but a code snippet’s abbreviation is globally available to code completion, so you can use a snippet without showing the library: you type the abbreviation and the snippet’s name is included among the possible completions.
For example, to enter a class declaration at the top level of a file, I would type class and press Esc, to get autocompletion, and select “Swift Class” or “Swift Subclass.” When I press Return, the template appears in my code: the class name and superclass name are placeholders, the curly braces are provided, and the body of the declaration (between the curly braces) is another placeholder.
To learn a snippet’s abbreviation, you must open its editing window — double-click the snippet in the Code Snippet library — and click Edit. If learning a snippet’s abbreviation is too much trouble, simply drag it from the Code Snippet library into your text. The filter bar (Edit → Filter → Filter in Library, Command-Option-L) helps you reach a snippet by name quickly.
You can add your own snippets, which will be categorized as User snippets; the easiest way is to drag text into the Code Snippet library. Edit to suit your taste, providing a name, a description, and an abbreviation; the Completion Scopes pop-up menu lets you narrow the contexts in which the snippet will be available through code completion. In the text of the snippet, use the <#...#> construct to form any desired placeholders.
For example, I’ve created an outlet snippet defined like this:
@IBOutlet var <#name#> : <#type#>!
And I’ve created an action snippet defined like this:
@IBAction func <#name#> (sender:AnyObject!) {
<#code#>
}
My other snippets constitute a personal library of utility functions that I’ve developed. For example, my delay snippet inserts my dispatch_after wrapper function (see Delayed Performance).
Fix-it and Live Syntax Checking
Xcode’s Fix-it feature can make and implement positive suggestions on how to avert a problem. To summon it, click on an issue badge in the gutter. Such an issue badge will appear after compilation if there’s a problem.
For instance, Figure 9-4, at the top, shows that I’ve accidentally forgotten the parentheses after a method call. This causes a compile error, because the backgroundColor property that I’m trying to set is a UIColor, not a function. But the stop-sign icon next to the error tells me that Fix-it has a suggestion. I click the stop-sign icon, and Figure 9-4, at the bottom, shows what happens: a Fix-It dialog pops up, telling me how it proposes to fix the problem — by inserting the parentheses. Moreover, Xcode is showing me what my code would look like if Fix-It did fix the problem in this way. If I press Return, or double-click the “Fix-it” button in the dialog, Xcode really inserts the parentheses — and the error vanishes, because the problem is solved.
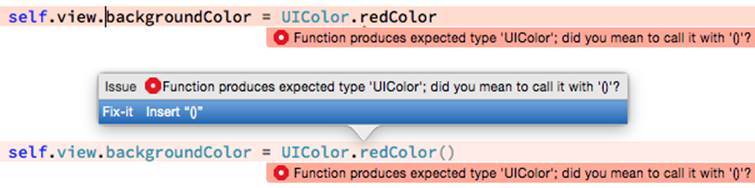
Figure 9-4. A compile error with a Fix-it suggestion
TIP
If you’re confident that Xcode will do the right thing, choose Editor → Fix All in Scope (Command-Option-Control-F), and Xcode will implement all nearby Fix-it suggestions without your even having to show the dialog.
Live syntax checking is like a form of continual compilation. Even if you don’t compile or even save, live syntax checking can detect the presence of a problem, and can suggest the solution with Fix-it. This feature can be toggled on or off using the “Show live issues” checkbox in the General preference pane.
Personally, I find live syntax checking intrusive. My code is almost never valid while I’m in the middle of typing, because the terms and parentheses are always half-finished; that’s what it means to be typing! For example, merely typing a left parenthesis will instantly cause the syntax checker to complain of a parse error (until I type the corresponding right parenthesis); I hate that. So I’ve got “Show live issues” unchecked.
Navigation
Developing an Xcode project involves editing code in many files at once. Fortunately, Xcode provides numerous ways to navigate your code, many of which have been mentioned in previous chapters. Here are some of Xcode’s chief forms of navigation:
The Project navigator
If you know something about the name of a file, you can find it quickly in the Project navigator (Command-1) by typing into the search field in the filter bar at the bottom of the navigator (Edit → Filter → Filter in Navigator, Command-Option-J). For example, type story to see just your .storyboard files. Moreover, after using the filter bar, you can press Tab and then the Up or Down arrow key to navigate the Project navigator; thus you can reach the desired file with the keyboard alone.
The Symbol navigator
If you highlight the first two icons in the filter bar (the first two are blue, the third is dark), the Symbol navigator lists your project’s object types and their members. Click on a symbol to navigate to its declaration in the editor. As with the Project navigator, the filter bar’s search field can help get you where you want to go.
The jump bar
Every path component of the code editor’s jump bar is a menu:
The bottom level
At the bottom level (farthest right) in the jump bar is a list of your file’s object and member declarations, in the order in which they appear (hold Command while choosing the menu to see them in alphabetical order); choose one to navigate to it.
You can inject bold section titles into this bottom-level menu using a comment whose first word is MARK:. For example, try modifying ViewController.swift in our Empty Window project:
// MARK: - view lifecycle
override func viewDidLoad() {
super.viewDidLoad()
}
The result is that the viewDidLoad item in the bottom-level menu is preceded by view lifecycle. To make a divider line in the menu, type a MARK: comment whose value is a hyphen; in the preceding example, both a hyphen (to make a divider line) and a title (to make a bold title) are used. Similarly, comments starting with TODO: and FIXME: will appear in the bottom-level menu.
Higher levels
Higher-level path components are hierarchical menus; thus you can use any of them to work your way down the file hierarchy.
History
Each editor pane remembers the names of files you’ve edited in it. The Back and Forward triangles are both buttons and pop-up menus (or choose Navigate → Go Back and Navigate → Go Forward, Command-Control-Left and Command-Control-Right).
Related items
The leftmost button in the jump bar summons the Related Items menu, a hierarchical menu of files related to the current file, such as superclasses and adopted protocols. This list even includes functions that call or are called by the currently selected function.
TIP
A path component menu in the jump bar can be filtered! Start typing while a jump bar menu is open, to filter what the menu displays. This filtering uses an “intelligent” search, not a strict text containment search; for example, typing “adf” will find application:didFinishLaunchingWithOptions: (if it’s present in the menu).
The Assistant pane
The Assistant pane lets you be in two places at once (see Chapter 6). Hold Option while navigating to open something in an Assistant pane instead of the primary editor pane. The Tracking menu in an Assistant pane’s jump bar sets its automatic relationship to the main pane.
Tabs and windows
You can also be in two places at once by opening a tab or a separate window (again, see Chapter 6).
Jump to definition
Navigate → Jump to Definition (Command-Control-J) lets you jump to the declaration of the symbol already selected in your code.
Open quickly
File → Open Quickly (Command-Shift-O) opens a dialog where you can search for a symbol in your code and in the framework headers.
Breakpoints
The Breakpoint navigator lists all breakpoints in your code. Xcode lacks code bookmarks, but you can misuse a disabled breakpoint as a bookmark. Breakpoints are discussed later in this chapter.
Finding
Finding is a form of navigation. Xcode has both a global find (Find → Find in Project, Command-Shift-F), which is the same as using the Search navigator, and an editor-level find (Find → Find, Command-F); don’t confuse them.
Find options are all-important. Additional options and capabilities appear in a pop-up menu when you click the magnifying glass icon in the search field. The global find options include a scope, allowing you to specify in sophisticated ways which files will be searched: click the current scope to see the Search Scopes panel, where you can select a different scope or create a custom scope. You can also find using regular expressions. There’s a lot of power lurking here.
To replace text, click on the word Find at the left end of the search bar to summon the pop-up menu, and choose Replace. You can replace all occurrences (Replace All), or select particular find results in the Search navigator and replace only those (Replace); you can also delete find results from the Search navigator, to protect them from being affected by Replace All. The Search navigator’s Preview button summons a dialog that shows you the effect of each possible replacement, and lets you accept or reject particular replacements in advance of performing the replacement. For editor-level find, hold Option before clicking Replace All, to find-and-replace within only the current selection.
A sophisticated form of editor-level find is Editor → Edit All In Scope, which finds simultaneously all occurrences of the currently selected term within the same scope; you can use this to change the name of a variable or function throughout its scope, or just to survey how the name is used.
Running in the Simulator
When you build and run with the Simulator as the destination, you run in the iOS Simulator application. The Simulator window represents a device. Depending on your app target’s Base SDK, Deployment Target, and Targeted Device Family build settings, and on what SDKs you have installed, you may have choices about the device and system to be represented by the Simulator as you choose your destination before running (see Chapter 6).
The Simulator window can be displayed at one-quarter, one-third, half, three-quarter, or full size (choose from Window → Scale). This is a matter of display merely, comparable to zooming the window. For example, you might run a double-resolution device in the Simulator at full size to see every pixel, or at half size to save space.
You can interact with the Simulator in some of the same basic ways as you would a device. Using the mouse, you can tap on the device’s screen; hold Option to make the mouse represent two fingers moving symmetrically around their common center, and Option-Shift to represent two fingers moving in parallel. To click the Home button, choose Hardware → Home (Command-Shift-H). (Because of multitasking, clicking the Home button to switch from the app you’re running in Xcode to the home screen does not stop your app running, in Xcode or on the Simulator. To quit your app in the Simulator, quit the Simulator, or switch to Xcode and choose Product → Stop.) Items in the Hardware menu also let you perform hardware gestures such as rotating the device, shaking it, and locking its screen; you can also test your app by simulating certain rare events, such as a low-memory situation.
The Debug menu in the Simulator is useful for detecting problems with animations and drawing. Toggle Slow Animations makes animations unfold in slow motion so that you can see in detail what’s happening. The next four menu items (their names begin with Color) are similar to features available when running using Instruments, under the Core Animation instrument, revealing possible sources of inefficiency in screen drawing.
The Debug menu also lets you open the log in the Console application, and lets you set the simulated device’s location (useful when testing a Core Location app).
Debugging
Debugging is the art of figuring out what’s wrong with the behavior of your app as it runs. I divide this art into two main techniques: caveman debugging and pausing your running app.
Caveman Debugging
Caveman debugging consists of altering your code, usually temporarily, typically by adding code to dump informative messages into the console. You can view the console in the Debug pane; Chapter 6 describes a technique for displaying the console in a tab of its own.
The standard Swift command for sending a message to the console is the println function (or print if you don’t want a final linebreak). Using Swift’s string interpolation and the Printable protocol (which requires a description property; see Chapter 4), you can pack a lot of useful information into a println call. Cocoa objects generally have built-in description property implementations. For example:
println(self.view)
The output in the console reads something like this (I’ve formatted it for clarity here):
<UIView: 0x79121d40;
frame = (0 0; 320 480);
autoresize = RM+BM;
layer = <CALayer: 0x79121eb0>>
We learn the object’s class, its address in memory (useful for confirming whether two instances are in fact the same instance), and the values of some additional properties.
If you’re importing Foundation — and in real life iOS programming, you are — you also have access to the NSLog C function. It takes an NSString which operates as a format string, followed by the format arguments. A format string is a string containing symbols called format specifiers, for which values (the format arguments) will be substituted at runtime. All format specifiers begin with a percent sign (%), so the only way to enter a literal percent sign in a format string is as a double percent sign (%%). The character(s) following the percent sign specify the type of value that will be supplied at runtime. The most common format specifiers are %@ (an object reference), %d (an int), %ld (a long), and %f (a double). For example:
NSLog("the view: %@", self.view)
In that example, self.view is the first (and only) format argument, so its value will be substituted for the first (and only) format specifier, %@, when the format string is printed in the console:
2015-01-26 10:43:35.314 Empty Window[23702:809945]
the view: <UIView: 0x7c233b90;
frame = (0 0; 320 480);
autoresize = RM+BM;
layer = <CALayer: 0x7c233d00>>
I like NSLog’s output because it provides the current time and date, along with the process name, process ID, and thread ID (useful for determining whether two logging statements are called on the same thread). Also, NSLog is thread-safe, whereas it appears that println is not.
For the complete repertory of format specifiers available in a format string, read Apple’s document String Format Specifiers (in the String Programming Guide). The format specifiers are largely based on those of the C printf standard library function.
The main ways to go wrong with NSLog (or any format string) are to supply a different number of format arguments from the number of format specifiers in the string, or to supply an argument value different from the type declared by the corresponding format specifier. I often see beginners claim that logging shows a certain value to be nonsense, when in fact it is their NSLog call that is nonsense; for example, a format specifier was %d but the value of the corresponding argument was a float. Another common mistake is treating an NSNumber as if it were the type of number it contains; an NSNumber isn’t any kind of number — it’s an object (%@). Problems with signed vs. unsigned integers, or 32-bit vs. 64-bit numbers, can be tricky as well.
C structs are not objects, so they cannot provide a description. But Swift extends some of the most common C structs as Swift structs, and thus allows them to be printed with println. Thus, for example, this works:
println(self.view.frame) // (0.0,0.0,320.0,480.0)
However, you can’t do the same thing with NSLog. For this reason, common Cocoa structs are usually accompanied by convenience functions that render them as strings. For example:
NSLog("%@", NSStringFromCGRect(self.view.frame)) // {{0, 0}, {320, 480}}
If a C struct is not extended as a Swift struct, then you’ll need to use the convenience function even with println. For example:
let edges : UIEdgeInsets = UIEdgeInsetsMake(6,0,6,0)
println(edges) // C.UIEdgeInsets
println(NSStringFromUIEdgeInsets(edges)) // {6, 0, 6, 0}
TIP
Swift defines four special literals, particularly useful when logging because they describe their own position in the surrounding file: __FILE__, __LINE__, __COLUMN__, and __FUNCTION__.
You will probably want to remove your logging calls before shipping your app, as you won’t want your finished app to dump unnecessary messages into the console. A useful trick is to put your own global function in front of Swift’s println function:
func println(object: Any) {
Swift.println(object)
}
When it’s time to stop logging, just comment out the second line:
func println(object: Any) {
// Swift.println(object)
}
If you prefer this to be automatic, you can use conditional compilation. Swift’s conditional compilation is rudimentary, but it’s sufficient for this task. For example, we can make the body of our function depend upon a DEBUG flag:
func println(object: Any) {
#if DEBUG
Swift.println(object)
#endif
}
That code depends upon a DEBUG flag that doesn’t actually exist. To make it exist, create it in your target’s build settings, under Other Swift Flags. The value that defines a flag called DEBUG is -D DEBUG. If you define this for the Debug configuration but not for the Release configuration (Figure 9-5), then a debug build (build and run in Xcode) will log with println, but a release build (archive and submit to the App Store) will not.
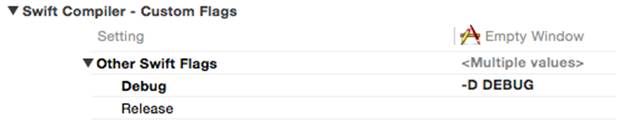
Figure 9-5. Defining a Swift flag
Another useful form of caveman debugging is deliberately aborting your app because something has gone seriously wrong. See the discussion of assert and fatalError in Chapter 5. fatalError works even in a Release build, and should be used only if it will never be encountered by the path of execution. By default, assert never fails in a Release build, so it is safe to leave it in your code when your app is ready to ship; by that time, of course, you should be confident that the bad situation your assert was intended to detect has been debugged and will never actually occur.
Purists may scoff at caveman debugging, but I use it heavily: it’s easy, informative, and lightweight. And sometimes it’s the only way. Unlike the debugger, console logging works with any build configuration (Debug or Release) and wherever your app runs (in the Simulator or on a device). It works when pausing is impossible (because of threading issues, for example). It even works on someone else’s device, such as a tester to whom you’ve distributed your app. It’s a little tricky for a tester to get a look at the console so as to be able to report back to you, but it can be done: for example, the tester can connect the device to a computer and view its log in Xcode’s Devices window or with Apple’s iPhone Configuration Utility.
The Xcode Debugger
When you’re building and running in Xcode, you can pause in the debugger and use Xcode’s debugging facilities. The important thing, if you want to use the debugger, is that the app should be built with the Debug build configuration (the default for a scheme’s Run action). The debugger is not very helpful against an app built with the Release build configuration, not least because compiler optimizations can destroy the correspondence between steps in the compiled code and lines in your code.
Breakpoints
There isn’t a strong difference between running and debugging in Xcode; the main distinction is whether breakpoints are effective or ignored. The effectiveness of breakpoints can be toggled at two levels:
Globally (active vs. inactive)
Breakpoints as a whole are either active or inactive. If breakpoints are inactive, we won’t pause at any breakpoints.
Individually (enabled vs. disabled)
A given breakpoint is either enabled or disabled. Even if breakpoints are active, we won’t pause at this one if it is disabled. Disabling a breakpoint allows you to leave in place a breakpoint that you might need later without pausing at it every time it’s encountered.
To create a breakpoint (Figure 9-6), select in the editor the line where you want to pause, and choose Debug → Breakpoints → Add Breakpoint at Current Line (Command-\). This keyboard shortcut toggles between adding and removing a breakpoint for the current line. The breakpoint is symbolized by an arrow in the gutter. Alternatively, a simple click in the gutter adds a breakpoint; to remove a breakpoint gesturally, drag it out of the gutter.
![]()
Figure 9-6. A breakpoint
To disable a breakpoint at the current line, click on the breakpoint in the gutter to toggle its enabled status. Alternatively, Control-click on the breakpoint and choose Disable Breakpoint in the contextual menu. A dark breakpoint is enabled; a light breakpoint is disabled (Figure 9-7).
![]()
Figure 9-7. A disabled breakpoint
To toggle the active status of breakpoints as a whole, click the Breakpoints button in the bar at the top of the Debug pane, or choose Debug → Activate/Deactivate Breakpoints (Command-Y). The active status of breakpoints as a whole doesn’t affect the enabled or disabled status of any breakpoints; if breakpoints are inactive, they are simply ignored en masse, and no pausing at breakpoints takes place. Breakpoint arrows are blue if breakpoints are active, gray if they are inactive.
Once you have some breakpoints in your code, you’ll want to survey and manage them. That’s what the Breakpoint navigator is for. Here you can navigate to a breakpoint, enable or disable a breakpoint by clicking on its arrow in the navigator, and delete a breakpoint.
You can also edit a breakpoint’s behavior. Control-click on the breakpoint, in the gutter or in the Breakpoint navigator, and choose Edit Breakpoint; or Command-Option-click the breakpoint. This is a very powerful facility: you can have a breakpoint pause only under a certain condition or after it has been encountered a certain number of times, and you can have a breakpoint perform one or more actions when it is encountered, such as issuing a debugger command, logging, playing a sound, speaking text, or running a script.
A breakpoint can be configured to continue automatically after performing its action when it is encountered. This can be an excellent alternative to caveman debugging: instead of inserting a println or NSLog call, which must be compiled into your code and later removed when the app is released, you can set a breakpoint that logs and continues. By definition, such a breakpoint operates only when you’re actively debugging the project; it won’t dump any messages into the console when the app runs on a user’s device, because there are no breakpoints on a user’s device.
Certain special kinds of breakpoint can be created in the Breakpoint navigator — click the Plus button at the bottom of the navigator and choose from its pop-up menu — or by choosing from the Debug → Breakpoints hierarchical menu:
Exception breakpoint
An exception breakpoint causes your app to pause at the time an exception is thrown or caught, without regard to whether the exception would crash your app later. I recommend that you create an exception breakpoint to pause on all exceptions when they are thrown, because this gives the best view of the call stack and variable values at the moment of the exception (rather than later when the crash actually occurs); you can see where you are in your code, and you can examine variable values, which may help you understand the cause of the problem. If you do create such an exception breakpoint, I also suggest that you use the contextual menu to say Move Breakpoint To → User, which makes this breakpoint permanent and global to all your projects.
WARNING
Sometimes Apple’s code will throw an exception and catch it, deliberately. This isn’t a crash, and nothing has gone wrong; but if you’ve created an exception breakpoint, your app will pause at it, which can be confusing.
Symbolic breakpoint
A symbolic breakpoint causes your app to pause when a certain method or function is called, regardless of what object called it or to what object the message is sent. A method may be specified in one of two ways:
Using Objective-C notation
The instance method or class method symbol (- or +) followed by square brackets containing the class name and the method name. For example:
-[UIApplication beginReceivingRemoteControlEvents]
By method name
The method name alone. The debugger will resolve this for you into all possible class–method pairs, as if you had entered them using the Objective-C notation that I just described. For example:
beginReceivingRemoteControlEvents
Paused at a breakpoint
When the app runs with breakpoints active and an enabled breakpoint is encountered (and assuming its conditions are met, and so on), the app pauses. In the active project window, the editor shows the file containing the point of execution, which will usually be the file containing the breakpoint. The point of execution is shown as a green arrow; this is the line that is about to be executed (Figure 9-8). Depending on the settings for Running → Pauses in the Behaviors preference pane, the Debug navigator and the Debug pane may also appear.
![]()
Figure 9-8. Paused at a breakpoint
Here are some things you might like to do while paused at a breakpoint:
See where you are
One common reason for setting a breakpoint is to make sure that the path of execution is passing through a certain line. Functions listed in the call stack in the Debug navigator with a User icon, with the text in black, are yours; click one to see where you are paused in that function. (Listings with the text in gray are functions and methods for which you have no source code, so there would be little point clicking one unless you know something about assembly language.) You can also view and navigate the call stack using the jump bar at the top of the Debug pane.
Study variable values
In the Debug pane, variable values for the current scope (corresponding to what’s selected in the call stack) are visible in the variables list. You can see additional object features, such as collection elements, properties, and even some private information, by opening triangles. (Local variable values are shown even if, at the point where are paused, those variables have not yet been initialized; such values are meaningless, so ignore them.)
You can use the search field to filter variables by name or value. If a formatted summary isn’t sufficiently helpful, you can send description (or, if this object adopts DebugPrintable, debugDescription) to an object variable and view the output in the console: choose Print Description of [Variable] from the contextual menu, or select the variable and click the Info button below the variables list.
You can also view a variable’s value graphically: select the variable and click the Quick Look button (an eye icon) below the variables list, or press Spacebar. For example, in the case of a CGRect, the graphical representation is a correctly proportioned rectangle. You can make instances of your own custom class viewable in the same way; declare the following method and return an instance of one of the permitted types (see Apple’s Quick Look for Custom Types in the Xcode Debugger):
@objc func debugQuickLookObject() -> AnyObject {
// ... create and return your graphical object here ...
}
You can also inspect a variable’s value in place in your code, by examining its data tip. To see a data tip, hover the mouse over the name of a variable in your code. The data tip is much like the display of this value in the variables list: there’s a flippy triangle that you can open to see more information, plus an Info button that displays the value description here and in the console, and a Quick Look button for showing a value graphically (Figure 9-9).
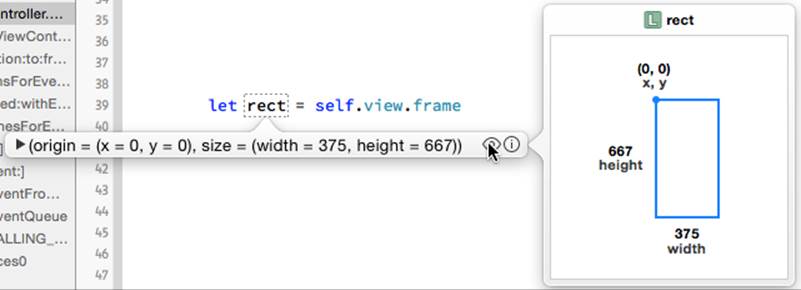
Figure 9-9. A data tip
Inspect your view hierarchy
New in Xcode 6, you can study the view hierarchy while paused in the debugger. Click the Debug View Hierarchy button in the debug bar, or choose Debug → View Debugging → Capture View Hierarchy. Views are listed in an outline in the Debug navigator. The editor displays your views; this is a three-dimensional projection that you can rotate. The Object inspector and Size inspector display information about the currently selected view.
Manage expressions
An expression is code to be added to the variables list and evaluated every time we pause. Choose Add Expression from the contextual menu in the variables list. The expression is evaluated within the current context in your code, so be careful of side effects.
Talk to the debugger
You can communicate directly with the debugger through the console. Xcode’s debugger interface is a front end to the real debugger, LLDB (http://lldb.llvm.org); by talking directly to LLDB, you can do everything that you can do through the Xcode debugger interface, and more. A common command is expression (or expr, or simply e), which evaluates an expression in the current language — Swift or Objective-C, depending on the language of the source file where you’re paused in the call stack. The expression is evaluated in the current context. Any LLDB console command is also eligible to be used as a breakpoint’s Debugger Command action.
Fiddle with breakpoints
You are free to create, destroy, edit, enable and disable, and otherwise manage breakpoints dynamically even while your app is running, which is useful because where you’d like to pause next might depend on what you learn while you’re paused here. Indeed, this is one of the main advantages of breakpoints over caveman debugging. To change your caveman debugging, you have to stop the app, edit it, rebuild it, and start running the app all over again. But to fiddle with breakpoints, you don’t have to be stopped; you don’t even have to be paused! An operation that went wrong, if it doesn’t crash your app, can probably be repeated in real time; so you can just add a breakpoint and try again. For example, if tapping a button produces the wrong results, you can add a breakpoint to the action handler and tap the button again; you pass through the same code, and this time you can work out what the trouble is.
Step or continue
To proceed with your paused app, you can either resume running until the next breakpoint is encountered (Debug → Continue) or take one step and pause again. Also, you can select in a line and choose Debug → Continue to Current Line (or Continue to Here from the contextual menu), which effectively sets a breakpoint at the chosen line, continues, and removes the breakpoint. The stepping commands (in the Debug menu) are:
Step Over
Pause at the next line.
Step Into
Pause in your function that the current line calls, if there is one; otherwise, pause at the next line.
Step Out
Pause when we return from the current function.
You can access these commands through convenient buttons in the bar at the top of the Debug pane. Even if the Debug pane is collapsed, the bar containing the buttons appears while running.
Start over, or abort
To kill the running app, click Stop in the toolbar (Product → Stop, Command-Period). Clicking the Home button in the Simulator (Hardware → Home) or on the device does not stop the running app in the multitasking world of iOS 4 and later. To kill the running app and relaunch it without rebuilding it, Control-click Run in the toolbar (Product → Perform Action → Run Without Building, Command-Control-R).
You can make changes to your code while the app is running or paused, but those changes are not magically communicated to the running app; there are programming milieus where that sort of thing is possible, but Xcode is not among them. You must stop the app and run in the normal way (which includes building) to see your changes in action.
Unit Testing
A unit test is code that isn’t part of your app target, whose purpose is to exercise code that is part of your app target, making sure that it works as expected. For example, a unit test might call some method in your app target code, handing it various parameters and looking to see if the expected result is returned each time, not just under normal conditions but also when incorrect or extreme inputs are supplied. It can even be useful to write unit tests before writing the real code, as a way of developing a working algorithm. In addition, having initially ascertained that your code passes your tests, you continue to run those tests to detect whether a bug has been introduced during the course of development.
NOTE
Unit tests are not a means of exercising your app as a whole, guiding it through use case scenarios by effectively tapping buttons with a ghost finger to make sure that the interface behaves as expected. Unit tests are for probing your code’s business logic, not for verifying its interface.
Tests are bundled in a target of your project (see Chapter 6). The application templates generate projects with a test target in addition to the app target. You can easily create a new test target at any time: just make a new target and specify iOS → Other → Cocoa Touch Testing Bundle. By default, test code is recompiled every time you build and run your app (as specified in the scheme’s Build action); thus, you won’t be able to build and run your app unless it is also possible to build your tests. However, your tests do not run until you explicitly run them. Tests can be managed and run easily from the Test navigator (Command-5) as well as from within a test class file.
WARNING
When you rename a project that contains a test target (Renaming Parts of a Project), the test target breaks, because its Bundle Loader and Test Host build settings are not revised to refer to the built app and its binary by their new names. And, because the scheme’s Build action is configured to build the test target whenever you build, now you can’t build your app! This is a serious bug in the renaming process. If you’re reluctant to fix the build settings by hand, delete the test target and its files and create a new test target. (If you have written test code in the test target files, don’t forget to preserve it somehow.)
A test class is a subclass of XCTestCase (which is itself a subclass of XCTest). A test method is an instance method of a test class, returning no value and taking no parameters, whose name starts with test. The test target depends upon the app target, meaning that before a test class can be compiled and built, the app target must be compiled and built. Running a test also runs the app; the test target’s product is a bundle, which is loaded into the app as it launches.
Each test method will call one or more test asserts; in Swift, these are global functions whose names begin with XCTAssert. For a list of these functions, see Apple’s document Testing With Xcode, in the “Writing Test Classes and Methods” chapter, under “Assertions Listed by Category.” Unlike the corresponding Objective-C macros, the Swift test assert functions do not take format strings (the way NSLog does); each takes a single, simple message string. Test assert functions marked as being “for scalars” are not really for scalars in Swift, because in Swift there are no scalars (as opposed to objects): they apply to any types that adopt Equatable or Comparable.
A test class may also contain utility methods that are called by the test methods. In addition, you can override any of four special methods inherited from XCTestCase:
setUp class method
Called once before all test methods in the class.
setUp instance method
Called before each test method.
tearDown instance method
Called after each test method.
tearDown class method
Called once after all test methods in the class.
The test target is a target, and what it produces is a bundle, with build phases like an app target. This means that resources, such as test data, can be included in the bundle. You might use setUp to load such resources; you can get a reference to the bundle by way of the test class:NSBundle(forClass: self.dynamicType).
The test target is also a module, just as the app target is a module. In order to see into the app target, therefore, the test target must import the app target as a module, and app target members that are to be visible to the test target must be declared public.
As an example of writing and running a test method, let’s use our Empty Window project. Give the ViewController class a (nonsensical) instance method dogMyCats:
func dogMyCats(s:String) -> String {
return ""
}
The method dogMyCats is supposed to receive any string and return the string "dogs". At the moment, though, it doesn’t; it returns an empty string instead. That’s a bug. Now we’ll write a test method to ferret out this bug.
Empty Window comes with a single test class, Empty_WindowTests. Find it in the file Empty_WindowTests.swift. I don’t like the underline, so please rename the class so that it is called simply EmptyWindowTests. Now, delete the existing test method testExample. We’re going to replace it with a test method that calls dogMyCats and makes an assertion about the result. Since dogMyCats is a ViewController instance method, we’re going to need a ViewController instance. But how will EmptyWindowTests know about the ViewController class? It won’t, unless we make preparations:
1. At the top of Empty_WindowTests.swift, where are importing UIKit and XCTest, we must also import the app target:
import Empty_Window
2. Back in ViewController.swift, we must declare ViewController as public. This means that any overrides in ViewController of members inherited from UIViewController must also be declared public. Finally, we must remember to declare dogMyCats as public as well!
3. In Empty_WindowTests.swift, prepare an instance property in the declaration of the EmptyWindowTests class to store our ViewController instance:
var viewController = ViewController()
4. Now, at long last, we can write our test method. Remember that its name must start with test! Call it testDogMyCats. It has access to a ViewController instance as self.viewController:
5. func testDogMyCats() {
6. let input = "cats"
7. let output = "dogs"
8. XCTAssertEqual(output,
9. self.viewController.dogMyCats(input),
10. "Failed to produce \(output) from \(input)")
}
We are now ready to run our test. There are many ways to do this. Switch to the Test navigator, and you’ll see that it lists our test target, our test class, and our test method. Hover the mouse over any name, and a button appears to its right. By clicking the appropriate button, you can thus run all tests in every test class, all tests in the EmptyWindowTests class, or just the testDogMyCats test. But wait, there’s more! Back in Empty_WindowTests.swift, there’s also a diamond-shaped indicator in the gutter to the left of the class declaration and the test method name; you can also click one of those to run, respectively, all tests in this class or an individual test. Or, to run all tests, you can choose Product → Test.
So now let’s run testDogMyCats. The app target is compiled and built; the test target is compiled and built. (If any of those steps fails, we can’t test, and we’ll be back on familiar ground with a compile error or a build error.) The app launches in the Simulator, and the test runs.
The test fails! (Well, we knew that was going to happen, didn’t we?) The app stops running in the Simulator. The error is described in a banner next to the assert that failed in our code, as well as in the Issue navigator and the Log navigator. Moreover, red X marks appear everywhere — in the Test navigator next to testDogMyCats, in the Issue navigator, in the Log navigator, and in Empty_WindowTests.swift next to the class declaration and the first line of testDogMyCats.
Now let’s fix our code. In ViewController.swift, modify dogMyCats to return "dogs" instead of an empty string. Now run the test again. It passes!
When a test failure occurs, you might like to pause at the point where the assertion is about to fail. To do so, in the Breakpoint navigator, click the Plus button at the bottom and choose Add Test Failure Breakpoint. This is like an Exception breakpoint, pausing on the assert line in your test method just before it reports failure. You could then switch to the method being tested, for example, and debug it, examining its variables and so forth, to work out the reason for the impending failure.
There’s a helpful feature allowing you to navigate between a method and a test that calls it: when the selection is within a method, the Related Files menu in the jump bar includes Test Callers. The same is true of the Tracking menu in an assistant pane situation.
In our example, we made a new ViewController instance in order to initialize EmptyWindowTests’s self.viewController. But what if our test required us to get a reference to the existing ViewController instance? This is the same problem of getting a reference to an instance that crops up so often in iOS programming (see Instance References, and Chapter 13). The test code runs inside a bundle that is effectively injected into your running app. This means that it can see app globals such as UIApplication.sharedApplication(). From there, you can work your way to the desired reference:
var viewController = UIApplication.sharedApplication()
.delegate?.window??.rootViewController as ViewController
Organization of your test methods into test targets (suites) and test classes is largely a matter of convenience: it makes a difference to the layout of the Test navigator and which tests will be run together, plus each test class has its own properties, its own setUp method, and so on. To make a new test target or a new test class, click the Plus button at the bottom of the Test navigator.
New in Xcode 6 is asynchronous testing, allowing a test method to be called back after a time-consuming operation. In your test method, you create an XCTestExpectation object by calling expectationWithDescription; then you initiate an operation that takes a completion handler, and call waitForExpectationsWithTimeout:handler:. One of two things will happen:
The operation completes
The completion handler is called. In the completion handler, you perform any asserts having to do with the result of the operation, and then call fulfill on the XCTestExpectation object. This causes the timeout handler to be called.
The operation times out
The timeout handler is called.
Thus, the timeout handler is called either way, allowing you to clean up as necessary.
Also new in Xcode 6 is performance testing, allowing you to test that the speed of an operation has not fallen off. In your test method, you call measureBlock and, in the block, do something (possibly many times, so as to get a reasonable time measurement sample). If the block involves setup and teardown that you don’t want included in the measurement, call measureMetrics:automaticallyStartMeasuring:forBlock: instead, and wrap the heart of the block with calls to startMeasuring and stopMeasuring.
The performance test runs your block several times, recording how long each run takes. The first time you run a performance test, it fails, but you establish a baseline measurement. On subsequent runs, it fails if the standard deviation of the runs is too far from the baseline, or if the average time has grown too much.
Clean
From time to time, during repeated testing and debugging, and before making a different sort of build (switching from Debug to Release, or running on a device instead of the Simulator), it is a good idea to clean your target. This means that existing builds will be removed and caches will be cleared, so that all code will be considered to be in need of compilation and you can build your app from scratch.
Cleaning removes the cruft, quite literally. For example, suppose you have been including a certain resource in your app, and you decide it is no longer needed. You can remove it from the Copy Bundle Resources build phase (or from your project as a whole), but that doesn’t remove it from your built app. This sort of leftover resource can cause all kinds of mysterious trouble. The wrong version of a nib may seem to appear in your interface; code that you’ve edited may seem to behave as it did before the edit. Cleaning removes the built app, and very often solves the problem.
I think of cleaning as having several levels or degrees:
Shallow clean
Choose Product → Clean, which removes the built app and some of the intermediate information in the build folder.
Deeper clean
Hold Option and choose Product → Clean Build Folder, which removes the entire build folder.
Complete clean
Close the project. Open the Organizer window (Window → Organizer) and switch to the Projects tab. Find your project listed at the left side; click it. On the right, click Delete. This removes the project’s entire folder inside your user Library/Developer/Xcode/DerivedData folder.
Insanely clean
Quit Xcode. Open your user Library/Developer/Xcode/DerivedData folder and move all its contents to the trash. This is a complete clean for every project you’ve opened recently — plus the module cache. Removing the module cache can reset Swift itself, thus causing occasional mysterious compilation, code-completion, or syntax coloring issues to go away.
In addition to cleaning your project, you should also remove your app from the Simulator. This is for the same reason as cleaning the project: when the app is built and copied to the Simulator, existing resources inside the built app may not be removed (in order to save time), and this may cause the app to behave oddly. To clean out the Simulator while running the Simulator, choose iOS Simulator → Reset Content and Settings.
Running on a Device
Sooner or later, you’ll want to progress from running and testing and debugging in the Simulator to running and testing and debugging on a real device. The Simulator is nice, but it’s only a simulation; there are many differences between the Simulator and a real device. The Simulator is really your computer, which is fast and has lots of memory, so problems with memory management and speed won’t be exposed until you run on a device. User interaction with the Simulator is limited to what can be done with a mouse: you can click, you can drag, you can hold Option to simulate use of two fingers, but more elaborate gestures can be performed only on an actual device. And many iOS facilities, such as the accelerometer and access to the music library, are not present on the Simulator at all, so that testing an app that uses them is possible only on a device.
WARNING
Don’t even think of developing an app without testing it on a device. You have no idea how your app really looks and behaves until you run it on a device. Submitting to the App Store an app that you have not run on a device is asking for trouble.
Before you can run your app on a device, even just to test, you must join the iOS Developer Program by paying the annual fee. (Yes, this is infuriating. Now get over it.) Only in this way can you obtain and provide to Xcode the credentials for running on a device. You’ll go to the iOS Developer Program web page (http://developer.apple.com/programs/ios). When you’re starting out, the Individual program is sufficient. The Company program costs no more, but adds the ability to privilege additional developers in various roles. You do not need the Company program merely in order to distribute your built app to other users for testing.
Your iOS Developer Program membership involves two things:
An Apple ID
The user ID that identifies you at Apple’s site (along with the corresponding password). You’ll use your Developer Program Apple ID for all kinds of things. In addition to letting you prepare an app to run on a device, this same Apple ID lets you enter Apple’s development forums, download Xcode beta versions, and so forth.
A team name
You, under the same Apple ID, can belong to more than one team. On each team, you will have a role dictating your privileges. If you are the head (or sole member) of the team, your role is Agent, meaning that you can do everything: you can develop apps, run them on your device, submit apps to the App Store, and receive the money for any paid apps that sell any copies there.
Having established your Developer Program Apple ID, you should enter it into the Accounts preference pane in Xcode. Click the Plus button at the bottom left and choose Add Apple ID. Provide the Apple ID and password. From now on, Xcode will identify you through the team name(s) associated with this Apple ID; you shouldn’t need to tell Xcode this password again.
To run an app on a device, you will need to sign the app as you build it. An app that is not properly signed for a device will not run on that device (assuming you haven’t jailbroken the device). Signing an app requires two things:
An identity
An identity represents Apple’s permission for a given team to develop, on a particular computer, apps that can run on a device. It consists of two parts:
A private key
The private key is stored in the keychain on your computer. Thus, it identifies a computer where this team can potentially develop device-targeted apps.
A certificate
A certificate is a virtual permission slip from Apple. It contains the public key matching the private key (because you told Apple the public key when you asked for the certificate). With a copy of this certificate, any machine holding the private key can actually be used to develop device-targeted apps under the name of this team.
A provisioning profile
A provisioning profile is a virtual permission slip from Apple, uniting four things:
§ An identity.
§ An app, identified by its bundle id.
§ A list of eligible devices, identified by their UDIDs (unique device identifiers).
§ A list of entitlements. An entitlement is a special privilege that not every app needs, such as the ability to talk to iCloud. You won’t concern yourself with entitlements unless you write an app that needs one.
Thus, a provisioning profile is sufficient for signing an app as you build it. It says that on this Mac it is permitted to build this app such that it will run on these devices.
There are two types of identity, and hence two types of certificate, and hence two types of provisioning profile: development and distribution (a distribution certificate is also called a production certificate). We are concerned here with the development identity, certificate, and profile; I’ll talk about the distribution side later in this chapter.
Apple is the ultimate keeper of all information: your certificates, your provisioning profiles, what apps and what devices you’ve registered. Your communication with Apple, when you need to verify or obtain a copy of this information, will take place through one of two means:
The Member Center
A set of web pages. You need a Developer Program membership to log in. At the Member Center page (https://developer.apple.com/membercenter) or at the iOS Dev Center page (https://developer.apple.com/devcenter/ios/) click Certificates, Identifiers, & Profiles. You’ll have access to all features and information to which you are entitled by your membership type and role. (This is the area of Apple’s site formerly referred to as the Portal.)
Xcode
Except for obtaining a distribution provisioning profile, just about everything you would need to do at the Member Center can be done through Xcode instead. When all goes well, using Xcode is a lot simpler! If there’s a problem, you can head for the Member Center to iron it out.
Obtaining a Certificate
Setting up an identity and obtaining a certificate is something you only have to do once (or, perhaps, once a year at most; you might have to do it again when your annual Developer Program membership approaches expiration and needs to be renewed). The certificate, you remember, depends upon a private–public key pair. The private key will live in your keychain; the public key will be handed over to Apple, to be built into the certificate. The way you give Apple your public key is through a request for the certificate. Thus, the full manual procedure for obtaining a certificate is as follows:
1. Through the Keychain Access program on your computer, you generate the private–public key pair. Your keychain keeps the private key.
2. You embed the public key in a certificate request, and submit the request to Apple at the Member Center, identifying yourself through your Apple ID and (if necessary) your team, and specifying a development or distribution certificate.
3. Apple provides the certificate itself, which also contains the public key.
4. The certificate is downloaded, and is imported by the keychain, which uses the public key to match it up with the correct private key. Your keychain keeps the certificate.
5. Henceforward, Xcode can see the certificate in the keychain, and thus grants you an identity for development or distribution under the appropriate team name.
In Xcode, however, all of those steps are performed for you automatically when you request a certificate! Here’s what to do:
1. Open Xcode’s Accounts preference pane.
2. If you haven’t entered your developer Apple ID and password, do so now.
3. On the left, select your Apple ID. On the right, select your team. Click View Details.
4. If you had a certificate and it was revoked from the Member Center but is still valid, you may see a dialog offering to request and download the certificate. Click Request. Otherwise, click the Plus button and choose iOS Development (at the lower left under the Signing Identities column).
Everything then happens automatically: the private–public key pair is generated, and the certificate is requested, generated, downloaded, stored in your keychain, and listed under Signing Identities in the View Details dialog.
(Moreover, a universal team development provisioning profile may also be generated, as shown in Figure 9-11. Thus you may now have everything you need to run on a device!)
If that works, then skip the rest of this section. Just in case it doesn’t, I’ll now describe the more elaborate manual procedure for generating the private–public key pair and the certificate request. Instructions are also available at the Member Center as you initiate the process (go to the Certificates page and click the Plus button at the top right).
1. You launch Keychain Access and choose Keychain Access → Certificate Assistant → Request a Certificate from a Certificate Authority. Using your name and email address as identifiers, you generate and save to disk a 2048-bit RSA certificate request file. Your private key is stored in your keychain then and there; the certificate request containing your public key has been saved temporarily onto your computer. (For example, you might save it to the desktop.)
2. At the Member Center, you are presented with an interface allowing you to upload the saved certificate request file. You upload it, and the certificate is generated; click its listing at the Member Center to expose the Download button, and click Download.
3. Locate and double-click the file you just downloaded; Keychain Access automatically imports the certificate and stores it in your keychain.
You do not need to keep the certificate request file or the downloaded certificate file; your keychain now contains all the needed credentials. If this has worked, you can see the certificate in your keychain, read its details, and observe that it is valid and linked to your private key (Figure 9-10). Moreover, you should be able to confirm that Xcode now knows about this certificate: in the Accounts preference pane, click your Apple ID on the left and your team name on the right, and click View Details; a dialog opens where you should see an iOS Development signing identity listed at the top, with a Valid status.
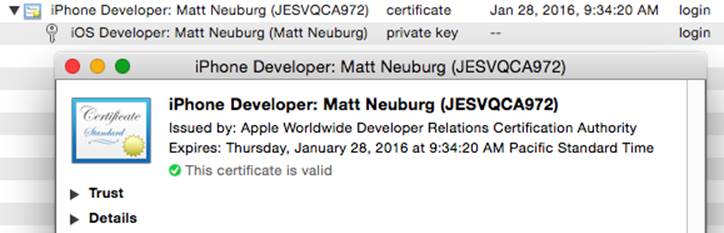
Figure 9-10. A valid development certificate, as shown in Keychain Access
NOTE
If this is your very, very first time obtaining any certificate from the Member Center, you will need another certificate: the WWDR Intermediate Certificate. This is the certificate that certifies that certificates issued by WWDR (the Apple Worldwide Developer Relations Certification Authority) are to be trusted. (You can’t make this stuff up.) Xcode should automatically install this in your keychain; if not, you can obtain a copy of it manually by clicking a link at the bottom of the page at the Member Center where you begin the process of adding a certificate.
Obtaining a Development Provisioning Profile
A provisioning profile, as I’ve already mentioned, unites an identity, a device, and an app bundle id. If things go well, in the simplest case, you’ll be able to obtain a development provisioning profile in a single step from within Xcode. If an app doesn’t require special entitlements or capabilities, a single development profile associated with your team is sufficient for all your apps, so you might only have to do this step once.
You already have a development identity, from the previous section. You may also have a universal development provisioning profile, from the previous section! If not, the simplest solution is to connect your device to your computer with Xcode running and, after passing through any necessary delays (such as telling the device to trust the computer), choose the device as a destination and try to run your project on it. Xcode will register the device at the Member Center for you, and will create and download a universal provisioning profile for this device. To confirm that the device has been added to the Member Center, go there in your browser and click Devices.
To confirm that you have the universal development provisioning profile, click View Details in the Accounts preference pane (for the appropriate team). Certificates and profiles are listed here. The universal development profile, in addition to the title “iOS Team Provisioning Profile,” will have a nonspecific app bundle id associated with it, indicated by an asterisk (Figure 9-11).
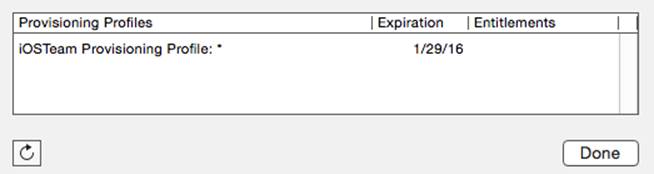
Figure 9-11. A universal development profile
The universal development profile allows you to run any app on the targeted device for testing purposes, provided that the app doesn’t require special entitlements (such as using iCloud).
It is also possible to register a device manually at the Member Center. Under Devices, click the Plus button and enter a name for this device along with its UDID. You can copy the device’s UDID from its listing in Xcode’s Devices window.
If necessary, you can make a provisioning profile for a specific app at the Member Center:
1. Make sure your app is registered at the Member Center under Identifiers → App IDs. If it isn’t, add it. Click Plus. Enter a name for this app. Don’t worry about the nonsense letters and numbers that the Member Center adds as a prefix to your bundle identifier; use the Team ID. Enter the bundle identifier under Explicit App ID exactly as shown in Xcode, in the Bundle Identifier field under General when you edit the app target.
2. Under Provisioning Profiles, click Plus. Ask for an iOS App Development profile. On the next screen, choose the App ID. On the next screen, check your development certificate. On the next screen, select the device(s) you want to run on. On the next screen, give this profile a name, and click Generate. Click the Download button.
3. Find the downloaded profile, and double-click it to open it in Xcode. You can then throw the downloaded profile away; Xcode has made a copy.
Running the App
Once you have a development profile applicable to an app and a device (or, in the case of the universal team profile, all apps and all registered devices), connect the device, choose it as the destination in the Scheme pop-up menu, and build and run the app. If you’re asked for permission to access your keychain, grant it. If necessary, Xcode will install the associated provisioning profile onto the device.
The app is built, loaded onto your device, and runs there. As long as you launch the app from Xcode, everything is just as when running in the Simulator: you can run, or you can debug, and the running app is in communication with Xcode, so that you can stop at breakpoints, read messages in the console, and so on. The outward difference is that to interact physically with the app, you use the device (tethered physically to your computer), not the Simulator.
Running the app from Xcode on the device can also be used simply as a way of copying the current version of the app to the device. You can then stop the app (in Xcode), disconnect the device from your computer, and launch the app on the device and play with it. This is a good way of testing. You are not debugging, so you can’t get any feedback in Xcode, but messages are written to the console internally and can be retrieved later.
Profile and Device Management
The central location for surveying identities and provisioning profiles is Xcode’s Accounts preference pane. Select an Apple ID and a team and choose View Details.
An important feature of the Accounts preference pane is the ability to export account information. You’ll need this if you want to be able to develop on a different computer. Select an Apple ID and use the Gear menu at the bottom of the pane to choose Export Accounts. You’ll be asked for a file name and a place to save, along with a password; this password is associated solely with this file, and is needed only to open the file later on another computer. On the other computer, to which you have copied the exported file, run Xcode and double-click the exported file; Xcode asks for its password. When you provide it, like magic the entire suite of teams and identities and certificates and provisioning profiles springs to life in that other copy of Xcode, including the entries in your keychain.
Alternatively, you might need to export just an identity, without any provisioning profiles. You can do that with the gear menu in the Accounts preference pane’s View Details dialog.
If the provisioning profiles listed in the Accounts preference pane’s View Details dialog get out of sync with the Member Center, click the Refresh button at the bottom left. If that doesn’t help, quit Xcode and, in the Finder, open your user Library/MobileDevice/Provisioning Profiles folder, and delete everything that’s in there. Relaunch Xcode. In Accounts, your provisioning profiles are gone! Now click the refresh button. Xcode will download fresh copies of all your provisioning profiles, and you’ll be back in sync with the Member Center.
When a device is attached to the computer, it appears in Xcode’s Devices window. Click its name to access information on the device. You can see (and copy) the device’s UDID. You can see (and delete) apps that have been installed for development using Xcode. You can view the device’s console log in real time. (The interface for this is a little obscure in Xcode 6: click the tiny up-arrow at the bottom left of the main pane of the Devices window.) Using the Gear menu (or the contextual menu), you can see provisioning profiles that have been installed on the device. You can see log reports for crashes that took place on the device. And you can take screenshots that image your device’s screen; you’ll need to do this for your app when you submit it to the App Store.
Profiling
Xcode provides tools for probing the internal behavior of your app graphically and numerically, and you should keep an eye on those tools. The gauges in the Debug navigator allow you to monitor key indicators, such as CPU and memory usage, any time you run your app. And Instruments, a sophisticated and powerful utility application, collects profiling data that can help track down problems and provide the numeric information you need to improve your app’s performance and responsiveness. You’ll probably want to spend some time with Instruments as your app approaches completion (optimizing prematurely is notoriously a waste of time and effort).
Gauges
The gauges in the Debug navigator are operating whenever you build and run your app. Click on a gauge to see further detail displayed in the editor. The gauges do not provide highly detailed information, but they are extremely lightweight and always active, so they provide an easy way to get a general sense of your running app’s behavior at any time. In particular, if there’s a problem, such as a prolonged period of unexpectedly high CPU usage or a relentless unchecked increase in memory usage, you can spot it in the gauges and then use Instruments to help track it down.
In Figure 9-12, I’ve been heavily exercising my app for a few moments, repeatedly performing the most memory-intensive actions I expect the user to perform. These actions do cause some spikes in memory usage, but my app’s memory usage then always settles back down and levels off, so I don’t suspect any memory issues.
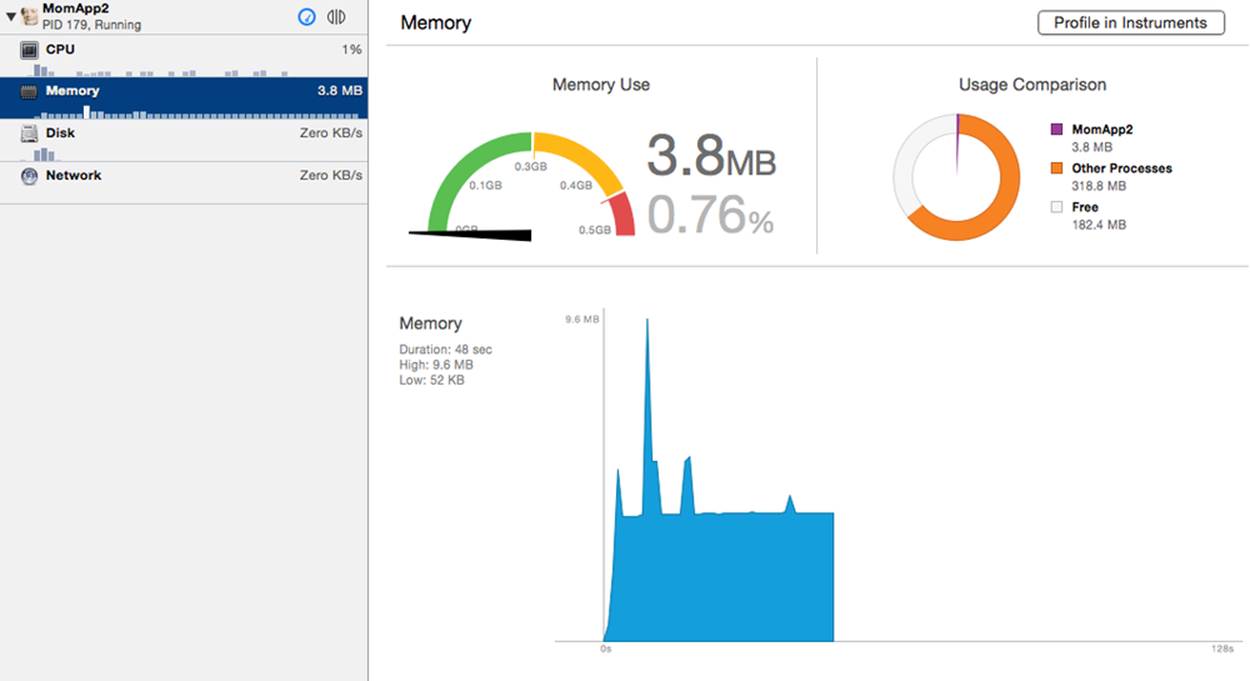
Figure 9-12. The Debug navigation gauges
WARNING
Note that Figure 9-12 is the result of running on a device. Running in the Simulator gives completely different — and therefore misleading — results.
Instruments
You can use Instruments on the Simulator or the device. The device is where you’ll do your ultimate testing, for maximum verisimilitude.
To get started with Instruments, set the desired destination in the Scheme pop-up menu in the project window toolbar, and choose Product → Profile. Your app builds using the Profile action for your scheme; by default, this uses the Release build configuration, which is probably what you want. If you’re running on a device, you may see some validation warnings, but you can safely ignore them. Instruments launches; if your scheme’s Instrument pop-up menu for the Profile action is set to Ask on Launch (the default), Instruments presents a dialog where you choose a trace template.
Alternatively, click Profile In Instruments in a Debug navigator gauge editor; this is convenient when the gauges have suggested a possible problem, and you want to reproduce that problem under the more detailed monitoring of Instruments. Instruments launches, selecting the appropriate trace template for you. A dialog offers two options: Restart stops your app and relaunches it with Instruments, whereas Transfer keeps your app running and hooks Instruments into it.
When the Instruments main window appears, it can be further customized to profile the kind of data that particularly interests you, and you can save the structure of the Instruments window as a custom template. You may have to click the Record button, or choose File → Record Trace, to get your app running. Now you should interact with your app like a user; Instruments will record its statistics.
Use of Instruments is an advanced topic, which is largely beyond the scope of this book. Indeed, an entire book could (and really should) be written about Instruments alone. For proper information, you should read Apple’s documents, especially the Instruments User Reference andInstruments User Guide. Also, many WWDC videos from current and prior years are about Instruments; look particularly for sessions with “Instruments” or “Performance” in their names. Here, I’ll just demonstrate, without much explanation, the sort of thing Instruments can do.
Figure 9-13 shows me doing much the same thing in Instruments that I did with the Debug navigator gauges in Figure 9-12. I’ve set the destination to my device. I choose Product → Profile; when Instruments launches, I choose the Allocations trace template. With my app running under Instruments, I exercise it for a while and then pause Instruments, which meanwhile has charted my memory usage. Examining the chart, I find that there are spikes up to about 10MB, but the app in general settles down to a much lower level (less than 4MB). Those are very gentle and steady memory usage figures, so I’m happy.
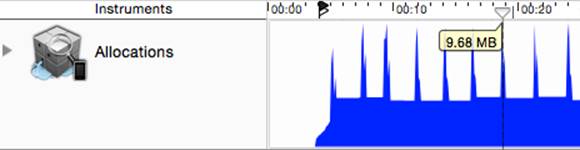
Figure 9-13. Instruments graphs memory usage over time
Another field of Instruments expertise is the ability to detect memory leaks. In Figure 9-14, I’ve run the retain cycle code from Chapter 5: I have a Dog class instance and a Cat class instance with persisting references to one another. There are no other references to either instance, so they are both leaking. I’ve profiled the app using the Leaks trace template. Instruments has detected the leak, and has even drawn me a diagram showing me the structure of my mistake!
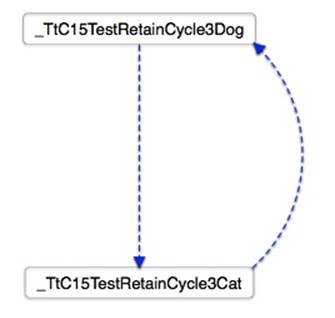
Figure 9-14. Instruments describes a retain cycle
In this final example, I’m concerned with what’s taking my Albumen app so long to switch from master view to detail view. I’ve set the destination to a device, because that’s where speed matters and needs to be measured. I choose Product → Profile. Instruments launches, and I choose the Time Profiler trace template. When the app launches under Instruments on the device, the master view appears; I tap a cell in the table view, and after a significant delay, the detail view appears. I navigate back and repeat the procedure several times.
In Figure 9-15, I’ve paused Instruments, and am looking at what it’s telling me. Opening the triangles in the lower portion of the window, it turns out that much of the time is spent in routines that don’t belong to me; this is Cocoa, laying out the table view. However, by drilling down far enough, I eventually arrive at my own code, indicated by the appearance of my app’s name, Albumen, as a module name.
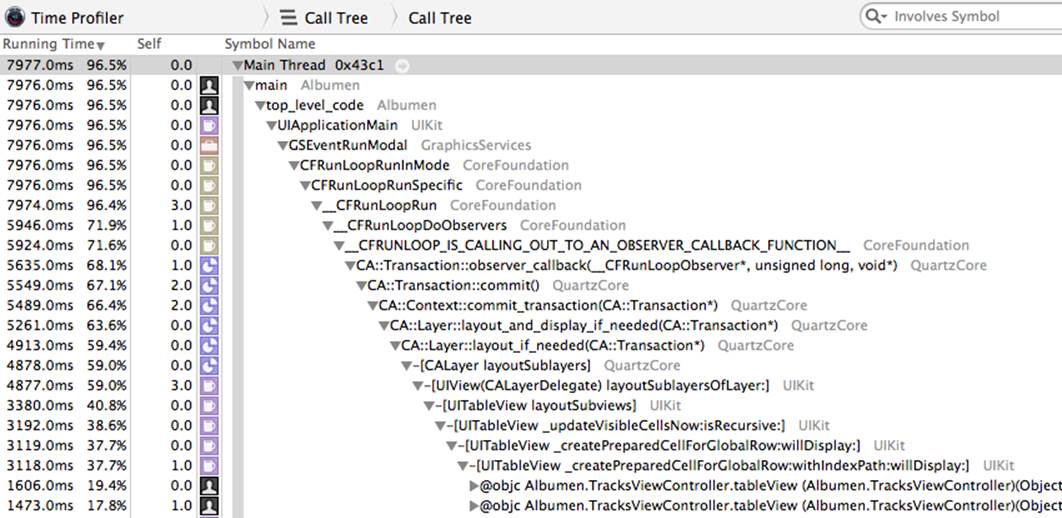
Figure 9-15. Drilling down into the time profile
Here’s the amazing part: by double-clicking the listing of that line, I can see my own code, time-profiled (Figure 9-16)! The profiler is drawing my attention to the call to drawAtPoint:blendMode:alpha:. Compositing with a blend mode takes time, and I’m doing it for every row of the table. It may be that I can shave off some time here by drawing in another way, and I’ll probably spend a little time tweaking that line and trying the Time Profiler again. This is just the sort of focused quantified analysis that Instruments is good at.
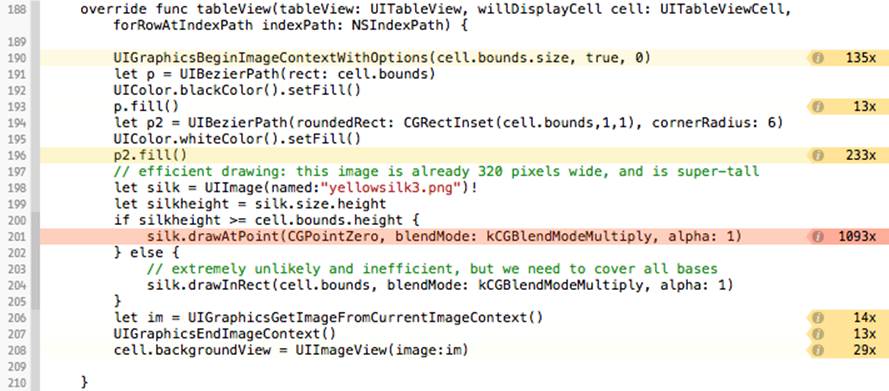
Figure 9-16. My code, time-profiled
Localization
A device can be set by the user to prefer a certain language as its primary language. You might like the text in your app’s interface to respond to this situation by appearing in that language. This is achieved by localizing the app for that language. You will probably want to implement localization relatively late in the lifetime of the app, after the app has achieved its final form, in preparation for distribution.
Localization operates through localization folders in your project folder and in the built app bundle. Let’s say that a resource in one of these localization folders has a counterpart in the other localization folders. Then, when your app goes to load such a resource, it automatically loads the one appropriate to the user’s preferred language.
Any type of resource can live in these localization folders; for example, you can have one version of an image to be loaded for one language, and another version of that image for another language. You will be most concerned, however, with text that is to appear in your interface. Such text must be maintained in specially formatted .strings files, with special names. For example:
§ To localize your Info.plist file, use InfoPlist.strings.
§ To localize your Main.storyboard, use Main.strings.
§ To localize your code strings, use Localizable.strings.
New in Xcode 6, you don’t have to create or maintain these files manually. Instead, you can work with exported XML files in the standard .xliff format. Xcode will generate these files automatically, based on the structure and content of your project; it will also read these files and will turn them automatically into the various localized .strings files.
To help you understand how the .xliff export and import process works, I’ll start by explaining what you would have to do in order to create and maintain your .strings files manually. Then I’ll describe how to do the same thing using .xliff files.
Localizing the Info.plist
I’ll begin by localizing the string that appears in the Springboard under the app’s icon — the visible title of the app. This string is the value of the CFBundleDisplayName key in our Info.plist file. Our Info.plist file doesn’t have a CFBundleDisplayName key, so the first step is to make one:
1. Edit the Info.plist file.
2. Select “Bundle name” and click the Plus button that appears to its right.
3. A new entry appears. From the pop-up menu, choose “Bundle display name.”
4. For the value, enter “Empty Window” and save.
Now we’re going to localize that string: we’re going to make a different string appear in the Springboard when the device’s language is French. How is the Info.plist file localized? It depends on another file, which by default is not created by the app template — InfoPlist.strings. So we need to create that file:
1. Choose File → New → File.
2. Select iOS → Resource → Strings File. Click Next.
3. Make sure this file is part of our app target, and name it InfoPlist. Get the name and capitalization exactly right! Click Create.
4. A file called InfoPlist.strings has appeared in the project navigator. Select it and, in the File inspector, click Localize.
5. A dialog appears offering us a choice of initial languages. The default is Base, which is fine. Click Localize.
We are now ready to add a language! Here’s how to do it:
1. Edit the project. Under Info, the Localizations table lists our app’s localizations. We are initially localized only for the development language (English in my case).
2. Click the Plus button under the Localizations table. From the pop-up menu that appears, choose French.
3. A dialog appears, listing files that are currently localized for English (because they came that way as part of the app template). We’re dealing here with just InfoPlist.strings, so leave it checked but uncheck any other files that appear here. Click Finish.
We have now set up InfoPlist.strings to be localized for both English and French. In the Project navigator, the listing for InfoPlist.strings has acquired a flippy triangle. Open the triangle to reveal that our project now contains two copies of InfoPlist.strings, one for Base (namely English) and one for French. Thus we can now edit either one individually.
Now let’s edit our InfoPlist.strings files. A .strings file is a collection of key–value pairs in the following format:
/* Optional comments are C-style comments */
"key" = "value";
In the case of InfoPlist.strings, the key is the key name from Info.plist — the raw key name, not the English-like name. So the English InfoPlist.strings should look like this:
"CFBundleDisplayName" = "Empty Window";
The French InfoPlist.strings should look like this:
"CFBundleDisplayName" = "Fenêtre Vide";
That’s all there is to it! Now let’s try it out:
1. Build and run Empty Window in the Simulator.
2. In Xcode, stop the running project. In the Simulator, the home screen is revealed.
3. Examine the name of our app, as displayed in the Simulator home screen. It is Empty Window (perhaps truncated).
4. In the Simulator, launch the Settings app and change the language to French (General → Language & Region → iPhone Language → Français). Click Done. An action sheet asks to confirm that we want to Change to French. Do so.
5. After a pause, the Springboard appears. Look at our app. Its name is now displayed as Fenêtre Vide!
Is this fun or what? When you’re done marveling at your own cosmopolitanism, change the Simulator’s language back to English.
Localizing a Nib File
Now let’s talk about how nib files are localized. Once upon a time, it was necessary to localize a copy of the entire nib. So, for example, if you wanted a French version of a nib file, you were constantly maintaining two separate nib files. If you created a button in one nib file, you had to create the same button in the other — except that in one, the title was in English, while in the other, the title was in French. And so on, for every interface object and every localization language. It doesn’t sound like fun, does it?
Nowadays, happily, there’s a better way. If a project uses base internationalization, then a correspondence can be created between a nib file in a Base.lproj folder and a .strings file in a localization folder. Thus the developer has just one copy of the nib file to maintain. If the app runs on a device that’s localized for a language for which a .strings file exists, the strings in the .strings file are substituted for the strings in the nib file.
By default, our Empty Window project does use base internationalization, and its Main.storyboard file is in a Base.lproj folder. So we’re ready to localize the storyboard file for French. You’re going to need something in the storyboard file to localize:
1. Edit Main.storyboard and make sure that the initial main view contains a button whose title is "Hello". If there isn’t one, add one. Make the button about 100 pixels wide, and save (that’s important).
2. Still editing Main.storyboard, look at the File inspector. Under Localization, Base should be checked already. In addition, check French.
3. In the Project navigator, examine the listing for Main.storyboard. It now has a flippy triangle. Flip it open. Sure enough, there is now a base-localized Main.storyboard and a French-localized Main.strings.
4. Edit the French Main.strings. It has been created automatically, with keys corresponding to every interface item in Main.storyboard that has a title. You have to deduce, from comments and the key names, how this correspondence works. In our case, there’s just one interface item inMain.storyboard, and anyway it’s pretty easy to guess what interface item the key represents. It looks something like this:
5. /* Class = "UIButton"; normalTitle = "Hello"; ObjectID = "PYn-zN-WlH"; */
"PYn-zN-WlH.normalTitle" = "Hello";
6. In the second line, containing the key–value pair, change the value to "Bonjour". Don’t change the key! It has been generated automatically, and correctly, so as to specify the correspondence between this value and the title of the button.
Run the project and view the interface on an English device and on a French device, as we did before. Sure enough, the button’s title appears as "Bonjour" on a French device!
What happens if we now modify the nib? Suppose, for example, we add another button to the view in Main.storyboard. There’s no automatic change to any .strings files corresponding to nibs; such files must instead be regenerated manually. (That’s why, in real life, it’s a good idea not to start localizing your nib files until your interface is pretty much finished.) But all is not lost:
1. Select Main.storyboard and choose File → Show in Finder.
2. Run Terminal. Type ibtool --export-strings-file output.strings followed by a space, and drag Main.storyboard from the Finder into the Terminal window. Press Return.
The result is that a new file called output.strings based on Main.storyboard is generated in your home directory (or whatever the current directory is). Merging this information with the existing localized .strings files based on Main.storyboard is up to you.
TIP
In that example, I made you widen the "Hello" button in advance, to make room for a longer localized title, "Bonjour". In real life, you’ll probably use autolayout; this allows buttons and labels to grow and shrink automatically, while shifting other parts of the interface to compensate. New in Xcode 6, to test your interface under different localizations, you can preview your localized nib files within Xcode, without running the app. Edit a .storyboard or .xib file and open an assistant pane, and switch the Tracking menu to Preview. A menu at the lower right lists localizations; choose from the menu to switch between them. A “double-length pseudo-language” stress-tests your interface with really long localized replacement text.
Localizing Code Strings
What about localizing strings whose value is generated in code? In the Empty Window app, an example would be the alert summoned by tapping the button. It displays text — the title and message of the alert, and the title of the button that dismisses it:
@IBAction func buttonPressed(sender:AnyObject) {
let alert = UIAlertController(
title: "Howdy!", message: "You tapped me!", preferredStyle: .Alert)
alert.addAction(
UIAlertAction(title: "OK", style: .Cancel, handler: nil))
self.presentViewController(alert, animated: true, completion: nil)
}
How is that text to be localized? The approach is the same — a .strings file — but your code must be modified to use it explicitly. Your code calls the global NSLocalizedString function; the first parameter is a key into a .strings file, and the comment parameter provides an explanatory comment, such as the original text to be translated. NSLocalizedString takes several additional, optional parameters; if you omit them, the default is to use a file called Localizable.strings.
So, for example, we might modify our buttonPressed: method to look like this:
@IBAction func buttonPressed(sender:AnyObject) {
let alert = UIAlertController(
title: NSLocalizedString("ATitle", comment:"Howdy!"),
message: NSLocalizedString("AMessage", comment:"You tapped me!"),
preferredStyle: .Alert)
alert.addAction(
UIAlertAction(title: NSLocalizedString("Accept", comment:"OK"),
style: .Cancel, handler: nil))
self.presentViewController(alert, animated: true, completion: nil)
}
Our code is now broken, of course, because there is no Localizable.strings file. Let’s make one. The procedure is just as before:
1. Choose File → New → File.
2. Select iOS → Resource → Strings File. Click Next.
3. Make sure this file is part of our app target, and name it Localizable. Get the name and capitalization exactly right! Click Create.
4. A file called Localizable.strings has appeared in the project navigator. Select it and, in the File inspector, click Localize.
5. A dialog appears offering us a choice of initial languages. The default is Base, which is fine. Click Localize.
6. In the File inspector, check French.
The Localizable.strings file now exists in two localizations, Base (meaning English) and French. We must now provide these files with content. Just as we did with ibtool earlier, we can generate the initial content automatically using the genstrings tool. For example, on my machine I would now, in the Terminal, type genstrings followed by space. Then I drag ViewController.swift from the Finder into the Terminal window, and press Return. The result is a file Localizable.strings in the current directory, reading as follows:
/* OK */
"Accept" = "Accept";
/* You tapped me! */
"AMessage" = "AMessage";
/* Howdy! */
"ATitle" = "ATitle";
Now you copy and paste that content into the English and French versions of our project’s Localizable.strings files, and go through those pairs, changing the value in each pair so that it reads correctly for the given localization. For example, in the English Localizable.strings file:
/* Howdy! */
"ATitle" = "Howdy!";
And in the French Localizable.strings file:
/* Howdy! */
"ATitle" = "Bonjour!";
And so forth.
Localizing With XML Files
New in Xcode 6, there’s another way do everything we just did. The surface mechanics of text localization can be made to revolve around the exporting and importing of .xliff files. This means that you typically won’t actually have to press any Localize buttons or edit any .strings files! Instead, you edit the target and choose Editor → Export For Localization; when you save, a folder is created containing .xliff files for your various localizations. You then edit these files (or get a translation house to edit them for you) and import the edited files: edit the target and choose Editor → Import Localizations. Xcode reads the edited .xliff files and does the rest, automatically creating localizations and modifying .strings files as needed.
To demonstrate, let’s add another language — namely, Spanish — to our localizations:
1. Edit the target and choose Editor → Export For Localization.
2. We are offered a chance to export strings in our existing localizations as well as our base language. If we were planning to edit our French localization further, we would export it, but I’m not going to do that in this example. Instead, switch the Include pop-up menu to Development Language Only.
3. Specify a good place to save (such as the Desktop). You’re creating a folder, so don’t use the name of an existing folder in the same place. For example, if you’re saving to the same folder that contains the project folder, you might call it Empty Window Localizations. Click Save.
4. In the Finder, open the folder you just created. It contains an .xliff file in your project’s base language. For example, my file is called en.xliff because my development language is English.
Examine this .xliff file, and you will see that Xcode has done for us everything that we did manually. No .strings files need be present initially! Xcode does all the work:
§ For every Info.plist file in your project, Xcode has created a corresponding <file> element. When imported, these elements will be turned into localized InfoPlist.strings files.
§ For every .storyboard and .xib file, Xcode has run ibtool to extract the text, and has created a corresponding <file> element. When imported, these elements will be turned into eponymous localized .strings files.
§ For every code file containing a call to NSLocalizedString, Xcode has run genstrings, and has created a corresponding <file> element. When imported, these elements will be turned into localized Localizable.strings files.
We now proceed to translate some or all of the strings in this file into some other language, save the edited .xliff file, and import it:
1. Open the .xliff file in a decent text editor (or an XML editor if you have one).
2. Just for the sake of this example, I’m going to localize only the "Hello" button in the storyboard. So delete (carefully, so as not to mess up the XML) all the <file>...</file> element groups except the one whose original attribute is "Empty Window/Base.lproj/Main.storyboard". And delete (carefully) all the <trans-unit>...</trans-unit> elements except the one whose <source> is "Hello".
3. To specify Spanish as the target language, add an attribute to the <file> element: target-language="es".
4. To provide an actual translation, add a <target> element after the <source> element, and give it some text, such as "Hola". Save. The file should now look something like this:
5. <?xml version="1.0" encoding="UTF-8" standalone="no"?>
6. <xliff xmlns="urn:oasis:names:tc:xliff:document:1.2"
7. xmlns:xsi="http://www.w3.org/2001/XMLSchema-instance" version="1.2"
8. xsi:schemaLocation="urn:oasis:names:tc:xliff:document:1.2
9. http://docs.oasis-open.org/xliff/v1.2/os/xliff-core-1.2-strict.xsd">
10. <file original="Empty Window/Base.lproj/Main.storyboard"
11. source-language="en" target-language="es" datatype="plaintext">
12. <header>
13. <tool tool-id="com.apple.dt.xcode" tool-name="Xcode"
14. tool-version="6.2" build-num="6C107a"/>
15. </header>
16. <body>
17. <trans-unit id="PYn-zN-WlH.normalTitle">
18. <source>Hello</source>
19. <target>Hola</target>
20. <note>Class = "UIButton"; normalTitle = "Hello";
21. ObjectID = "PYn-zN-WlH";</note>
22. </trans-unit>
23. </body>
24. </file>
</xliff>
25.Back in Xcode, edit the target and choose Editor → Import Localizations. In the Open dialog, select the edited en.xliff and click Open.
26.Xcode complains that we didn’t translate everything there was to translate. Ignore that complaint and click Import.
Amazing things have now happened! With no visible prompting, Xcode has added Spanish to our localizations, and has created an additional InfoPlist.strings file, an additional Main.strings file, and an additional Localizable.strings file, all localized to Spanish. If you examine Main.strings, you’ll see that it looks just as it would have looked if we had edited it manually:
/* Class = "UIButton"; normalTitle = "Hello"; ObjectID = "PYn-zN-WlH"; */
"PYn-zN-WlH.normalTitle" = "Hola";
Clearly, the round-trip to and from an .xliff file is an extremely convenient way to create and maintain your localizations. The structure of the localization within your project is exactly the same as I described earlier in this section, but the .xliff file externalizes that same information in a format that can be readily edited in a single file. The .xliff export process runs ibtool and genstrings for you, so your localized content is easy to maintain as you add interface and code.
Archiving and Distribution
By distribution is meant providing to others who are not developers on your team your built app for running on their devices. There are two kinds of distribution:
Ad Hoc distribution
You are providing a copy of your app to a limited set of known users so that they can try it on their specific devices and report bugs, make suggestions, and so forth.
App Store distribution
You are providing the app to the App Store so that anyone can download it (possibly for a fee) and run it.
To create a copy of your app for distribution, you need first to build an archive of your app. It is this archive that will subsequently be exported for Ad Hoc or App Store distribution. An archive is basically a preserved build. It has three main purposes:
Distribution
An archive will serve as the basis for an Ad Hoc distribution or an App Store distribution.
Reproduction
Every time you build, conditions can vary, so the resulting app might behave slightly differently. But an archive preserves a specific built binary; every distribution from a particular archive is guaranteed to contain an identical binary, and thus will behave the same way. This fact is important for testing: if a bug report comes in based on an app distributed from a particular archive, you can Ad Hoc distribute that archive to yourself and run it, knowing that you are testing exactly the same app.
Symbolication
The archive includes a .dSYM file which allows Xcode to accept a crash log and report the crash’s location in your code. This allows you to deal with crash reports from users.
Here’s how to build an archive of your app:
1. Set the destination in the Scheme pop-up menu in the project window toolbar to iOS Device. Until you do this, the Product → Archive menu item will be disabled. You do not have to have a device connected; you are not building to run on a particular device, but saving an archive that will run on some device.
2. If you like, edit the scheme to confirm that the Release build configuration will be used for the Archive action. This is the default, but it does no harm to double-check.
3. Choose Product → Archive. The app is compiled and built. The archive itself is stored in a date folder within your user Library/Developer/Xcode/Archives folder. Also, it is listed in Xcode’s Organizer window (Window → Organizer) under Archives; this window may open spontaneously to show the archive you’ve just created. You can add a comment here; you can also change the archive’s name (this won’t affect the name of the app).
To perform any kind of distribution based on your archive, you will also need a distribution identity (a private key and a distribution certificate in your computer’s keychain) and a distribution profile especially for this app. If you’re doing an Ad Hoc distribution and an App Store distribution, you’ll need a separate distribution profile for each.
You can obtain a distribution identity from within Xcode in exactly the same way as I described obtaining a development identity: in the Accounts preference pane, in the View Details dialog for your team, click the Plus button and choose iOS Distribution. If that doesn’t work, obtain the distribution certificate manually, just as I described for a development certificate.
In theory, Xcode can also create an appropriate distribution profile for you when you export your archive. However, I have never found this to work reliably; I always create my distribution profiles manually, at the Member Center, in a web browser. Here’s how to do that:
1. If this is to be an Ad Hoc distribution profile, collect the UDIDs of all the devices where this build is to run, and add each of them at the Member Center under Devices. (For an App Store distribution profile, omit this step.)
2. Make sure that the app is registered at the Member Center, as I described earlier in this chapter.
3. At the Member Center, under Provisioning Profiles, click the Plus button to ask for a new profile. In the Add iOS Provisioning Profile form, specify an Ad Hoc profile or an App Store profile. On the next screen, choose your app from the pop-up menu. On the next screen, choose your distribution certificate. On the next screen, for an Ad Hoc profile only, specify the devices you want this app to run on. On the next screen, give the profile a name.
Be careful about the profile’s name, as you will need to be able to recognize it later from within Xcode! My own practice is to assign a name containing the term “AdHoc” or “AppStore” and the name of the app.
4. Click Generate to generate the profile. To obtain the profile, either click Download and then find the downloaded profile and double-click it to get Xcode to see it, or else open the View Details dialog in Xcode’s Accounts preference pane and click the Refresh button at the bottom left to make Xcode download it.
Ad Hoc Distribution
Apple’s docs say that an Ad Hoc distribution build should include an icon that will appear in iTunes, but my experience is that this step, though it does work, is unnecessary. If you want to include this icon, it should be a PNG or JPEG file, 512×512 pixels in size, and its name should beiTunesArtwork, with no file extension. Make sure the icon is included in the build, being present in the Copy Bundle Resources build phase.
Here are the steps for creating an Ad Hoc distribution file:
1. If necessary, create an archive of your app, as described in the previous section. If necessary, create, download, and install an Ad Hoc distribution profile for this app.
2. In the Organizer window, under Archives, select the archive and click the Export button at the upper right of the window. A dialog appears. Here, you are to specify a method; choose Save for Ad Hoc Deployment. Click Next.
3. You are now asked to select a Development Team. Select the correct team and click Choose.
4. The archive is prepared, and a summary window is displayed. The name of the provisioning profile is shown, so you can tell that the right thing is happening (Figure 9-17). For a Swift app, the embedded Swift dynamic libraries are also listed. Click Export.
5. A Save dialog appears. Give the file a useful name; this won’t affect the name of the app. Save the file to disk in a good place, such as the Desktop. It will have the suffix .ipa (“iPhone app”).
6. Locate in the Finder the file you just saved. Provide this file to your users with instructions.
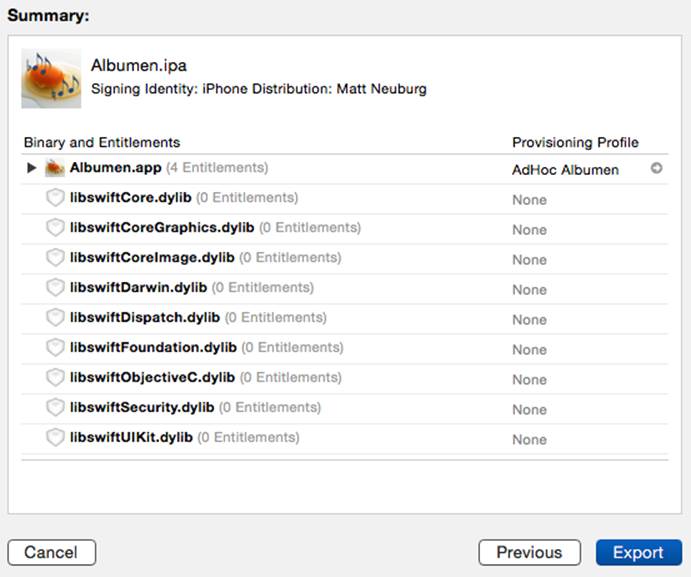
Figure 9-17. Exporting an Ad Hoc build
A user should copy the .ipa file to a safe location, such as the Desktop, and then launch iTunes and drag the .ipa file from the Finder onto the iTunes icon in the Dock (or double-click the .ipa file). Then the user should connect the device to the computer, make certain the app is present in the list of apps for this device and that it will be installed on the next sync, and finally sync the device to cause the app to be copied to it. (If this isn’t the first version of your app that you’ve distributed to your Ad Hoc testers, the user might need to delete the current version from the device beforehand; otherwise, the new version might not be copied to the device when syncing.)
If you listed your own device as one of the devices for which this Ad Hoc distribution profile was to be enabled, you can obey these instructions yourself to make sure the Ad Hoc distribution is working as expected. First, remove from your device any previous copies of this app (such as development copies) and any profiles that might be associated with this app (you can do that through the Devices window in Xcode). Then copy the app onto your device by syncing with iTunes as just described. The app should run on your device, and you should see the Ad Hoc distribution profile on your device. Because you are not privileged over your other Ad Hoc testers, what works for you should work for them.
There is a registration limit of 100 devices per year per developer (not per app), which limits your number of Ad Hoc testers. Devices used for development are counted against this limit. You can work around this limit, and provide your betas more conveniently to testers, by using TestFlight beta testing instead.
TestFlight beta testing is new in iOS 8. It lifts the limit of 100 devices to a limit of 1000 testers, and is more convenient than Ad Hoc distribution because your users download and install prelease versions of your app directly from the App Store onto their devices through the TestFlight app (acquired by Apple in 2014 by buying Burstly, http://www.testflightapp.com). Configuration is performed at the iTunes Connect site; a prerelease version uploaded to iTunes Connect must be archived as if for App Store distribution (see the discussion of App Store submission later in this chapter). Prerelease versions of your app intended for distribution to beta testers (as opposed to internal testers who have direct access to your iTunes Connect account) require review by Apple. See the “TestFlight Beta Testing” chapter of Apple’s iTunes Connect Developer Guide.
Final App Preparations
As the big day approaches when you’re thinking of submitting your app to the App Store, don’t let the prospect of huge fame and massive profits hasten you past the all-important final stages of app preparation. Apple has a lot of requirements, and failure to meet them can cause your app to be rejected. Take your time. Make a checklist and go through it carefully. See Apple’s App Distribution Guide as well as the “Icon and Image Design” chapter of the Human Interface Guidelines for full details.
Icons in the App
The simplest way to provide your app with icons is to use the Asset Catalog. If you’re not using an asset catalog for icons and you’d like to switch to using one, edit the target and, in the General pane, under App Icons and Launch Images, next to App Icons Source, click the Use Asset Catalog button. The Use Asset Catalog button then changes to a pop-up menu listing the asset catalog’s name and the name of the image set within the catalog to be used for icons.
The image sizes needed are listed in the asset catalog itself. Select an image slot and look in the Attributes inspector, under Expected Size. Confusingly, “2x” or “3x” means that the image should be double or triple the listed dimensions for an icon; thus, for example, an iPhone app icon listed as “60pt” but “3x” means that you should provide an image measuring 180×180. To determine which slots should be displayed, use the checkboxes in the Attributes inspector when you select an icon set or launch image set (Figure 9-18). To add an image, drag it from the Finder into the appropriate slot.
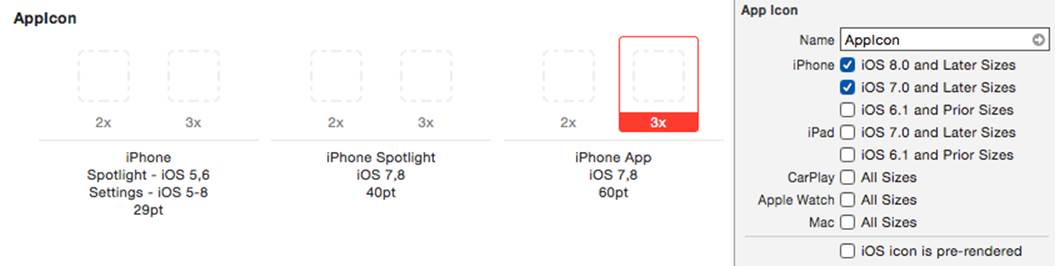
Figure 9-18. Icon slots in the asset catalog
An icon file must be a PNG file, without alpha transparency. It should be a full square; the rounding of the corners will be added for you. Apple seems nowadays to prefer simple, cartoony images with a few bright colors and possibly a gentle gradient background.
When your app is built and the app catalog is processed, the icons are written out to the top level of the app bundle and are given appropriate names; at the same time, an appropriate entry is written into the app’s Info.plist, enabling the system to find and display the icon on a device. The details are complicated, but you won’t have to worry about them — which is exactly why you’re using the asset catalog!
App icon sizes have changed over the years. If your app is to be backward-compatible to systems earlier than iOS 8, you will need additional icons in additional sizes, corresponding to the expectations of those earlier systems. Again, this is exactly the sort of thing the asset catalog will help you with.
Optionally, you may elect to include smaller versions of your icon to appear when the user does a search on the device, as well as in the Settings app if you include a settings bundle. (That’s what the first two slots are for in Figure 9-18.) However, I never include those icons.
Other Icons
When you submit an app to the App Store, you will be asked to supply a 1024×1024 PNG or high-quality JPEG icon to be displayed at the App Store. Apple’s guidelines say that it should not merely be a scaled-up version of your app’s icon; but it must not differ perceptibly from your app’s icon, either, or your app will be rejected (I know this from bitter experience).
The App Store icon does not need to be built into your app; indeed, it should not be, as it will merely swell the built app’s size unnecessarily. On the other hand, you will probably want to keep it in your project (and in your project folder) so that you can find and maintain it easily. So I recommend that you import it into your project and copy it into your project folder, but do not add it to any target.
If you created an iTunesArtwork icon for Ad Hoc distribution, you may wish to delete it from the Copy Bundle Resources build phase now.
Launch Images
There is a delay between the moment when the user taps your app’s icon to launch it and the moment when your app is up and running and displaying its initial window. To cover this delay and give the user a visible indication that something is happening, a launch image needs to be displayed during that interval.
The launch image needn’t be detailed. It might be just a blank depiction of the main elements or regions of the interface that will be present when the app has finished launching. In this way, when the app does finish launching, the transition from the launch image to the real app will be a matter of those elements or regions being filled in.
In iOS 7 and before, the launch image was literally an image (a PNG file). It had to be included in your app bundle, and it had to obey certain naming conventions. As the variety of screen sizes and resolutions of iOS devices proliferated, so did the number of required launch images. The asset catalog, introduced in iOS 7, was helpful in this regard. But in iOS 8, which runs on the iPhone 6 and iPhone 6 Plus, the entire situation threatens to become unmanageable.
For this reason, iOS 8 introduces a better solution. Instead of a set of launch images, you provide a launch nib file — a single .xib or .storyboard file containing a single view to be displayed as a launch image. You construct this view using subviews and autolayout. Thus, the view is automatically reconfigured to match the screen size and orientation of the device on which the app is launching.
By default, a new app project comes with a LaunchScreen.xib file. This is where you design your launch image. The Info.plist points to this file as the value of its “Launch screen interface file base name” key (UILaunchStoryboardName). You can configure the Info.plist easily, if necessary, by editing the target and setting the Launch Screen File field (under App Icons and Launch Images).
You should take advantage of this feature — and not merely because it is convenient. The presence of a “Launch screen interface file base name” key in your Info.plist is how the system knows that your app runs natively on the iPhone 6 and iPhone 6 Plus. If you don’t have this key, your app will be displayed zoomed, as if the iPhone 6 were just a big iPhone 5S — in effect, you won’t be getting all the pixels you’re entitled to (and the display will be somewhat fuzzy).
The bad news is that if your app is to be backward-compatible to earlier systems, you’ll have to supply old-fashioned launch images in addition to the launch nib file. You need the launch nib file because your app won’t be fully iOS 8–native without it. You need the launch images because systems prior to iOS 8 have never heard of a launch nib file!
The requirements for launch images in iOS 7 and before are complicated — and are made more complicated by the fact that the rules have changed over the years, so that the more systems you want to be compatible with, the more requirements you’ll have to satisfy. I have covered these requirements in earlier editions of this book, and I’m not going to repeat them here.
TIP
Apple provides an extremely helpful sample code project called Application Icons and Launch Images for iOS. It provides icons and launch images of all sizes and demonstrates the proper naming conventions.
Screenshots and Video Previews
When you submit your app to the App Store, you will be asked for one or more screenshots of your app in action to be displayed at the App Store. You should take these screenshots beforehand and be prepared to provide them during the app submission process.
The required screenshot sizes are listed in Apple’s iTunes Connect Developer Guide, in the appendix “iTunes Connect App Properties.” The dimensions of a screenshot depend on its orientation and the screen size. You must provide at least one screenshot corresponding to the screen size of every device on which your app can run, in the corresponding resolution.
You can obtain screenshots either from the Simulator or from a device connected to the computer:
Simulator
Run the app in the Simulator, first setting the destination to get the desired device type and resolution. Choose File → Save Screen Shot.
Device
In Xcode, in the Devices window, locate your connected device under Devices and click Take Screenshot. Alternatively, choose Debug → View Debugging → Take Screenshot of [Device].
In both cases, the screenshot file is saved to wherever screenshots are normally saved on your computer (usually the Desktop).
You can also take a screenshot on a device by clicking the screen lock button and the Home button simultaneously. Now the screenshot is in the Camera Roll in the Photos app, and you can communicate it to your computer in any convenient way (such as by emailing it to yourself).
New in iOS 8, you can also submit to the App Store a video preview showing your app in action. It can be up to 30 seconds long, in H.264 or Apple ProRes format. Your computer can capture video of your device if it is running OS X 10.10 (“Yosemite”) or later. Your device must be sufficiently modern to have a Lightning connector:
1. Connect the device to the computer and launch QuickTime Player. Choose File → New Movie Recording.
2. If necessary, set the Camera and Microphone to the device, using the pop-up menu from the down-pointing chevron button next to the Record button that appears when you hover the mouse over the QuickTime Player window.
3. Start recording, and exercise the app on the device. When you’re finished, stop recording and save.
The resulting movie file can be edited in iMovie or Final Cut Pro to prepare it for submission to the App Store. For example, in iMovie:
1. After importing the movie file, choose File → New App Preview.
2. Edit! When you’re done editing, choose File → Share → App Preview. This ensures the correct resolution and format.
For more details, see the “App Preview” section of the “First Steps” chapter of Apple’s iTunes Connect Developer Guide.
Property List Settings
A number of settings in the Info.plist are crucial to the proper behavior of your app. You should peruse Apple’s Information Property List Key Reference for full information. Most of the required keys are created as part of the template, and are given reasonable default values, but you should check them anyway. The following are particularly worthy of attention:
Bundle display name (CFBundleDisplayName)
The name that appears under your app’s icon on the device screen; this name needs to be short in order to avoid truncation. I talked earlier in this chapter about how to localize the display name.
Supported interface orientations (UISupportedInterfaceOrientations)
This key designates the totality of orientations in which the app is ever permitted to appear. You can perform this setting with checkboxes in the General tab of the target editor. But you may also need to edit the Info.plist manually to rearrange the order of possible orientations, because on an iPhone the first orientation listed is the one into which the app will actually launch.
Required device capabilities (UIRequiredDeviceCapabilities)
You should set this key if the app requires capabilities that are not present on all devices. But don’t use this key unless it makes no sense for your app to run at all on a device lacking the specified capabilities.
Bundle version (CFBundleVersion)
Your app needs a version number. The best place to set it is the General tab of the target editor. Things are a little confusing here because there is both a Version field and a Build field; the former corresponds in the Info.plist to “Bundle versions string, short” (CFBundleShortVersionString), while the latter corresponds to “Bundle version” (CFBundleVersion). As far as I can determine, Apple will pay attention to the former if it is set, and otherwise will fall back on the latter. In general I play it safe and set both to the same value when submitting to the App Store. The value needs to be a version string, such as "1.0". This version number will appear at the App Store. Failure to increment the version string when submitting an update will cause the update to be rejected.
Submission to the App Store
When you’re satisfied that your app works well, and you’ve installed or collected all the necessary resources, you’re ready to submit your app to the App Store for distribution. To do so, you’ll need to make preparations at the iTunes Connect web site. You can find a link to it on the iOS developer pages when you’ve logged in at Apple’s site. You can go directly to http://itunesconnect.apple.com, but you’ll still need to log in with your iOS Developer username and password.
NOTE
The first time you visit iTunes Connect, you should go to the Contracts section and complete submission of your contract. You can’t offer any apps for sale until you do, and even free apps require completion of a contractual form.
I’m not going to recite all the steps you have to go through to tell iTunes Connect about your app, as these are described thoroughly in Apple’s iTunes Connect Developer Guide, which is the final word on such matters. But I’ll just mention the main pieces of information you will sooner or later have to supply:
Your app’s name
This is the name that will appear at the App Store; it need not be identical to the short name that will appear under the app’s icon on the device, dictated by the “Bundle display name” setting in your Info.plist file. Apple recommends that this be 25 characters or fewer, though it can be longer. You can get a rude shock when you submit your app’s information to iTunes Connect and discover that the name you wanted is already taken. There is no reliable way to learn this in advance, and such a discovery can necessitate a certain amount of last-minute scrambling on your part.
Description
You must supply a description of fewer than 4,000 characters; Apple recommends fewer than 580 characters, and the first paragraph is the most important, because this may be all that users see at first when they visit the App Store. It must be pure text, without HTML and without character styling.
Keywords
This is a comma-separated list shorter than 100 characters. These keywords will be used, in addition to your app’s name, to help users discover your app through the Search feature of the App Store.
Support
This the URL of a web site where users can find more information about your app; it’s good to have the site ready in advance.
Copyright
Do not include a copyright symbol in this string; it will be added for you at the App Store.
SKU number
This is arbitrary, so don’t get nervous about it. It’s just a unique identifier, unique within the world of your own apps. It’s convenient if it has something to do with your app’s name. It needn’t be a number; it can actually be any string.
Price
You don’t get to make up a price. You have to choose from a list of pricing “tiers.”
Availability Date
There’s an option to make the app available as soon as it is approved, and this will typically be your choice.
When you’re ready to upload the app for which you’ve already submitted the information at iTunes Connect, you can perform the upload using Xcode. Select the archived build in the Organizer and click Submit. The upload will be performed, and the app will be validated at the far end.
Alternatively, you can use Application Loader. Export the archive as an .ipa file, as for an Ad Hoc distribution, but use the App Store distribution profile. Launch Application Loader by choosing Xcode → Open Developer Tool → Application Loader, and hand it the .ipa file.
You will subsequently receive emails from Apple informing you of your app’s status as it passes through various stages: “Waiting For Review,” “In Review,” and finally, if all has gone well, “Ready For Sale” (even if it’s a free app). Your app will then appear at the App Store.
All materials on the site are licensed Creative Commons Attribution-Sharealike 3.0 Unported CC BY-SA 3.0 & GNU Free Documentation License (GFDL)
If you are the copyright holder of any material contained on our site and intend to remove it, please contact our site administrator for approval.
© 2016-2026 All site design rights belong to S.Y.A.