Beginning Visual Basic(2012)
Chapter 18
Exception Handling, Debugging, and Tracing
What You Will Learn in This Chapter:
· How to write code that is able to detect and handle errors that occur at run time, at the same time shielding your users from the error details
· How to detect errors that occur on your production machine so you can take countermeasures
· What debugging is and what debugging tools VS offers
· What tools you can use to gain information about your system and code while it's running in a development or production environment
Wrox.com Code Downloads for this Chapter
You can find the wrox.com code downloads for this chapter on the Download Code tab at www.wrox.com/remtitle.cgi?isbn=1118311809. The code is in the Chapter 18 download.
You can't make an omelet without breaking eggs and you cannot write code without creating bugs. No matter how hard you try and how good you are, your code will contain problems that affect the behavior of your website.
Of course you should strive to minimize the impact of these bugs, aiming for a “zero bug count.” To aid you in this, the ASP.NET run time and Visual Studio provide you with a number of tools.
First of all, the languages supported by .NET implement exception handling, a methodology to identify and handle errors that occur at run time. By handling these errors, you can present your users a friendly error message. At the same time, you can log these errors, giving you a chance to fix them before they reoccur. In this chapter, you see how exception handling works, and how to log your errors.
Before your code goes into production, you need to write and debug it first. To help you debug your code, VS comes with a rich toolset that includes ways to step through your code line by line, look at your variables and objects at run time, and even change them as you go. The toolset also provides you with valuable information about the execution path your code follows: the path that your application takes through your code, following methods, event handlers, If and Else statements, and so on. In the next section, you learn more about exception handling, while the debugging tools are discussed later in this chapter.
Exception Handling
Whenever you write code, there is a chance things won't turn out as expected, resulting in code that does not compile, a crash, or otherwise unexpected behavior of your application. Things can go wrong for a large number of reasons: you introduce a typo in your code, the database server you're connecting to at run time suddenly goes down, you got your logic mixed up and accidentally deleted all rows from a database table instead of just one, you try to delete a row from a database table that still has associated rows, you try to write a file to a folder without proper permissions, your users enter incorrect data, and so forth.
To understand these problems and think of ways to anticipate, avoid, and handle them, you first need to understand the different types of errors that may occur in your website. Once you understand the main differences, the remainder of this section is spent discussing ways to prevent and solve them.
Different Types of Errors
You can broadly categorize errors into the following groups:
· Syntax errors—Errors that are caused by typos, missing keywords, or otherwise incorrect code.
· Logic errors—Errors in applications that seem to run fine but that produce unexpected or unwanted results.
· Runtime errors—Errors that cause the application to crash or behave unexpectedly at run time.
Each of these categories is discussed in the following sections, together with information on avoiding and fixing them.
Syntax Errors
Syntax errors, or compile errors, are the easiest to find and fix because they happen during development. The IDE tells you when an error occurs and often prevents you from running the application while it still contains errors. Syntax errors are caused by simple typos, missing or duplicate keywords and characters, and so on. The following examples all show errors that are caught at development time by the compiler. A compiler is a program that turns the human-readable code you write in VB.NET or C# into machine-readable code that can be executed.
VB.NET
mailBody = mailBody.Repalce("##Name##", Name.Text) ‘ Replace is misspelled
Response.Write() ‘ Required parameter
‘ for the Write method
‘ is missing
If i > 10 ‘ Missing keyword Then
‘ Do something here
End If
C#
mailBody = mailBody.Repalce("##Name##", Name.Text); // Replace is misspelled
Response.Write(); // Required parameter for the
// Write method is missing
if (i > 10) // Missing opening brace or
// extraneous closing brace
// Do something here
}
Compile errors are always displayed in the Error List (accessible through the View ⇒ Error List menu), shown in Figure 18.1 for a C# website.
Figure 18.1
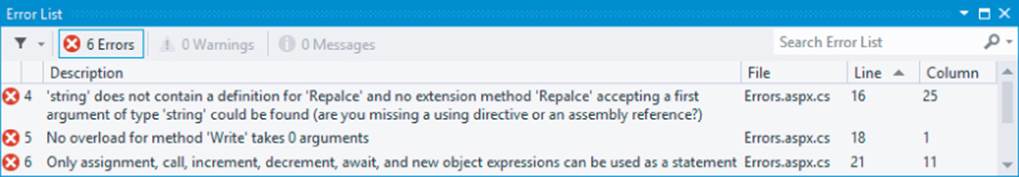
You can force the compiler to give you an up-to-date list of all the compilation errors in your site. To do this, from the main menu choose Build ⇒ Build Web Site. When you want to force VS to recompile the entire site (which is slower as it also recompiles files that haven't changed), choose Build ⇒ Rebuild Web Site instead.
To go to the location where the error occurred so you can fix it, double-click the error in the Error List. To cycle through the errors and the code where the error occurs, click an error in the Error List and press F8 to go to the next error.
Logic Errors
Logic errors are often harder to find because they compile fine but only happen during the execution of your code. Consider the following buggy example:
VB.NET
Dim fromAddress As String = "you@example.com"
Dim toAddress As String = EmailAddress.Text
myMessage.From = New MailAddress(toAddress)
myMessage.To.Add(New MailAddress(fromAddress))
C#
string fromAddress = "you@example.com";
string toAddress = EmailAddress.Text;
myMessage.From = new MailAddress(toAddress);
myMessage.To.Add(new MailAddress(fromAddress));
Although it's easy to see what the problem is in this example (the To and From addresses are mixed up), it may be harder to find in a file with 250 lines of code. Additionally, because the compiler happily accepts your mistake, you won't notice the error until you see a message in your Inbox that you thought you sent to your visitors.
The best way to track down and solve logic errors is using the built-in debugging capabilities of VS. You get an in-depth look at these tools later in the chapter.
Runtime Errors
Runtime errors occur at run time, which makes them incredibly difficult to track. Imagine you have a site that contains a bug that's hidden somewhere in a page. You haven't found it yet, but one of your visitors did and she gets a nasty error message (more on those later) instead. What can you do? Probably not much, because there's a fair chance your visitor won't even inform you about the mistake.
So, it's important to have a good error handling strategy in place that enables you to avoid errors when possible, and that handles them gracefully and optionally logs relevant information for you when they occur.
The following section deals with detecting and handling errors, or exceptions in .NET parlance; later in this chapter, you learn how to log errors and shield your users from ugly pages with detailed exception messages.
Catching and Handling Exceptions
Normally, when serious exceptions occur, the user is presented with an error message. For example, if you try to send a message to a mail server that isn't up and running, or doesn't allow you to connect to it, you'll get an exception that provides details about the error. The exception that you get is an instance of a class that ultimately inherits the System.Exception class; the base class for all exceptions. Many exception types exist, each serving a distinct purpose.
By default, this exception bubbles up all the way to the user interface where it's presented as a so-called Yellow Screen of Death, a reference to Windows' “Blue Screen of Death” that you get when Windows crashes. You see a real example of this error in the next exercise.
Obviously, it's a lot better if you can anticipate the exception and write some code that prevents it from appearing in the user interface. You could, for example, display a nicely formatted message to users instead, informing them the message could not be sent at this moment.
Fortunately, support for these kinds of scenarios is integrated deeply in the .NET programming languages such as C# and Visual Basic .NET. In these languages, you can make use of Try Catch Finally blocks (try catch finally in C#) where code that could potentially throw an exception is wrapped in a Try block. Note that the VB.NET and C# versions of these keywords only differ in case; I'll refer to the capitalized version in the remainder of the text, except in code blocks.
When an exception occurs, the remainder of the code in the Try block is skipped and some code in a Catch block can be run to deal with the error. You can have multiple Catch blocks that all deal with specific exceptions, but only the first block that matches the exception type will fire. Therefore, it's important to order the various Catch blocks from specific to generic in order to handle the exception in the most specific Catch block. You see more of this later.
A Try or a Catch block can be followed by a Finally block. Code in a Finally block is always fired, regardless of whether an exception occurred and, as such, is an ideal location for some clean-up code.
Both Catch and Finally blocks are optional, although you always need at least one of them.
The code in the following example tries to send an e-mail and then sets the Text property of a Label to the value of the variable userMessage. Note: myMessage and mySmtpClient are created by code not shown in this example. The userMessage variable is assigned a value in either the Try block (when the code executed successfully) or in the Catch block (when an error occurred). Either way, this userMessage is always assigned to the Label in the Finally block:
VB.NET
Dim userMessage As String = String.Empty
Try
mySmtpClient.Send(myMessage)
userMessage = "Message sent"
Catch ex As Exception
userMessage = "An unknown error occurred."
Finally
Message.Text = userMessage
End Try
C#
string userMessage = string.Empty;
try
{
mySmtpClient.Send(myMessage);
userMessage = "Message sent";
}
catch (Exception ex)
{
userMessage = "An unknown error occurred.";
}
finally
{
Message.Text = userMessage;
}
In this code example, the Catch block is set up to handle an exception of type System.Exception, the base class of all exceptions in the .NET Framework. This exception is sent to (or caught by) the Catch block in the ex variable. In C#, you could leave out the ex variable if you don't use it in your code:
C#
catch (Exception)
{
userMessage = "An unknown error occurred.";
}
The ability to specify an Exception type is useful when you think your code can encounter more than one exception. In that case, you can have multiple Catch blocks for different Exception types. The following code is capable of handling a specific SmtpException that may occur during the mail sending operation, and it's also capable of catching all other exceptions using its generic Catch block:
VB.NET
Try
mySmtpClient.Send(myMessage)
Catch smtpException As SmtpException
userMessage = "Sorry, an error occurred while sending your message."
Catch ex As Exception
‘ Something else went wrong.
End Try
C#
try
{
mySmtpClient.Send(myMessage);
}
catch (SmtpException smtpException)
{
userMessage = "Sorry, an error occurred while sending your message.";
}
catch (Exception ex)
{
// Something else went wrong.
}
The order of the exception-handling blocks is important. .NET scans the list of Catch blocks from top to bottom and only fires the code in the first block that matches a specific type of exception. In the preceding example, when an SmtpException occurs (which is a subclass of Exception), it will be caught by the Catch block that handles exceptions of type SmtpException. Although an SmtpException is also an Exception, the code in the last Catch block won't be fired anymore because only the first matching Catch block is handled. Therefore, if you reverse the order of the Catch blocks in this example, the more generic Exception block would be executed, and the code in the SmtpException block would never run.
COMMON MISTAKES
The preceding example shows how to catch all exceptions using the base Exception type in the Catch block. Don't use this in your own websites. Instead, handle only those types of exceptions that you know how to deal with, and let all other, unknown exceptions bubble in the application. Later in this chapter you see how to centrally handle these unhandled exceptions.
In the following exercise, you see how to use Try Catch Finally in your code.
Try It Out: Handling Exceptions
In this Try It Out, you see how to write exception-handling code to catch problems with sending e-mail. These problems may occur when the mail server is down, for example. To simulate a broken mail server, you'll temporarily use a nonexistent mail server name causing your code to crash.
You'll try out the Try Catch Finally code in a separate page in the Demos folder so you can closely watch its behavior. When you understand how it works, you'll modify the ContactForm.ascx user control and incorporate the exception-handling code there. The reason you write this code in the demo page first is that the user control uses an Ajax UpdatePanel that shields users from the dirty details of an exception by default, making it difficult to see what's going on.
1. Create a new file in the Demos folder and call it ExceptionHandling.aspx. Base the page on your custom template and set its Title to Exception Handling Demo.
2. Add a Label control to the main content area and set its ID to Message.
3. Switch to Design View and set up an event handler for the Load event of the page by double-clicking the read-only area of the page. Then at the top of the file, add either an Imports or a using statement for the System.Net.Mail namespace:
VB.NET
Imports System.Net.Mail
C#
using System.Net.Mail;
4. Add the following code to the event handler that VS created. Notice how this code is almost identical to the code you added in the ContactForm.ascx user control, so you can save yourself some typing by copying parts of the code from that file. Notice how the code passes"DoesNotExist" to the SmtpClient's constructor as an argument for the mail host. This is done deliberately to trigger an exception.
VB.NET
Protected Sub Page_Load(sender As Object, e As EventArgs) Handles Me.Load
Dim myMessage As MailMessage = New MailMessage()
myMessage.Subject = "Exception Handling Test"
myMessage.Body = "Test message body"
myMessage.From = New MailAddress("you@example.com")
myMessage.To.Add(New MailAddress("you@example.com"))
Dim mySmtpClient As New SmtpClient("DoesNotExist")
mySmtpClient.Send(myMessage)
Message.Text = "Message sent"
End Sub
C#
protected void Page_Load(object sender, EventArgs e)
{
MailMessage myMessage = new MailMessage();
myMessage.Subject = "Exception Handling Test";
myMessage.Body = "Test message body";
myMessage.From = new MailAddress("you@example.com");
myMessage.To.Add(new MailAddress("you@example.com"));
SmtpClient mySmtpClient = new SmtpClient("DoesNotExist");
mySmtpClient.Send(myMessage);
Message.Text = "Message sent";
}
Don't forget to change the two e-mail addresses to your own.
5. Open Web.config and comment out the <system.net> element (select the entire element and then press Ctrl+K followed by Ctrl+C). You added this element in Chapter 9 to configure your site for sending e-mails. By disabling it temporarily, you can ensure that no settings from the configuration file are used which in turn will force the SmtpClient to try to deliver the e-mail at the DoesNotExist server which obviously will fail. Save the changes to the file, but keep it open so you can easily undo this change in a later step.
6. Switch back to ExceptionHandling.aspx and press Ctrl+F5 to open up the page in your browser. You should see the “Yellow Screen of Death" with an error message. Scroll down in the page to see the Stack Trace, shown in Figure 18.2.
Figure 18.2
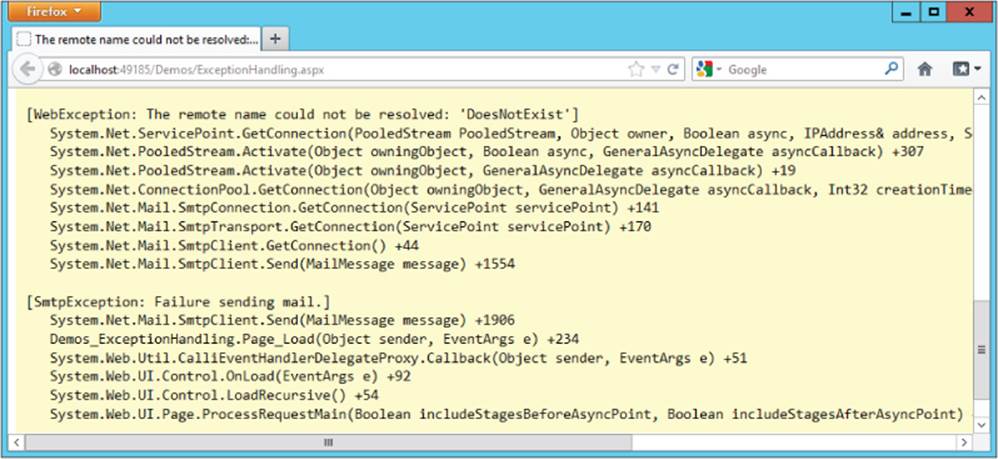
Note that two exceptions are listed: a WebException (to indicate that the name DoesNotExist could not be resolved) and a SmtpException. The code in the SmtpClient encountered and caught the WebException, wrapped it in a new SmtpException and threw that exception to indicate to your code that a problem occurred.
7. Go back to VS and wrap the code that assigns the addresses and sends the message in a Try Catch block:
VB.NET
Try
myMessage.From = New MailAddress("you@example.com")
myMessage.To.Add(New MailAddress("you@example.com"))
Dim mySmtpClient As New SmtpClient("DoesNotExist")
mySmtpClient.Send(myMessage)
Message.Text = "Message sent"
Catch ex As SmtpException
Message.Text = "An error occurred while sending your e-mail. Please try again."
End Try
C#
try
{
myMessage.From = new MailAddress("you@example.com");
myMessage.To.Add(new MailAddress("you@example.com"));
SmtpClient mySmtpClient = new SmtpClient("DoesNotExist");
mySmtpClient.Send(myMessage);
Message.Text = "Message sent";
}
catch (SmtpException)
{
Message.Text = "An error occurred while sending your e-mail. Please try again.";
}
Notice how the code still contains an invalid mail server.
8. Save your changes and request the page in your browser again. You should now see a user-friendly error message, visible in Figure 18.3.
Figure 18.3
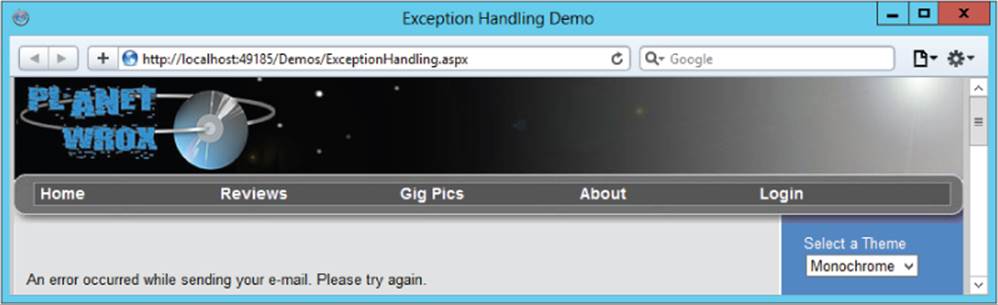
The exception that is thrown is now caught in the Catch block. Instead of getting an error page with all the technical details of the exception, the user now gets a friendly message explaining that something went wrong.
9. Go back to ExceptionHandling.aspx and fix the code for the SmtpClient:
VB.NET
Dim mySmtpClient As New SmtpClient()
C#
SmtpClient mySmtpClient = new SmtpClient();
Also, in Web.config undo the changes you made earlier by restoring the <system.net> element.
10. Save all open changes and request ExceptionHandling.aspx in your browser again. You'll now get a message indicating that the e-mail was sent successfully.
11. Open ContactForm.ascx from the Controls folder, switch to its Code Behind, and wrap the code that creates and sends the message in the following Try Catch block. Also, move the line that sets the visibility of the Message control to the Finally block:
VB.NET
Try
Dim myMessage As New MailMessage()
...
System.Threading.Thread.Sleep(5000)
Catch ex As SmtpException
Message.Text = "An error occurred while sending your e-mail. Please try again."
Finally
Message.Visible = True
End Try
C#
try
{
MailMessage myMessage = new MailMessage();
...
System.Threading.Thread.Sleep(5000);
}
catch (SmtpException)
{
Message.Text = "An error occurred while sending your e-mail. Please try again.";
}
finally
{
Message.Visible = true;
}
Notice how the line that sets the Message control's Visible property to True is now in a Finally block. This way, the Label is made visible, regardless of whether an error occurred.
From now on, whenever an error occurs during the sending of the e-mail, your users will get a normal error message instead of the full error detail page that .NET displays by default.
How It Works
When an exception occurs at run time, .NET checks if the code is wrapped in a Try Catch block. If that's the case, it scans the list of Catch blocks for an Exception type that matches the exception being thrown. Only the first Catch block that matches the Exception is being called; all remaining Catch blocks are ignored. Code in the Try block following the line that caused the exception is not executed anymore.
In this exercise, the code has a Catch block for the SmtpException type, which is executed when an exception of that type—or one of its subtypes—is encountered. As you learned before the exercise, you can have multiple Catch blocks, each one dealing with a specific type of exception. All other exceptions won't be handled by this code. You see how to deal with these other exceptions in a later section.
With these Try Catch Finally blocks, you can write code that helps you deal with errors that you think might happen in your code. It's always a good practice to wrap code that might throw an error in a Try Catch block so you can deal with it gracefully. Some examples of code that may throw an exception include:
· Sending e-mail—The mail server may be down, or you may not have the permissions to access it.
· Accessing a database—The server may be down, you may not have permission to access it, you may get an error due to foreign key constraint violations as you saw in Chapter 15, and so on.
· Trying to write an uploaded file to disk—The disk may be full, you may not have the necessary permissions to write to disk, or you are providing an invalid filename.
Although Try Catch blocks are great to avoid exceptions from bubbling up to the user interface, you should use them with care, because they come at a cost. A Try Catch block is generally slower than code without it, so you shouldn't use a Try Catch block for errors you can avoid otherwise. Consider the following example that divides two numbers:
VB.NET
Dim value1 As Integer = Convert.ToInt32(ValueBox1.Text)
Dim value2 As Integer = Convert.ToInt32(ValueBox2.Text)
Try
result = value1 / value2
ResultLabel.Text = result.ToString()
Catch ex As DivideByZeroException
ResultLabel.Text = "Sorry, division by zero is not possible."
End Try
C#
int value1 = Convert.ToInt32(ValueBox1.Text);
int value2 = Convert.ToInt32(ValueBox2.Text);
try
{
result = value1 / value2;
ResultLabel.Text = result.ToString();
}
catch (DivideByZeroException ex)
{
ResultLabel.Text = "Sorry, division by zero is not possible.";
}
In this example, the code is set up to expect a DivideByZeroException. This exception is thrown when value2 contains the value 0. Although at first it seems like a good idea to implement exception handling here, it's actually much better to write code that checks for this value before the division is carried out, instead of letting an exception occur:
VB.NET
If value2 <> 0 Then
result = value1 / value2
ResultLabel.Text = result.ToString()
Else
ResultLabel.Text = "Sorry, division by zero is not possible."
End If
C#
if (value2 != 0)
{
result = value1 / value2;
ResultLabel.Text = result.ToString();
}
else
{
ResultLabel.Text = "Sorry, division by zero is not possible.";
}
Of course it would even be better if you had placed a CompareValidator on the page, making sure that ValueBox2 could never contain the value zero. Chapter 9 explains how to use this control.
Although Try Catch blocks are useful to catch exceptions that you anticipate, what about errors you don't? How can you deal with unexpected errors? Because they are unexpected, you won't know when they occur, so it's difficult to write code to handle them.
To solve this problem, the next section shows you how you can globally catch and log unhandled exceptions and send information about them by e-mail. This way, you know they occurred, giving you, the page developer, a chance to fix them before they happen again.
Global Error Handling and Custom Error Pages
To shield your users from the technical details of the exception, you should provide them with a user-friendly error page instead. Fortunately, ASP.NET enables you to define custom error pages: ASPX pages that are shown to the user when an exception occurs. You can map different types of errors (server errors, page not found errors, security problems, and so forth) to different pages.
You define the error page or pages you want to show in the customErrors element of the Web.config file. A typical element looks like this:
<customErrors mode="On" defaultRedirect="∼/Errors/Error500.aspx"
redirectMode="ResponseRewrite">
<error statusCode="404" redirect="∼/Errors/Error404.aspx" />
<error statusCode="500" redirect="∼/Errors/Error500.aspx" />
</customErrors>
The mode attribute determines whether or not a visitor to your site gets to see a detailed error page. The attribute supports the following three values:
· On—Every visitor to your site always sees the custom error page when an error occurs.
· Off—The custom error page is never shown and full error details are displayed on the page.
· RemoteOnly—The full error details are shown to local users (browsing the site from the same machine as the site runs on), while all other users get to see the custom error page. This setting enables you to see error messages on your site during development, while your users are always presented with the custom error page.
Within the opening and closing tags of the customErrors element you define separate <error /> elements, one for each HTTP status code you want to support. The previous configuration defines two custom pages: one that is shown when the requested page could not be found (a 404 status code) and one that is shown when a server error occurs (a 500 code).
For all other HTTP status codes you haven't defined explicitly, the defaultRedirect attribute is used to determine the custom error page.
The redirectMode attribute determines the way the new page is shown to the user and is discussed later in this chapter.
Although custom error pages shield your users from the exception details, they don't help in informing you that an exception occurred. All these pages do is hide the real error and show a page with a custom error message instead. To be notified about these exceptions, you could write some code that looks at the exception and then sends you an e-mail with the details. Alternatively, you could write code that inserts the error details in a database, or writes them to a text file.
ASP.NET offers you a handy, central location to write code that is triggered when an exception occurs. You write this code in a special event handler called Application_Error inside the Global.asax file that you saw first in Chapter 11. Inside this event handler, you can collect relevant data about the exception, stick it in an e-mail message, and send it to your own Inbox. This gives you detailed information about exceptions that occur on your site, aiding in fixing the problem as soon as possible. You see how to write this code in the next exercise.
Try It Out: Handling Exceptions Site Wide
In this Try It Out you learn how to write code in the Global.asax file to send the exception message by e-mail. Additionally, you see how to create global error pages that are shown to your user in case of an error.
1. If you didn't add the Global.asax file to your site in Chapter 11, you need to add it first. To do so, right-click the website in the Solution Explorer and choose Add ⇒ Add New Item. In the list with templates, select Global Application Class. Leave its name set to Global.asax and click Add.
2. At the top of the Global.asax file, right after the Application directive, add the following Import statement. Note that when adding an Import statement in Markup View, both VB.NET and C# use the keyword Import, rather than Imports and using that you normally use in Code Behind:
VB.NET
<%@ Application Language="VB" %>
<%@ Import Namespace="System.Net.Mail" %>
C#
<%@ Application Language="C#" %>
<%@ Import Namespace="System.Net.Mail" %>
3. Inside the Application_Error handler that should already be present in the Global.asax file, add the following highlighted code that is triggered whenever an unhandled exception occurs in your site. If the handler isn't there, make sure you type all the code from the following snippet, including the parts that are not bolded:
VB.NET
Sub Application_Error(ByVal sender As Object, ByVal e As EventArgs)
If HttpContext.Current.Server.GetLastError() IsNot Nothing Then
Dim myException As Exception =
HttpContext.Current.Server.GetLastError().GetBaseException()
Dim mailSubject As String = "Error in page " & Request.Url.ToString()
Dim message As String = String.Empty
message &= "<strong>Message</strong><br />" & myException.Message & "<br />"
message &= "<strong>Stack Trace</strong><br />" &
myException.StackTrace & "<br />"
message &= "<strong>Query String</strong><br />" &
Request.QueryString.ToString()&"<br />"
Dim myMessage As MailMessage = New MailMessage("you@example.com",
"you@example.com", mailSubject, message)
myMessage.IsBodyHtml = True
Dim mySmtpClient As SmtpClient = New SmtpClient()
mySmtpClient.Send(myMessage)
End If
End Sub
C#
void Application_Error(object sender, EventArgs e)
{
if (HttpContext.Current.Server.GetLastError() != null)
{
Exception myException =
HttpContext.Current.Server.GetLastError().GetBaseException();
string mailSubject = "Error in page " + Request.Url.ToString();
string message = string.Empty;
message += "<strong>Message</strong><br />" + myException.Message + "<br />";
message += "<strong>Stack Trace</strong><br />" + myException.StackTrace +
"<br />";
message += "<strong>Query String</strong><br />" +
Request.QueryString.ToString() + "<br />";
MailMessage myMessage = new MailMessage("you@example.com",
"you@example.com", mailSubject, message);
myMessage.IsBodyHtml = true;
SmtpClient mySmtpClient = new SmtpClient();
mySmtpClient.Send(myMessage);
}
}
Don't forget to change the two e-mail addresses that are passed to the MailMessage's constructor. The first address represents the sender's address, and the second one holds the recipient's address.
4. Save all your changes and close the Global.asax file.
5. Next, open up the Web.config file, and as a direct child of <system.web>, add the following customErrors element:
<system.web>
<customErrors mode="On" defaultRedirect="∼/Errors/OtherErrors.aspx"
redirectMode="ResponseRewrite">
<error statusCode="404" redirect="∼/Errors/Error404.aspx" />
</customErrors>
Save and close the configuration file.
6. Create a new folder in the root of your website and call it Errors.
7. Inside this new folder, create two new Web Forms and call them Error404.aspx and OtherErrors.aspx, respectively. Make sure both of them are based on your custom template so they are using the main master page and inherit from BasePage. If you followed the exercises in the previous chapter and now use Profile to store the user's favorite theme, refer to the Common Mistakes section at the end of this exercise to learn about the pitfalls of using the master page and BasePage for your custom 404 error page.
8. Set the Title of Error404.aspx to File Not Found. Inside the content placeholder for the main content, add the following markup:
<asp:Content ID="Content2" ContentPlaceHolderID="cpMainContent" runat="Server">
<h1>File Not Found</h1>
<p>The page you requested could not be found. Please check out the
<a href="∼/" runat="server">Homepage</a>
or choose a different page from the menu.</p>
<p>The Planet Wrox Team</p>
</asp:Content>
9. Switch to Design View, double-click the page to set up a Page_Load handler, and add the following code to it:
VB.NET
Protected Sub Page_Load(sender As Object, e As EventArgs) Handles Me.Load
Response.Status = "404 Not Found"
Response.StatusCode = 404
Response.TrySkipIisCustomErrors = True
End Sub
C#
protected void Page_Load(object sender, EventArgs e)
{
Response.Status = "404 Not Found";
Response.StatusCode = 404;
Response.TrySkipIisCustomErrors = true;
}
10. Open the generic OtherErrors.aspx page, set its Title to An Error Occurred, and enter the following content:
<asp:Content ID="Content2" ContentPlaceHolderID="cpMainContent" runat="Server">
<h1>An unknown error occurred</h1>
<p>An error occurred in the page you requested. The error has been logged and
we'll fix it ASAP.</p>
<p>The Planet Wrox Team</p>
</asp:Content>
11. Double-click the page in Design View and add the following code to the Page_Load handler:
VB.NET
Protected Sub Page_Load(sender As Object, e As EventArgs) Handles Me.Load
Response.TrySkipIisCustomErrors = True
End Sub
C#
protected void Page_Load(object sender, EventArgs e)
{
Response.TrySkipIisCustomErrors = true;
}
Because this page will be used for all possible errors except a 404 error, there's no point in setting an explicit Status or StatusCode.
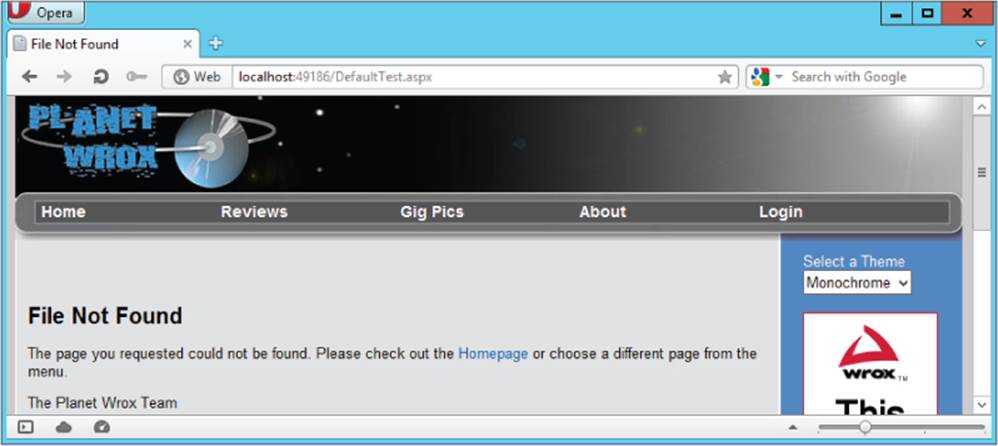
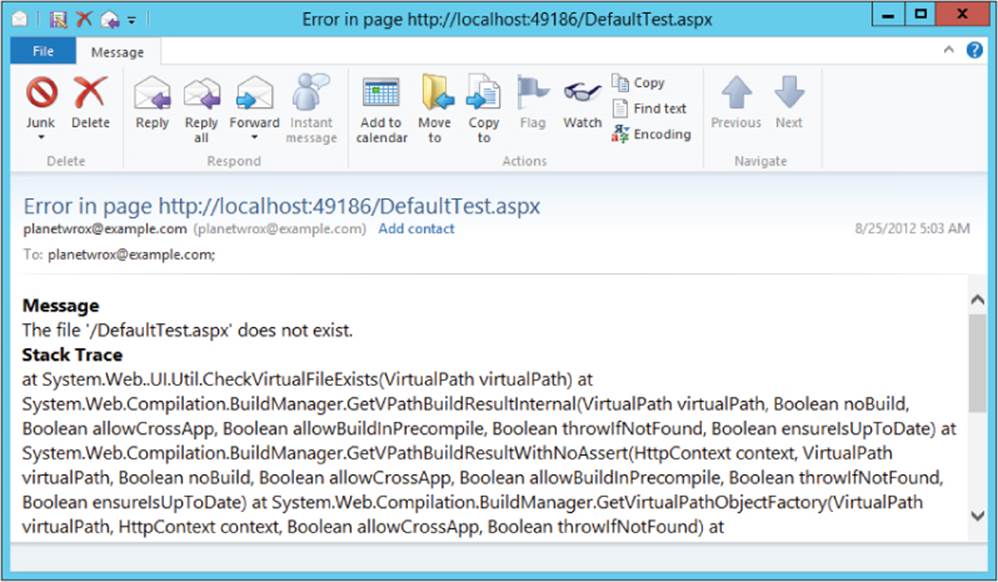
12. Save the changes to all open files by pressing Ctrl+Shift+S and then close them. Right-click Default.aspx in the Solution Explorer and choose View In Browser. Once the page has finished loading, request a nonexistent page like DefaultTest.aspx by changing the address bar of the browser to something like http://localhost:49186/DefaultTest.aspx. Obviously, the DefaultTest.aspx page does not exist, so you get an error. But instead of a detailed error page, you should now get the error page you defined and created in this Try It Out, shown in Figure 18.4.
Figure 18.4
COMMON MISTAKES
If, instead of this error message, you get a generic “File not found" exception page, check the syntax of the customErrors section in the Web.config file. Additionally, check that you can successfully view the actual error pages (Error404.aspx and OtherErrors.aspx) by directly requesting them in the browser. If they contain an error (for example, if you forgot to set the page title) they cannot be used as custom error pages.
You'll also get the generic error page when you followed the exercises in the preceding chapter and rewrote the preferred theme selector to use Profile. Because of the way a 404 error is handled internally, you cannot use Profile in the error page or the master page it's based on. To work around this problem, re-create the Error404.aspx page as a standard Web Form not using your master page and BasePage and things should work fine. You could also set the redirectMode attribute in the Web.config to ResponseRedirect, but from a Search Engine Optimization (SEO) point of view this is not recommended. You'll learn more about the redirectMode attribute and why ResponseRedirect is not the optimal solution in the How it Works section.
Besides the error page in the browser, you should also get a message by e-mail that provides more details about the error. Figure 18.5 shows the message you get when you request a page that does not exist.
Figure 18.5
In the next chapter, you learn how to turn this feature on and off through configuration so you can disable it during development.
How It Works
Two important parts are worth examining in this exercise. The first part is the way the ASP.NET run time hides the “Yellow Screen of Death" with the error details from the user with the use of custom error pages. This serves two purposes. First, it helps you protect potentially private data like passwords or information about database connections that may end up in the error message. Second, it shields your users from cryptic error messages they probably don't understand anyway and gives you the chance to display a good-looking error page instead that integrates with the site's look and feel.
The only thing you need to do to make this work is to enable custom errors in the Web.config file and provide one or more pages you want to display for the errors that may occur in your site. The configuration element lets you set up different pages for different exceptions:
<customErrors mode="On" defaultRedirect="∼/Errors/OtherErrors.aspx"
redirectMode="ResponseRewrite">
<error statusCode="404" redirect="∼/Errors/Error404.aspx" />
</customErrors>
When .NET encounters a 404 exception (when you request a page that cannot be found), the contents of the Error404.aspx page are shown. The name and content of this page are completely up to you, giving you the option to provide your own explanation to the user about what went wrong. Note that this works only for file types that are registered with ASP.NET, like .aspx files. It won't work out of the box for .html files or images when you're not using the Integrated Pipeline mode of IIS, Microsoft's web server. You see more about the Integrated Pipeline mode in the next chapter.
This exercise contains two key elements to improve SEO. First, notice how the redirectMode is set to ResponseRewrite. The other option is ResponseRedirect. Remember the difference between Server.Transfer and Response.Redirect from Chapter 7? These two settings are based on the same principles. If you set redirectMode to ResponseRedirect, the browser (and thus a search engine) is redirected to the error page. The error page then returns a 404 code so the search engine thinks that the error page itself could not be found. If, however, you set redirectMode toResponseRewrite, the originally requested page results in a 404 error code and the contents of the Error404.aspx page are streamed to the browser. This enables search engines to correctly update their indexes. The only downside of the ResponseRewrite setting is that you can't use Profile in the page or a master page it is based on. As you saw earlier, the best work around is to create a page that is not based on your custom template.
The second part that improves SEO is the code in the Code Behind of Error404.aspx. That code sets the HTTP status code to 404 to indicate the page could not be found on the server. Without these two lines of code, search engines won't understand the page doesn't exist and will keep trying to index it.
Notice that only the 404 error code is redirected to its own page. All other exceptions cause the generic OtherErrors.aspx to be loaded. You can, however, add multiple <error /> elements to the <customErrors> element, each one for a different status code. For a list of HTTP status codes, check out this knowledge base article: http://support.microsoft.com/default.aspx/kb/943891.
Note the call to Response.TrySkipIisCustomErrors. This tells IIS that it should not try to render its own custom error pages. Without this setting, you may get IIS's generic error pages instead of the ones you defined here. You won't notice the difference with IIS Express, so this code won't come into play until you deploy your site to a production version of IIS as you'll see in the next chapter.
The other main part of this exercise is the code in Global.asax that fires when an unhandled exception occurs. In that case, the Application_Error event handler is triggered. Within this handler, you can retrieve the exception that occurred with this code:
VB.NET
If HttpContext.Current.Server.GetLastError() IsNot Nothing Then
Dim myException As Exception =
HttpContext.Current.Server.GetLastError().GetBaseException()
C#
if (HttpContext.Current.Server.GetLastError() != null)
{
Exception myException =
HttpContext.Current.Server.GetLastError().GetBaseException();
To get at the root exception that caused the problem in the first place, you need to call GetBaseException() on the Exception that is returned by Server.GetLastError(). This Exception instance, stored in the myException variable, then gives you access to useful properties such as Messageand StackTrace. In this exercise, the StackTrace displayed in the error e-mail contains information that really isn't of any interest to you. However, with other exceptions, such as one thrown by an incorrect configuration of the mail server or a division by zero exception, the StackTracegives you information about the file that generated the error, the method that caused it, and even the line number in the code, making it easy to find the error and fix it.
The remainder of the code creates an e-mail message with the error details. It also adds information about the query string with this code:
VB.NET
message &= "<strong>Query String</strong><br />" &
Request.QueryString.ToString() & "<br />"
C#
message += "<strong>Query String</strong><br />" +
Request.QueryString.ToString() + "<br />";
Knowledge of the query string helps in debugging a problem if values from the query string are used. You could extend the code in Application_Error and add other useful information such as cookies and form collections. For more information about accessing these kinds of collections, pick up a copy of Professional ASP.NET 4.5 published by Wrox. Alternatively, look into ELMAH—the Error Logging Modules and Handlers project—at http://code.google.com/p/elmah/, which is an open source project run by Atif Aziz that is aimed at catching and logging exceptions. The beauty of the ELMAH project is that it's extremely simple to integrate in your site (no programming required, you just need to add a few lines of configuration code to your Web.config file). And even better: there's a NuGet package available that adds the necessary files and configuration for you. Simply run the following command from the Package Manager Console:
Install-Package Elmah
After you have installed ELMAH, you can get a list of the errors that occurred in the site by requesting a special page called elmah.axd:
http://localhost:49394/elmah.axd
By default, you can access this page only from the local machine. Besides showing the errors in elmah .axd, you can also configure ELMAH to store errors in the database, send them by e-mail, provide them as an RSS feed, and much more. Check out the ELMAH project site for more information.
I have been using ELMAH for most of my production websites for the past couple of years, and it has helped me find many bugs that otherwise would have gone unnoticed.
Although the ability to handle and log exceptions at run time is useful, it's of course better to prevent them from happening in the first place. To write solid code with as few bugs as possible, you need good tools to help you understand the execution of your code so you can debug it. VS comes with excellent debugging tools that aid you in this process. You see what these tools are and how to use them in the next section.
The Basics of Debugging
Debugging is the process of finding and fixing bugs in your code. Although that may sound easy, it often isn't. Some bugs are very obvious and easy to spot and thus easy to fix. Others are much harder to find and require knowledge about the execution environment of your program. The debugging tools that ship with Visual Studio help you understand this execution environment by giving you direct access to the inner workings of your program or web page.
Debugging with VS is like snapping your fingers to stop the time. When you do that, everything halts, except for you, so you can walk around in your code, investigate variables, look into objects, try out methods, and even execute new code. To tell VS where to halt, you need to set one or morebreakpoints in your code. When the code under the breakpoint is about to be executed, VS stops the execution of the application (usually a web page, a user control, or code in the App_Code folder) and then puts focus back on VS so you can diagnose the code and its environment.
You set a breakpoint by pressing F9 on the line of code where you want execution to halt. Instead of the F9 shortcut key, you can also click the margin of the code, where the big dot appears in Figure 18.6, or you can choose Debug ⇒ Toggle Breakpoint from the main menu. Pressing F9, clicking the same spot in the margin, or choosing the menu item again toggles the presence of the breakpoint. To clear all breakpoints in your entire website, press Ctrl+Shift+F9.
To give you an idea of how debugging works, and what it can do to help you, the following exercise shows you the basic operations of debugging. Later parts of this chapter give you a detailed look at the numerous debugging tools and windows that ship with VS.
Try It Out: Debugging Your Application
In this Try It Out, you debug the Calculator page you created in a previous chapter. If you don't have the file, refer to Chapter 5 or download the code for this chapter from www.wrox.com. The debugging exercises in this chapter assume you are using Internet Explorer as your browser. If you are using a different default browser, such as Firefox or Opera, the debugging experience will be largely the same, although you may find that VS does not always get the focus automatically while breaking into your code.
1. Open the CalculatorDemo.aspx page from the Demos folder and switch to Code Behind.
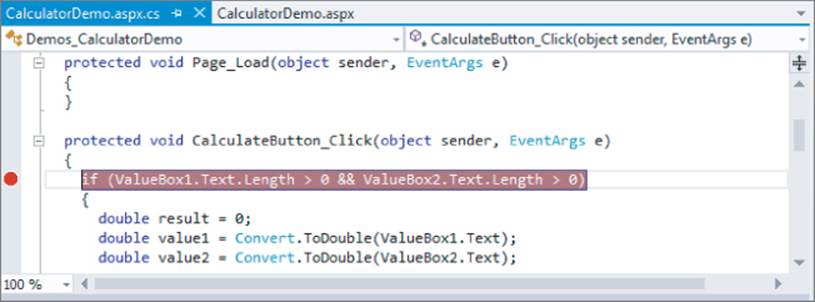
2. Click the first line of code in the CalculateButton_Click handler that checks the length of the text in the two TextBox controls. Then press F9 to set a breakpoint. The line gets highlighted, as shown in Figure 18.6, and a colored dot appears in the margin of the Document Window.
Figure 18.6
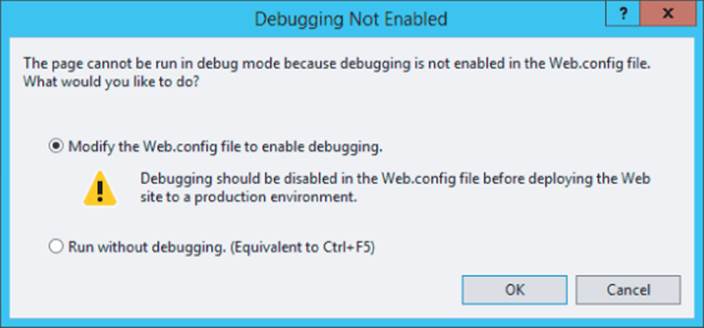
3. Press F5 (instead of Ctrl+F5, which you have been using so far) to open the website in your browser and start the debugging process. Alternatively, choose Debug ⇒ Start Debugging from the main menu. If you get the dialog box in Figure 18.7, click OK to have VS modify theWeb.config file for you.
Figure 18.7
Depending on your browser's setup, you may be confronted with a dialog box (in Internet Explorer only) about enabling Script Debugging. If you get that dialog box, follow the instructions it displays, return to VS, and click the Yes button.
4. The page should load normally, showing you the two TextBox controls, the DropDownList, and the Button.
COMMON MISTAKES
If you get an error stating that the page title is not valid, close your browser, return to VS, give the page a title, save your changes, and press F5 again.
Enter 5 in the first text box, 7 in the second, and then click the Calculate button. Instead of seeing the answer in your browser, you are now taken back to VS. If you're not taken back to VS directly, you may need to switch to it manually. You'll see the taskbar icon for VS flash to get your attention.
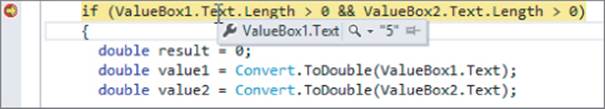
5. In VS, the line with the breakpoint is now highlighted in yellow. Additionally, you see a yellow arrow in the document margin to indicate this line of code is about to be executed. However, before it does, you get a chance to look at your controls, variables, and other elements that make up the execution environment. To see the values you entered in the TextBox controls, hover your mouse over the Text properties in the highlighted lines. You'll see, as shown in Figure 18.8, a small tooltip appear that displays the value you entered.
Figure 18.8
6. Hover your mouse over some of the variables in the code like result and value1. Note that you won't get a tooltip, because the code hasn't reached the point where these variables are declared. As far as the debugger is concerned, they don't exist.
7. To advance in the code, press F10. This steps over the selected line, executing it. Keep pressing F10 until the line that declares the value2 variable is highlighted. When you now hover your mouse over value1, the tooltip appears, indicating that value1 now contains the value 5.0.
8. Hover your mouse over the SelectedValue property in the Select Case (in VB.NET) or switch statement (in C#). Note that the tooltip shows you the value you selected in the drop-down list (the plus symbol). Even if this line of code hasn't been executed, the DropDownList control has been instantiated and its SelectedValue has been assigned a value earlier so you can look at it here.
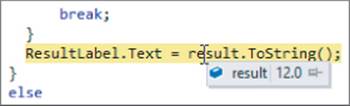
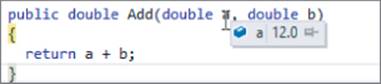
9. Right-click the line that assigns the value to the ResultLabel control and choose Run to Cursor. This executes all code from the current breakpoint up to this line. Hover your mouse over the result variable (you may need to highlight the result variable first with your mouse if you are using VB.NET) and note that it displays the value 12.0, which is the outcome of the calculation, shown in Figure 18.9.
Figure 18.9
10. Finally, press F5. By pressing this key, the code continues until it finds the next breakpoint. Because you haven't defined another breakpoint in your code, the remainder of the code in the Click event handler is executed and the result is displayed in the page.
How It Works
Whenever you press Ctrl+F5 to view a page in a browser as you have done up until this chapter, nothing special happens. VS simply opens the browser, which then requests the page from IIS Express. However, when you press F5 instead, VS gets in debugging mode and respects the breakpoints you have set in your code. Whenever a breakpoint is hit, execution of the code is stopped so you can look at the code and its execution environment, which gives you access to variables, controls, methods, and much more. Note that the code on the line with the breakpoint has not been executed at this point. To continue executing the code, use F10, F11, or F5. You see more of these shortcuts later.
Before you can debug your code, you need to configure the application to support it. You do this by setting the debug attribute of the compilation element in Web.config to true:
<compilation debug="true">
If you're using Visual Basic, you may see two additional attributes on this element: strict and explicit. By default, strict is set to false, which means Visual Basic will do silent casts and conversions for you. The explicit attribute is set to true, which means you need to declare all your variables before you can use them.
Whenever you start debugging and the debug attribute of the <compilation /> is set to false, you get the dialog box shown in Figure 18.7 offering to turn it on for you. To avoid the overhead this setting brings, you should always set it to false on a production server. You see more of this in the next chapter.
In this exercise you also learned how to use data tips, the small tooltip windows that appear when you hover your mouse over selected variables. For simple types, such as an Integer or a String, all you see is the variable's value. For complex types, such as results returned from a LINQ query, you get a much richer data tip, providing you with a lot more detail.
Useful as the debugging data tips may seem, they are only a small part of the rich debugging features. In the next section, you get an overview of all the debugging tools that ship with VS.
Tools Support for Debugging
With a number of shortcut keys and menu items, VS lets you move around the code that you are debugging, giving you the option to execute code line by line or larger blocks of code at once. Additionally, the IDE provides you with a lot of windows that enable you to diagnose and change the execution environment, including the values of variables at run time. You see how to move around code first, which is followed by a discussion on the numerous debugging windows.
Moving Around in Debugged Code
When your code has halted on a breakpoint, you can use a number of keyboard shortcuts to determine what to do next. The following table lists the most common shortcuts.
|
Key |
Description |
|
F5 |
Press this key to start debugging, as demonstrated in the previous exercise. When you press this key during debugging, the code continues until the next breakpoint is hit, or until all code is finished executing. |
|
F11 |
Press this key to execute the current line and step into a member that's being called, if possible. You see how this works later. |
|
F10 |
Press this key to execute the current line without stepping into the code that is being called, unless that code itself contains a breakpoint. |
|
Shift+F11 |
Press this key combination to complete the code in the current code block and return to the code that initially called it. |
|
Shift+F5 |
Press this key combination to stop debugging. |
|
Ctrl+Shift+F5 |
Press this key combination to restart the debugging process. |
In addition to these keyboard shortcuts, you can also use the Debugging toolbar shown in Figure 18.10, which offers similar functionality.
Figure 18.10
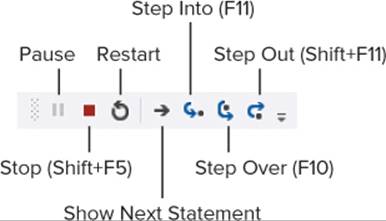
This toolbar should appear automatically when you start debugging, but if it doesn't, right-click an existing toolbar and choose Debug. To start debugging using the toolbar, press the button with the green arrow on the Standard toolbar.
While you are debugging your code in VS, you have a number of debugging windows at your disposal, which are discussed in the following section.
Debugging Windows
The numerous debugging windows enable you to watch the variables in your application and even change them during run time. Additionally, they provide you with information about where you are in the application and what code was previously executed. All this information helps you understand the execution flow of your application.
You access all the debugging windows through the Debug ⇒ Windows menu option. Not all of them are available in the Express edition of Visual Studio. Also, to access most of the windows, your application must be in debug mode first. The next sections show you the different windows that are available. In the exercise that follows, you get a chance to work with them so you understand how to use them and why they are useful.
Watching Variables
Knowing the values of your variables is critical to understanding your application. To help you with this, VS offers three debugging windows that provide you with useful information. All these windows support changing the value of your variables at run time, enable you to use data tips to dig deeper into the objects, and enable you to copy and paste data so you can reuse it somewhere else.
The Watch Window
This is probably the most important window for you to keep an eye on. It enables you to watch variables you're interested in and dig into them. Figure 18.11 shows the Watch window that is currently watching the value1 variable used in the Calculator page while the value2 variable is being added to the list.
Figure 18.11
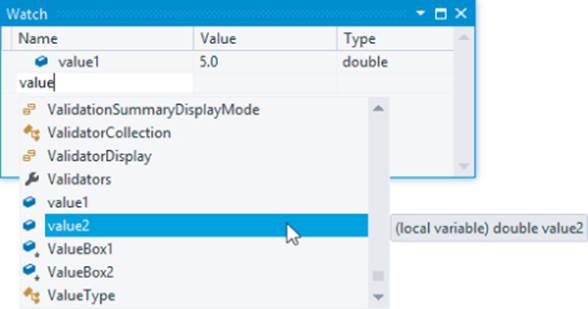
You can add your variables to the Watch window in a few different ways. First of all, you can click the Watch window once and then start typing a variable name. You can then press Ctrl+Space to bring up the IntelliSense list, making it easy to complete the variable's name. Alternatively, you can right-click a variable in the code editor and choose Add Watch. And finally, you can highlight a variable in the code editor and then drag it into the Watch window.
When your variables are in the Watch window, you can change their values to influence the execution of your code. For example, you could change the value of the value1 variable to a different number, changing the outcome of the calculation. To change a value, double-click it in the Value column of the Watch window. Alternatively, right-click the watched variable and choose Edit Value.
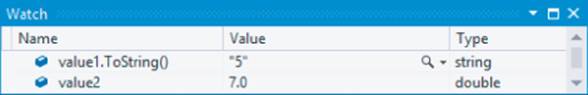
Besides showing variables' values, you can also use the Watch window to execute code. For example, you could call ToString() on the value1 variable to see what its string representation looks like. To do this, double-click the variable name in the Watch window so it becomes editable, add.ToString() as shown in Figure 18.12, and press Enter.
Figure 18.12
You are not limited to calling ToString in the Watch window. Most expressions that produce a value can be executed here, but there are some exceptions (such as LINQ queries). However, the Immediate window, discussed later, is much more appropriate for executing code on the fly.
In addition to the Watch window, the Autos and Locals windows are available. They work more or less the same as the Watch window.
The Autos Window
The Autos window is available only in the commercial versions of Visual Studio and not in the Express edition. Because it's so similar to the Watch window, this isn't really a problem. The Autos window shows the variables used by the current and previous code statements and is updated automatically as you step through the code.
The Locals Window
The Locals window is also similar to the Watch and Autos windows, but the Locals window shows all variables that are currently in scope (they can be “reached" by the code that is currently executing). This is a useful window, because it shows you all relevant variables without requiring you to add them manually.
Other Windows
Besides windows to watch variables, VS has a few other useful windows available.
The Breakpoints Window
The Breakpoints window gives you an overview of all breakpoints you have set in code throughout your entire website. Unfortunately, this window is not available in the Express edition, so you have to find breakpoints manually by looking at the actual code.
Call Stack Window
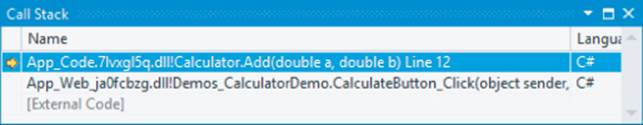
The Call Stack window provides you with information about the order in which your code has been executed or called. Each call from one piece of code into another is placed on a stack of calls that you can navigate. It looks a bit cryptic at first, but once you understand how it works, it enables you to jump through your code quite easily. Figure 18.13 shows the Call Stack window inside the Add method of the Calculator class.
Figure 18.13
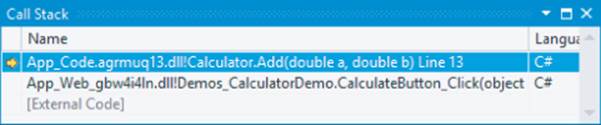
In the highlighted line, you can see that Calculator.Add is the currently active code. Right below it you see CalculateButton_Click, the event handler in the Calculator page that called the Add method. Double-clicking a line in the Call Stack window takes you to the appropriate code location. At the bottom you see [External Code], which refers to executed code that is not part of your website, such as executing code coming from the .NET Framework. To expand the [External Code] item to see what it contains, right-click the Call Stack window and choose Show External Code.
Immediate Window
The last interesting debugging window is the Immediate window. This window enables you to execute code as if you had written it in a page, for example. You can use this window to test expressions, see what values a function returns, and so on. For example, when you are in debug mode, you can enter the following command in the Immediate window:
VB.NET
? New Calculator().Add(3, 4)
C#
? new Calculator().Add(3, 4);
The question mark is used to output to the Immediate window. The code then instantiates a new Calculator instance and directly passes the values 3 and 4 to its Add method. The code is executed and the Add method returns 7, which is then printed in the Immediate window.
This window is great for quickly testing out code. Instead of writing code you want to test in a page, you can type it directly in the Immediate window and see its output.
In the following Try It Out, you see these debugging windows at work.
Try It Out: Extensive Debugging
In this exercise, you look at all the debugging windows that have been discussed earlier. Because a lot of windows and options are available, you won't see a detailed discussion of every step in the process. Instead, you're encouraged to experiment. Try adding more variables to the Watch window, type your own code in the Immediate window, and so on. Experimenting is the best way to discover the large number of debugging capabilities in VS.
1. If you're still in debug mode from the preceding exercise, press Shift+F5 or press the Stop button on the debugging toolbar. Open the Code Behind of CalculatorDemo.aspx again and press Ctrl+Shift+F9 to clear all previously set breakpoints in all code files. Click Yes to confirm the deletion.
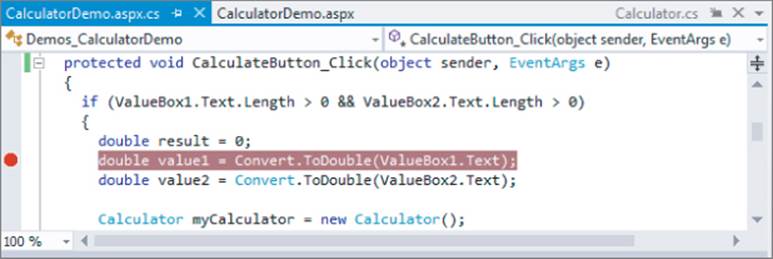
2. Click the line that declares the variable value1 and press F9 to set a breakpoint. Your Document Window should look similar to Figure 18.14, which shows the Document Window for the C# project.
Figure 18.14
3. Press F5 or choose Debug ⇒ Start Debugging from the main menu to start debugging the application. Enter the number 5 in the first text box, ensure that the plus sign is selected in the drop-down list, and enter 7 in the second text box. Then click the Calculate button, and VS breaks at the breakpoint you set in the previous step. If you aren't taken there automatically, switch back to VS manually.
4. Hover your mouse over the OperatorList variable that is used a few lines below the current breakpoint and notice how VS displays a data tip with a plus (+) symbol in front of it. This means you can expand the item to get detailed information about the variable. Figure 18.15 displays the expanded data tip for C#.
Figure 18.15
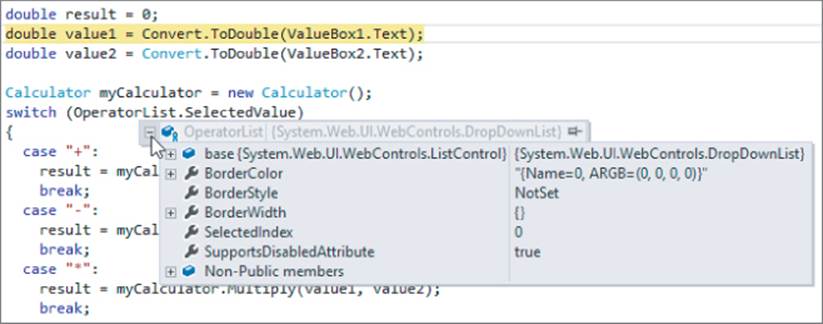
Note that you can expand other items such as the BorderWidth property. If you're using C#, you can also expand base to see the DropDownList control's base class's properties such as SelectedValue. With VB.NET, the properties of the base class have been merged into the main IntelliSense list so you'll see SelectedValue at the bottom of the list.
5. Right-click ValueBox1 in the code at the top that checks the length of the text in the TextBox controls and choose Add Watch. The variable is added to the Watch window where you can expand it, similar to how you expanded the data tip. Expand the item, scroll down in the list to theText property, and you'll see its value is set to “5".
6. Double-click the value "5" for the Text property, change it to “12” (including the quotes), and press Enter.
7. Open the Locals window (choose Debug ⇒ Windows ⇒ Locals if the window isn't visible yet.) Press F10 to execute the line under the breakpoint. This gets the value from ValueBox1, converts it to a double, and assigns it to value1. Look at the value1 variable in the Locals window (see Figure 18.16 that shows the window for the C# website). It now contains 12.0, the value you assigned to the Text property of the text box in the previous step, now converted to a double.
Note that the value of the value1 variable has changed color as well. This is done to indicate that the item has recently been changed. Also note that because all of this is happening at the server during a postback, the browser is unmodified, and the text box still shows the value 5. Only when the page has finished rendering to the browser will you see the new value show up.
Figure 18.16
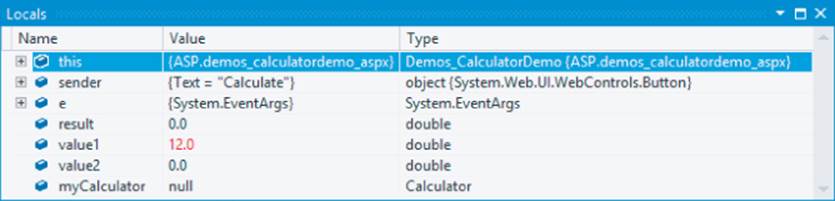
In Figure 18.16, you also see the other variables that are currently in scope, such as result, myCalculator, and this (Me in Visual Basic) that contains a reference to the page that is currently being executed.
8. Press F10 once more so value2 is updated as well. The color of the value of the value2 variable has changed to red to indicate it has changed, whereas value1's value is black again. This makes it easy to see what variables are modified by the last statement.
9. Press F10 until you reach the line that calls the Add method on the Calculator class. Instead of pressing F10 to execute that line, press F11. This steps into the Add method so you can see how it performs the calculation. Inside the Add method, you can hover over the method's arguments to see their values, as demonstrated in Figure 18.17.
Figure 18.17
10. Choose Debug ⇒ Windows ⇒ Call Stack to bring up the Call Stack window (or press Ctrl+Alt+C) and note that the Add method was called by the CalculateButton's Click handler, shown in Figure 18.18.
Figure 18.18
11. Double-click the second line in the Call Stack window and you are taken back to the Calculator page. The line that called the Add method is highlighted in green. Note that this doesn't execute any code; all it does is show you the relevant code. Double-click the first line and you are taken to the Add method code again.
12. Press Shift+F11 to step out of the Add method and return to the calling code in the Calculator page. If you take another look at the Call Stack window, you'll see the line for the Add method has disappeared from the call stack. At this point, the result variable does not have a value yet because the line of code hasn't been fully executed.
13. Open the Immediate Window (choose Debug ⇒ Windows ⇒ Immediate) to test out some code. In the window that appeared, type the following and press Enter:
VB.NET
? New Calculator().Multiply(4, 12)
C#
? new Calculator().Multiply(4, 12);
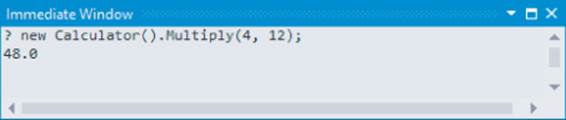
The Immediate window displays the outcome of the calculation, as shown in Figure 18.19.
Figure 18.19
14. Press F10 to finish executing the line with Calculate.Add. The yellow marker in the margin of the code editor jumps to the end of the Select Case / switch block. Drag the marker back to the line with Calculate.Add. This changes the line that is executed next so you can repeat part of the code that has already executed. You can then press F11 again to step into the Add method, or press F10 to execute the line directly.
15. Finally, press F5. This executes the remainder of the code in the page. The focus is put on the browser again, which now displays the outcome of the calculation in the Label control. If everything turned out as planned, you should see the number 19: the sum of 12 (the new value you entered for ValueBox1.Text in step 6), and 7 (which you entered in step 3).
How It Works
As demonstrated in a previous Try It Out exercise, when you put a breakpoint in your code, execution is halted as soon as the line with the breakpoint is about to be executed. From there, you can jump around in your code, investigate variables, and execute statements. In this exercise you saw how to step in and over code using the F10 and F11 shortcut keys. You usually use F10 to execute a line if you're not interested in seeing the underlying code that is being called. You use F11 if you want to see the code that is being executed, as you saw how to do with the Addmethod.
The data tips and Watch and Locals windows are invaluable tools in examining and changing variables and values. For example, even though you entered 5 in the first text box in the browser, you were able to change that value to 12 during debugging. Any changes you make while debugging are propagated to the rest of the code that still needs to be executed.
The Immediate window lets you try out small snippets of code. This can be useful to try out some ideas, without the need to write it in the code window and debug it. In this exercise, you wrote some code that created a new Calculator instance, called the Multiply method, and outputted the value using the question mark.
VB.NET
? New Calculator().Multiply(4, 12)
C#
? new Calculator().Multiply(4, 12);
Being able to change the line that is executed next by dragging the yellow arrow is very useful. This enables you to skip some code you may not want to run during a debugging session, or to repeat some code you want to see execute again (for example, after changing a variable's value).
Besides debugging code at the server, VS comes with excellent support for debugging client-side JavaScript as well.
Debugging Client-Side Script
So far, you have used the debugging tools to debug ASPX pages and Code Behind. However, that's not all there is to it. VS also has great support for debugging client-side JavaScript. Debugging client-side JavaScript requires that you use Internet Explorer and won't work correctly with other browsers like Firefox or Opera. The cool thing about debugging client-side JavaScript in VS is that you already know how to do it. You can use the same familiar tools that you have seen in this chapter to debug both server-side and client-side code.
The JavaScript that is eventually used by the page in the web browser can come from a lot of different sources. You can have JavaScript in external script files, embedded in the page, in a master page, and even server controls can emit their own JavaScript. This makes it difficult sometimes to break in the right code, because you don't always know where it comes from. Fortunately, VS has a great solution for this; it lets you set breakpoints in the final HTML being displayed in the browser. To show you in what file you're adding breakpoints or what code you are debugging, VS updates the Solution Explorer and displays a list of all files containing client-side script that you can step through as soon as you are in debug mode. Breakpoints you set in these files during debugging are preserved when possible, making debugging a smooth experience.
The easiest way to learn the new client-side JavaScript debugging possibilities is by trying them out, so the next exercise dives right in and shows you how to debug the web service test page that you created in Chapter 10.
Try It Out: Debugging JavaScript in Internet Explorer
You need to use Microsoft Internet Explorer to carry out the following exercise because most of the features shown in this Try It Out work only with that browser. If Internet Explorer is currently not your default browser in VS, you can choose your browser from the drop-down list next to the green Start Debugging arrow on the Standard toolbar.
1. If you're still in debug mode from the previous exercise, press Shift+F5 to stop debugging. Then open the NameService.cs or NameService.vb file from the App_Code folder. Locate the HelloWorld web method and set a breakpoint on the first and only line of code in the method that returns the personalized greeting. Close the file.
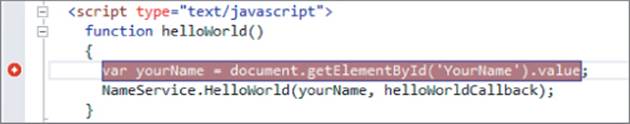
2. Open WebServices.aspx from the Demos folder in Markup View. Locate the helloWorld JavaScript method, click the line that declares the yourName variable, and press F9 to set a breakpoint, visible in Figure 18.20.
Figure 18.20
3. Press F5 to start debugging. The page loads in the browser and you get a text box and two buttons. Enter your name in the text box and click the Say Hello button. As soon as you click it, focus is put back on Visual Studio, and the code halts in the JavaScript code block.
COMMON MISTAKES
If your client-side JavaScript breakpoint doesn't get hit, close your browser to stop debugging, type the word debugger before the line you set the breakpoint on, and press F5 again. VS does not always correctly debug your client-side JavaScript breakpoints, but it works fine when using the debugger keyword:
debugger
var yourName = document.getElementById('YourName').value;
NameService.HelloWorld(yourName, helloWorldCallback);
Figure 18.21
4. Press F10 to execute the highlighted line (you need to press it twice if you're using the debugger keyword). The value in the text box is now assigned to the yourName variable. When you hover your mouse over that variable, a data tip appears.
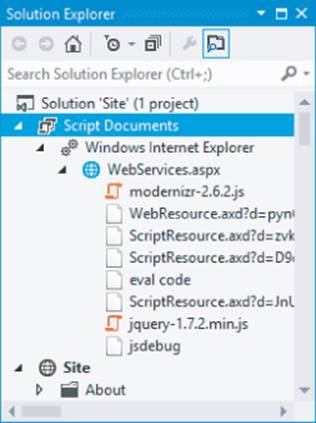
5. Open the other debugging windows and notice how they all behave identically to what you saw before. You can add JavaScript variables to the Watch window to look at their values, enter JavaScript in the Immediate window for evaluation, and so on. Also note that the Solution Explorer has changed, showing the active client-side files containing script right above the web project (see Figure 18.21).
6. To look inside these documents, you can double-click them under the Windows Internet Explorer node that has appeared in the Solution Explorer. The file WebServices.aspx should already be open in the Document Window. At first, the file may look like before. But if you look closely, you can see that this is no longer the original source file with ASP.NET controls mixed up with other markup, but the final HTML rendered in the browser. To warn you that you are looking at the final file, and not the original source, VS has added the text [dynamic] and a lock icon to the tab for the file above the Document Window, shown in Figure 18.22.
Figure 18.22
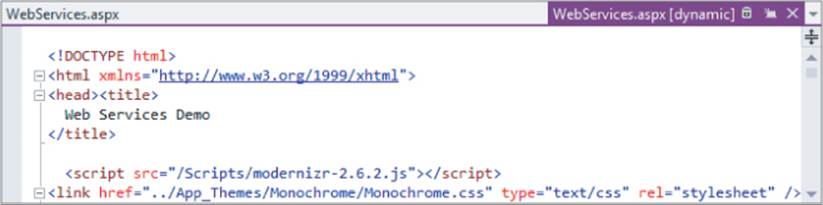
What's really nice about this is that even though you are looking at a runtime file, VS is still able to relate this runtime file with the original source. This means you can set breakpoints in the runtime file, and they'll be remembered in the original source so they are available for the next debugging session.
7. To see how this works, set a breakpoint on the line with the alert statement in the helloWorldCallback handler. Once the code returns from the web service that is being called in this exercise, you'll return to this handler again, so you can investigate the value returned by the service.
8. Press F5 to continue executing code. The name you entered in the text box is retrieved and then sent into the HelloWorld method of the service. Because you added a breakpoint there in step 1, the code should stop again, enabling you to look at the variable name passed to the web method. Although this exercise itself is pretty simple, a lot of magic just happened under the hood. You stepped from some client-side code running in the browser into code running in a web service at the server, all from the same IDE.
9. Press F5 again and you are taken back from the server-side web service into the client-side code where you can see the result of the web service in the helloWorldCallback handler.
10. Press F5 once more. The code completes and shows a JavaScript alert window with a greeting containing your name, just as it did in Chapter 10.
11. Close your browser, go back to VS again, and open the WebServices.aspx file by double-clicking it in the Solution Explorer. This opens the original source file, and not the dynamic version you saw in step 6 of this exercise. Locate the helloWorldCallback handler in theWebServices.aspx file. Note that the breakpoint you set in step 7 has been persisted.
How It Works
You have a few interesting points to take away from this exercise. First of all, you should understand the notion of dynamic files, or runtime files. These files are the final result from your ASPX pages and give you insight in the final HTML, CSS, and JavaScript that ends up in the browser. This is a great help, because it gives you a total view of all relevant content. Remember, the final markup displayed in the browser comes from a variety of resources, including master pages, content pages, external CSS and JavaScript files, and from the various server controls that live in your page. The ability to look at the combined result from a single location makes it easy to see how everything fits together.
Another important point to remember from this exercise is how the IDE offers you fully integrated debugging features, from the client-side code in the user interface, all the way up into the server. To make it easy to set breakpoints, VS doesn't restrict you to adding them in pages at design time only; instead, it also enables you to set them in the dynamic runtime files. When you stop debugging, VS tracks the new breakpoints for you, finds out to what source file they belong, and adds them there again for you, so they are available for the next debugging session.
Although you may not realize it because everything is taking place on the same computer and in the same IDE, you are crossing many boundaries when debugging like this. First, VS enables you to debug client-side script in the browser, so you can hook into that even before any data is sent to the server. When you press F5 in step 8, the code continues and sends the value to the server where it was used in the HelloWorld method of the NameService class. Once that server-side web method is done, execution returns to the client again, enabling you to break on the alertstatement that shows the message from the web service.
For some reason, debugging client-side JavaScript in VS 2012 doesn't always work. If you're encountering issues, remember the debugger keyword. Just add it before the line you want to break on and VS will halt execution when it encounters this keyword. Don't forget to remove thedebugger keyword again if you're done with debugging; otherwise, your browser will try to start a script debugger when it encounters this keyword, which is meaningless to most of your users.
So far you've been looking at debugging code. However, VS now has great support to diagnose the HTML of your page as well. You see how this works next.
Debugging with the Page Inspector
If you want to build a site that is easy to maintain, you probably make use of many of the features that ASP.NET and the browser offers. For example, you're probably using a master page for the general layout, you store page-specific content in a content page that uses that master page, you may have one or more user controls for content you reuse across your site (such as the Contact Form in the Planet Wrox website), and you may be using themes and skins to separate the design from the rest of your application.
In the browser, all of this code comes together as a single HTML source document that in turn includes references to external resources such as JavaScript and CSS files and images. Because it's a single file, it can be hard to debug that code and understand where a certain piece of HTML came from. In addition, because multiple CSS selectors can influence the layout of your page, it may be hard to track down the file in which a certain piece of CSS is defined. Using the Page Inspector, new to VS 2012, this now becomes much easier.
Introducing the Page Inspector
The Page Inspector is a diagnostics tool that runs inside Visual Studio and that brings a unified experience between your browser, the ASP.NET run time, and your source files. The Page Inspector comes with Visual Studio so you don't need to do anything to make use of it.
Although an upcoming exercise shows you many of the features that the Page Inspector offers, here's a quick description of how you can use it:
· You start the Page Inspector by choosing it as your target browser in the Debug Target drop-down on the Standard toolbar. You then start your site as you normally would using F5 or Ctrl+F5.
· The Page Inspector presents itself as a browser window in the IDE (so you can see what the page looks like), along with a number of tools windows to diagnose your code.
· Once loaded, you can use the Page Inspector's Inspect button to look at the various elements available in your page such as navigation elements, buttons, images, and more.
· While hovering over the elements in the Page Inspector, the code editor window is updated with a preview of the documents that contributed the HTML you're inspecting. As mentioned in the introduction of this section, this could be a master page, a content page, a user control, and so on.
· You can make changes to these documents in VS and then you can refresh the Page Inspector to see them show up in the final page.
· The Page Inspector also helps you find the CSS rules in your CSS files, whether they are defined in a theme's folder or in a custom folder.
If you've ever used Firebug (for Firefox) or the IE or Chrome Developer tools, some of this may sound familiar. These tools also enable you to inspect HTML elements in your page and look at the associated CSS. What makes the Page Inspector different and very special is that it is able to relate the final HTML back to the original ASP.NET source files. This in turn enables editing of the file in the IDE, making changes and previewing the results a breeze.
You get a good look at the Page Inspector and its feature set in the exercise in the next section.
Using the Page Inspector
Getting started with the Page Inspector is pretty simple. Because it ships with VS, it's ready for use. However, it has a few prerequisites. First of all, you need to have Internet Explorer 9 or later installed on your machine. Secondly, your site needs to run against .NET 4 or later. Because the Planet Wrox sample site runs against .NET 4.5, this is not a problem. Thirdly, the Page Inspector needs to be installed and registered correctly on your machine. Because this is done during installation of VS, this is not a problem either. The final prerequisite is that your site needs to be run in debug mode, or you need to add a special key to your Web.config to enable the Page Inspector. You enabled debugging for the Planet Wrox site earlier in this chapter, which means you don't have to do anything else for the Page Inspector to work correctly. For cases where you don't have debugging enabled and still want to use the Page Inspector, either enable debugging or add the following key to your Web.config in the appSettings element:
<appSettings>
<add key="PageInspector:ServerCodeMappingSupport" value="Enabled"/>
</appSettings>
If debugging is not enabled or this key is not present, VS gives you a warning when you invoke the Page Inspector and offers to fix the problem automatically for you by turning on debugging.
You see how to use the Page Inspector in the following exercise.
Try It Out: Using the Page Inspector to Diagnose your Site
In this exercise, you load a few pages into the Page Inspector and diagnose the underlying HTML. You see how to use the Inspect feature to find the originating source files and how to make changes to the code and refresh the Page Inspector. This should prepare you for cases where you need to hunt for a bug in your site.
1. If you're still in debug mode from the previous exercise, press Shift+F5 to stop debugging. Then close all open files and choose Page Inspector from the Target Browser drop-down on the Standard toolbar, shown in Figure 18.23.
Figure 18.23
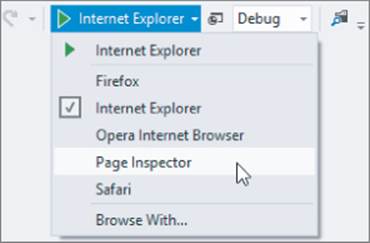
2. Press F5 or click the green arrow next to the Target Browser drop-down, shown in Figure 18.23. If you enabled debugging earlier, the Page Inspector should start without further messages. If you haven't enabled debugging earlier, follow the on-screen instructions to properly configure your site. After a few seconds, the Page Inspector is loaded in the Document Window in VS, as shown in Figure 18.24.
Figure 18.24
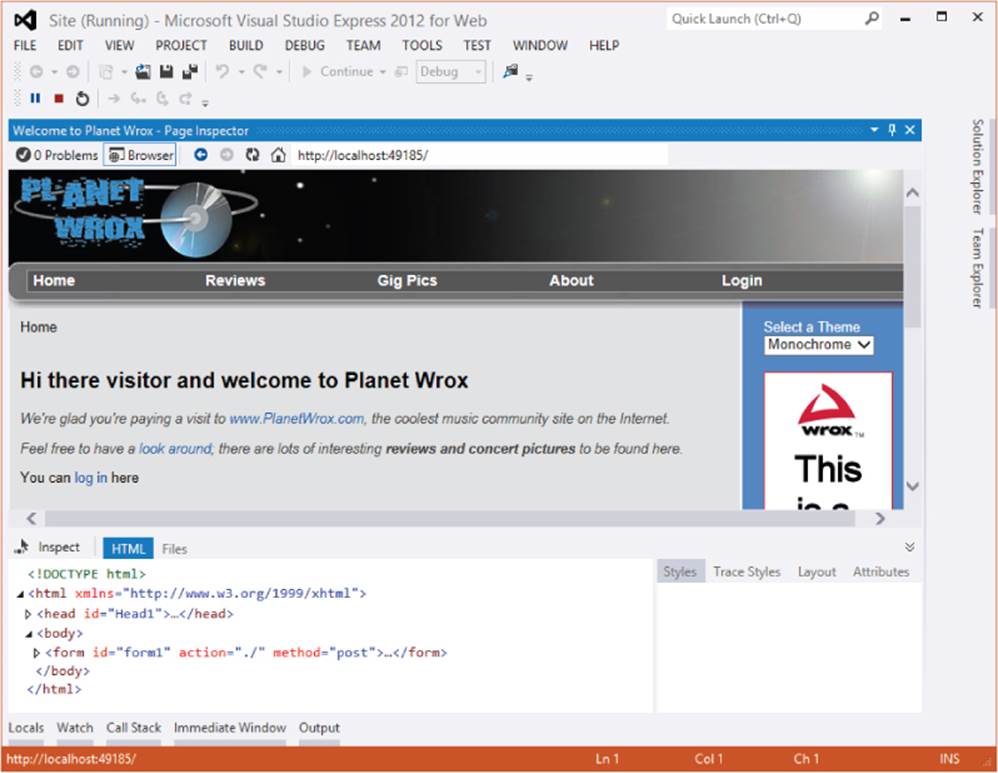
At the top left of the Page Inspector, you see two buttons labeled 0 Problems and Browser. The Browser view is currently active and shows the site as it would appear in your browser. The Problems button lets you diagnose any problems with the setup of the Page Inspector. If you have covered all prerequisites, the problem count should be zero and you can ignore this button. Otherwise, clicking the button shows you a list of problems and hints on fixing them.
The bottom of the screen is divided in two. The left half shows you the HTML for the page (indicated by the active HTML tab). The Inspect button enables you to point at elements in your page, as you see in a moment. The Files tab shows all server-side files that were used to render this page. For the homepage of the Planet Wrox site, these are Frontend.master (the master page), Default.aspx (the homepage), and Banner.ascx (the Banner user control in the Sidebar <aside>). Clicking any of these files opens them in the code editor side by side with the Page Inspector.
3. Click the Inspect button and then hover your mouse over elements in the page. When you do that, the code file that generated the element is shown side by side with the Page Inspector. For example, when you hover over the logo, the Frontend.master file appears. If you hover over the banner image, the Banner.ascx file is loaded, as shown in Figure 18.25.
Figure 18.25
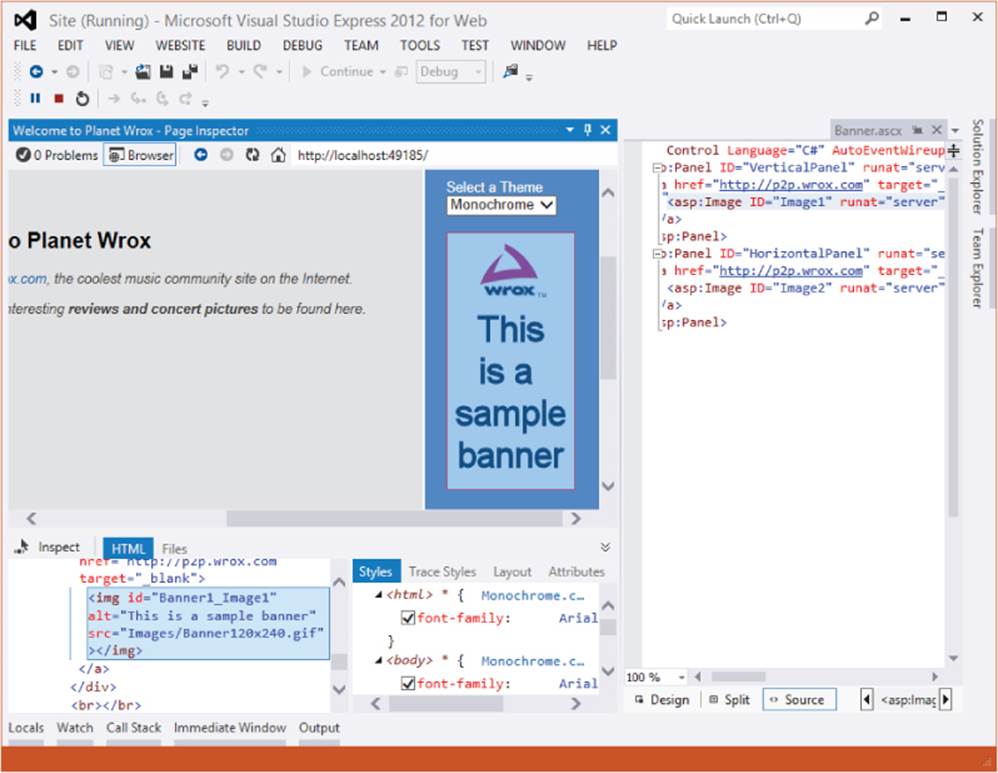
Not only is the correct file opened, but the active control is selected for you (the highlighted Image control in Figure 18.25) as well. In addition, in the client-side HTML at the bottom left, the img element is highlighted. This makes it super easy to see how it all fits together: the <img> in the browser came from an Image control in Banner.ascx. If you didn't know the source code of this site that well, finding this out without the Page Inspector would have been much more difficult. You had to diagnose the underlying HTML, find the <img> element, look for the control's idattribute, and then search the entire site in VS for the text Image1.
4. Click once on the <h1> element (with the text that welcomes the user). VS opens up Default.aspx in Preview mode (indicated by the tab with the page name at the right of the code editor) and correctly highlights the text. Make a change to the header text (for example, change “welcome to Planet Wrox” to “welcome to the Planet Wrox website”). Note that as soon as you start typing, the tab of the page in the code editor moves to the left side, taking the page out of Preview mode and into Edit mode. In addition, the Page Inspector now indicates that the source of the page has changed and that it needs to be reloaded to reflect those changes. This is indicated by a yellow bar above the page, shown in Figure 18.26.
Figure 18.26
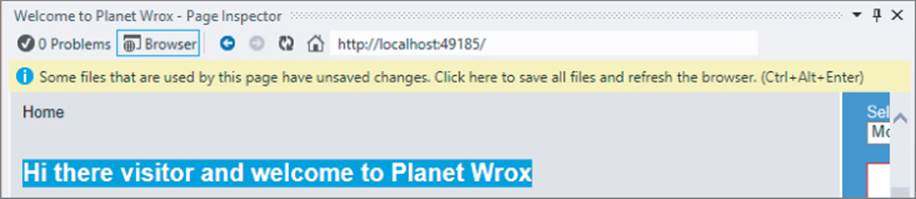
Click that bar, or press Ctrl+Alt+Enter. The page reloads and now shows the change you made to the page.
5. Look at the HTML for the page in the lower-left corner of the Page Inspector, and make a change. For example, change the page's title in the <head> section (you need to double-click the text in order to edit it) or change the text above the theme drop-down list. Changes you make here are not persisted in your source files, and only show up in the Page Inspector until you reload it.
6. Switch to the other theme using the drop-down list in the Sidebar. Notice how this “just works”; because the page runs in Internet Explorer, all client-side functionality, such as JavaScript and form posts, keep working as if the page was running in a normal browser.
7. Choose All Reviews from the TreeView or Menu and then click the link for one of the reviews to go to the details page.
8. Use the Inspect button and highlight the summary of the review. You may recall from an earlier exercise that you gave the summary label a CSS class called Summary, which you added to the theme's style sheet. The Page Inspector noticed that too, and, as illustrated in Figure 18.27, shows you the correct filename in the Styles tab below the Page Inspector. You need to scroll down in order to see the Summary class.
Figure 18.27
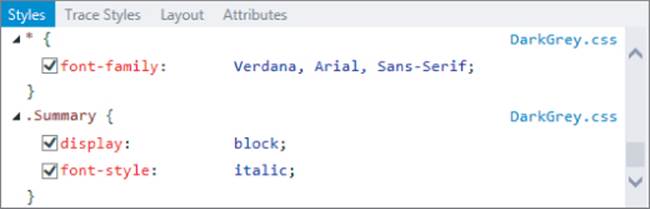
Click the .Summary selector (not the filename to the right) to open the CSS file that defines the .Summary selector. Its code gets highlighted automatically. Make a change to the .Summary selector, for example by adding a thin grey border to its bottom:
.Summary
{
font-style: italic;
display: block;
border-bottom: 1px solid Grey;
}
Just as with the change to the HTML you made, the Page Inspector sees the changes and enables you to refresh the page to see the changes. Click the yellow bar or press Ctrl+Alt+Enter to reload the updated stylesheet.
9. Click the Inspect button and highlight the summary in the text again. Switch to the Trace Styles tab, shown in Figure 18.28. Expand a few items such as font-size and font-style.
Figure 18.28
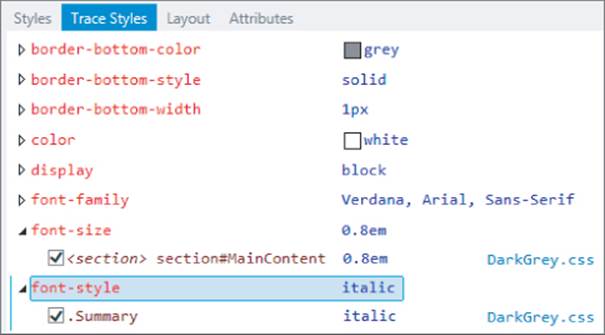
This screen shows you all the CSS rules that are currently in effect for the selected element. This makes it easy to see the CSS by which the element is styled and where that CSS came from. You can't make changes from this screen to your source files. You can, however, disable some of the rules to see how that affects the page. The changes you make are not persisted and only show up in the Page Inspector until you reload it or browse to another page.
The other two tabs (Layout and Attributes) show you the box model for the selected element and enable you to add additional attributes (a class attribute, for example) to the selected element.
10. To stop using the Page Inspector, click the Stop button on the toolbar. You can also press Shift+F5 if the Page Inspector is currently not the active window in the IDE.
How It Works
When you enable the Page Inspector, the .NET run time and the IDE keep track of which file or control contributes which HTML to the final page. It then uses that information to find the responsible file and highlight the relevant code in it when you inspect page elements in the Page Inspector. Changes you make to the source files are detected by the IDE so you can refresh the Page Inspector whenever it's needed.
Useful as debugging your code may be during the development of your site, it lacks the capability to investigate the behavior of your site while it's running in production. Fortunately, ASP.NET has a solution for that as well: tracing.
Tracing Your ASP.NET Web Pages
Without tracing, finding out the values of variables, objects, the execution path your code follows, and so on at run time is problematic at best. You would probably add a Label control to the page, and then write information to it like this:
VB.NET
Dim value2 As Double = Convert.ToDouble(ValueBox2.Text)
DebugLabel.Text &= “The value of value2 = “ & value2.ToString() & “<br />"
C#
double value2 = Convert.ToDouble(ValueBox2.Text);
DebugLabel.Text += “The value of value2 = “ + value2.ToString() + “<br />";
Although this certainly works, it's quite cumbersome. First, you need to write a lot of code to make this work. Secondly, you end up with an ugly Label control in your page that you shouldn't forget to remove when you're done with your debugging or tracing. And finally, when you're ready, you should remove all the code that sets the DebugLabel label. You could take the easy way out by setting the Label control's Visible property to False, but you would still take the performance hit of assigning the text to the Label control.
Tracing in ASP.NET solves all of these problems. It lets your pages, controls, and code write information to a central location, called the trace, which can then be shown in the browser. Tracing is built into the ASP.NET Framework, which means you can use it without any manual coding. Additionally, you can add your own information to the trace. In the following section, you see how to use the built-in tracing capabilities, giving you a wealth of information about your page. In a later exercise, you see how to add your own information to the trace.
Using the Standard Tracing Capabilities
Without much work, you can get a lot of good information about the way your pages execute. All you need to do is enable tracing for your pages. You can do this at the page level or at the site level. With tracing enabled at the page level, you can choose one or more specific pages you want to trace. Application-level tracing is useful if you want to look at multiple pages at the same time. This may help you, for example, to find slow pages in your website.
Tracing with Individual Pages
To enable tracing in a page, you need to set its Trace attribute in the Page directive to true:
<%@ Page ........ Trace="true" %>
When you run a trace-enabled page, you get a long list of details at the bottom of the page. Figure 18.29 shows the ASP.NET trace for the Calculator demo page you have been working with in this chapter.
Figure 18.29
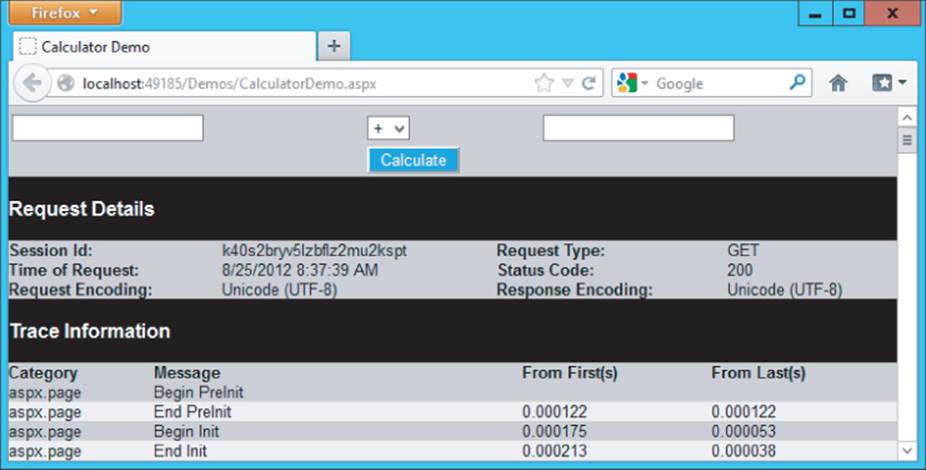
The trace provides a lot of details about your current page. At the top, you find a summary of the request details, including the current date and time, the method used to retrieve this page (GET or POST), and the status code (status 200 in Figure 18.29, to indicate success).
Below that, you see the Trace Information section. The ASP.NET Page class writes to the trace when you enable it. This is similar to the demo page you wrote in Chapter 15 that wrote to a Label control from the numerous events triggered during the page's life cycle. For each trace line you see a message, a category it's placed in, and two times. The first time column records the elapsed time in seconds since the first trace message was processed. The first trace message appears at the top of the list. The second time column records the elapsed time in seconds between processing of the current trace message and the preceding trace message.
By default, the data is sorted by time, putting the events in the order in which they occurred. You can also sort them on the category (more on categories in the section that deals with adding your own information to the trace) by changing the TraceMode from SortByTime to SortByCategory:
<%@ Page ........ Trace="true" TraceMode="SortByCategory" %>
A little further down the page (not visible in Figure 18.29), you see the control tree, which presents a hierarchical view of the controls in your page and their size.
Below the control tree, you see the details for a number of important collections, including the Query String, Cookies, Form, Headers, and Server Variables. Additionally, you see information you may have stored in Session or Application state. Being able to see these collections can be a great aid in figuring out a problem. For example, if you have a page that is supposed to read from a cookie, but that crashes and raises an exception as soon as the page loads, you can look at the Cookies collection and see if the page receives the data you expect. These collections are invaluable tools in understanding the execution of your page and can really aid in finding and fixing bugs in your code. In order for tracing to work when dealing with exceptions, you need to turn custom error pages off in the Web.config file. Refer to the section “Global Error Handling and Custom Error Pages” to learn more about custom error pages.
Page-level tracing means you need to enable tracing on every page you want to trace. It also means that you need to disable it on every page after you're done. Because this can be cumbersome in a large site, ASP.NET also enables you to trace the entire application.
Tracing the Entire Website
You can enable tracing for the entire website by changing trace settings in the Web.config file. You do this by creating a <trace /> element under <system.web>. The following table lists the most important attributes that the <trace /> element takes.
|
Attribute |
Description |
|
enabled |
Determines whether or not tracing is enabled for the application. By default, tracing is disabled, so you need to set this attribute to true explicitly. |
|
traceMode |
Determines the order in which items are sorted in the trace output. It works identically to the TraceMode attribute of the Page directive. |
|
requestLimit |
Determines the number of trace requests that ASP.NET keeps available. When the limit is hit, older trace records will be deleted automatically, leaving only recent trace requests available. |
|
pageOutput |
Specifies whether the trace information is displayed on the page. When set to false (the default), you can only access the tracing information using Trace.axd, which is discussed later. |
|
localOnly |
Specifies whether the special Trace.axd handler is accessible from the local host only. From a security point of view, you're best off to leave this set to true, which means the trace is not available to outside users. |
|
mostRecent |
Determines whether old trace records are discarded when the number of trace requests hits the requestLimit. When set to false, tracing is disabled automatically when the requestLimit is hit. |
When you have enabled tracing, you have two ways to read the trace information. When you have set pageOutput to true, the trace information is appended to each page, similar to what you saw with page-level tracing.
However, to make tracing less obtrusive, you can disable pageOutput and then request tracing information using a special file called Trace.axd. This is a virtual file, which means you won't find it in your website when you go looking for it. However, the ASP.NET run time knows it should provide you with tracing information when you request this special page. Although the file is virtual, you can still protect it using ASP.NET's URL security by adding a <location /> element to the main Web.config file as you've done with other file and folders.
You see how to enable tracing for the site in the following exercise.
Try It Out: Enabling Tracing for the Entire Site
In this Try It Out, you see how to enable site-wide tracing. First, you make a few changes to the Web.config file. You then browse your site, filling the trace log with your page requests. Finally, you request the special Trace.axd page to see the available trace log information.
1. Open Web.config and locate the opening <system.web> tag. As a direct child of that element, add the following configuration information to enable tracing:
<system.web>
<trace mostRecent="true" enabled="true" requestLimit="100" pageOutput="false"
localOnly="true" />
This enables the trace, but doesn't add its output to the page. Instead, you need to request the special Trace.axd page to see the trace information. Additionally, you make your system a little more secure by only allowing requests for the trace information from the local machine. Save and close Web.config.
2. Open the Target Browser drop-down on the Standard toolbar and switch back from the Page Inspector to your preferred browser. Then right-click Default.aspx in the Solution Explorer and choose View in Browser.
3. Click around the site, opening pages, changing the theme, filling in the contact form, and so on.
4. After you have requested at least five pages, change the address bar of your browser as follows so it requests the special Trace.axd page:
http://localhost:49394/Trace.axd
Your port number may be different, but it's important that you request the page Trace.axd on localhost. You should get a page similar to Figure 18.30. If the page is empty, press Ctrl+F5 to refresh it.
Figure 18.30
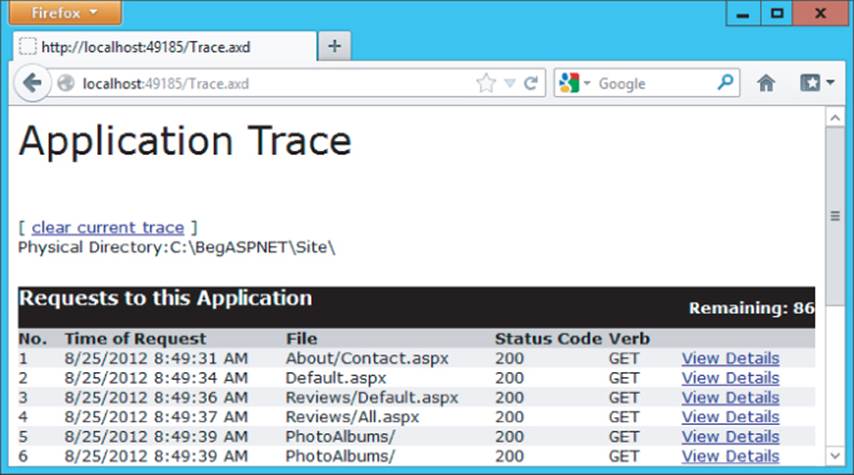
5. The list of traces is sorted based on time, from oldest to newest. Click the View Details link you see in Figure 18.30 for an ASPX page. You get a page similar to the one shown in Figure 18.29.
6. Disable tracing by setting the enabled attribute to false in the Web.config file, and then try requesting Trace.axd again. Notice that ASP.NET doesn't serve the page, but shows your error page instead.
How It Works
The ability to see trace information for pages that have been requested is extremely valuable. The information can help you understand the flow of information from and to a web page. For example, the trace information for the Contact.aspx page also shows the information that users have entered in the text box controls on the page. To see what this information looks like, click the View Details link for an item you want to zoom in on.
Although the information that ASP.NET traces for you automatically is extremely useful, you're not limited to just this information. You can also add your own information to the trace log.
Adding Your Own Information to the Trace
Adding your own data to the trace is useful if, for example, you want to see the value of a variable, or want to find out if a specific event fires, and when it fires exactly.
You can add information to the trace by using the Trace class. This class exposes two useful methods: Write and Warn. Both do pretty much the same thing: they add information to the trace that you can optionally put in a category you make up yourself. The only difference between Write andWarn is that messages written by Warn appear in red. You could use the Warn method for unexpected situations because the message will draw more attention.
In the following exercise, you see how simple it is to add your own information to the trace using the Warn and Write methods.
Try It Out: Adding Trace Data to Your Pages
In this Try It Out, you add some custom information to the ASP.NET trace. You use the Write method to write out trace information in a normal page execution, and use the Warn method for unexpected scenarios.
1. Open CalculatorDemo.aspx, switch to its Code Behind, and locate the Click handler for the Calculate button.
2. Right before the Select Case (VB.NET) or switch statement (C#), add the following Trace.Write call:
VB.NET
Trace.Write(String.Format("Performing the calculation with the {0} operator",
OperatorList.SelectedValue))
Select Case OperatorList.SelectedValue
C#
Trace.Write(string.Format("Performing the calculation with the {0} operator",
OperatorList.SelectedValue));
switch (OperatorList.SelectedValue)
3. Near the bottom of the event handler, modify the Else statement for the check that ensures that both TextBox controls contain a value:
VB.NET
Else
Result.Text = String.Empty
Trace.Warn("Custom Category",
"TextBox controls are empty; time to add Validation controls?")
End If
C#
else
{
Result.Text = string.Empty;
Trace.Warn("Custom Category",
"TextBox controls are empty; time to add Validation controls?");
}
4. Enable tracing for this page explicitly. You can do this by setting the Trace attribute of the Page directive in Markup View:
<%@ Page Title="Calculator Demo" ... Trace="true" %>
5. Save all your changes and request the Calculator page in the browser by pressing Ctrl+F5. Enter two numbers and click the Calculate button. Note that your custom information is added to the trace, between the Begin Raise PostBackEvent and End Raise PostBackEvent trace entries even though tracing is disabled at the site level. Note also that the text is black, and has no category assigned.
6. Clear the text from both TextBox controls in the browser and click the Calculate button again. The trace information should now be easier to spot because of its different color and own category name, as shown in Figure 18.31.
Figure 18.31
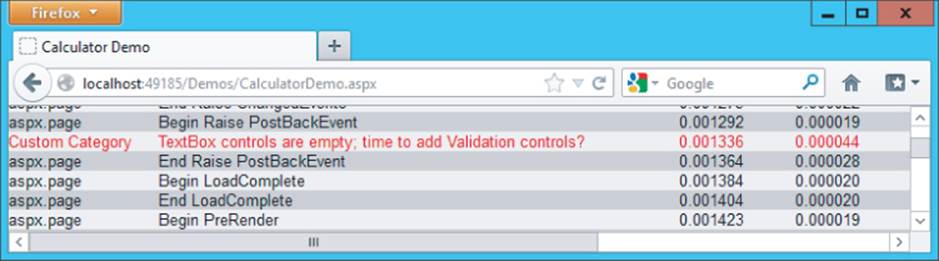
7. Go back to VS once more and disable tracing for the Calculator page by setting the Trace attribute of the Page directive to false. Save your changes and request the page again. Note that the page still functions correctly, but no longer outputs the trace information.
How It Works
The Write and Warn methods of the Trace class enable you to write additional information to the trace. The ASP.NET run time keeps track of the information and displays it together with the rest of the trace info, either directly at the bottom of the page in the browser with page-level tracing, or through the special Trace.axd page you saw earlier.
The Write and Warn methods each have three overloads. The first one (shown only with Write in the previous example) accepts a single string that is displayed in the Message column. The second overload also accepts a category name as demonstrated with the Warn method. The final overload, not shown in the Try It Out exercise, also accepts an Exception object whose message will be added to the trace output. This is useful to trace the information of an exception in a Catch block.
Tracing and Performance
Although it may seem that leaving Warn and Write statements in your code on your production system may hurt performance, this isn't the case. Because you can disable tracing in the Web.config file by setting the enabled property of the trace element to false, you greatly minimize the performance overhead of tracing.
A Security Warning
Tracing can be very useful, but leaving trace information in your production environment can lead to information disclosure. Therefore, you should always either disable tracing by setting its enabled attribute in Web.config to false, or at least by setting the localOnly attribute to true. In Chapter 19, you learn a trick that enables you to make this change for all sites on your production server, making it easy to block access to the trace functionality.
Practical Debugging Tips
The following list provides some practical tips to help you debug your application:
· Never leave debug="true" in the Web.config file in a production environment. Always set it to false to improve performance. In Chapter 19, you see an even better solution to ensure this setting is never set to true on a production server.
· Try to avoid swallowing exceptions in a Catch block. You may be tempted to wrap your code in a Try/Catch block and then leave the entire Catch block empty. Although this certainly avoids exceptions showing up in the user interface, it makes debugging extremely difficult. Because you are no longer aware a problem occurs, you also cannot write code to prevent the error from happening in the first place. The general rule here is: Catch errors that you can handle successfully, for example by displaying a message to the user. If you can't handle the exception in your code, let it bubble up and log it in the Application_Error event handler so you know that the exception occurred.
· If you need to re-throw an exception in a Catch block, don't use Throw ex (throw ex in C#), but use Throw (throw in C#) only. When you use Throw ex, you make it difficult to track the path the code has followed before the exception occurred, but by using Throw you maintain this information. Here's the code showing both options:
VB.NET
Try
...
Catch ex As Exception
‘ Do something with the error here, such as logging it
Throw ex ‘ Bad example; you lose track of the source of the exception
Throw ‘ Good example; forwards the exception
‘ and maintains the call stack
End Try
C#
try
{
...
}
catch (Exception ex)
{
// Do something with the error here, such as logging it
throw ex; // Bad example; you lose track of the source of the exception
throw; // Good example; forwards the exception
// and maintains the call stack
}
· Try to avoid exception handling when possible. As you saw in this chapter, it's much better (and faster) to simply avoid an exception in the first place. For example, you can easily avoid the DivideByZeroException exception by checking for a value of zero before carrying out the division.
· Be as explicit as possible with the Exception types you catch in Try/Catch blocks. Try to avoid catching generic Exception types and set up multiple, explicit Catch blocks for each specific type you anticipate.
Summary
No matter how carefully you program, your site is likely to contain some bugs or throw exceptions at run time. To minimize these exceptions and build a site that runs as smoothly as possible, you can do a number of things.
First of all, you can use exception-handling techniques, where you write code that is able to catch exceptions that you foresee and handle them appropriately.
To help you write code with as few bugs as possible, VS offers you a great set of debugging tools. The ability to break into your code and analyze and change the execution environment from client-side code all the way into the server is a great aid in your bug-slashing adventures.
Even if you have debugged your application thoroughly, there's still a chance your site may have issues in production, whether they are related to performance, logic errors, or other unexpected reasons. In those cases, you can use the ASP.NET tracing facilities that let you track information about running pages. Analyzing this trace information can bring you a long way in fixing the underlying issues.
Now that your website is complete and hopefully bug-free, the next step is to put it online. You see how to deploy your ASP.NET website in the next chapter.
Exercises
1. What's the difference between debugging and tracing?
2. Imagine you have some code that could potentially throw an exception. For example, you try to send an e-mail message to a mail server. What kind of exception-handling strategy would you use to avoid the exception from being displayed in the browser? What code would you need?
3. You're taking over a website that has been built by another developer who had never heard of exception handling. Your client is complaining about the quality of the site and the large number of “Yellow Screens of Death” that users see. Besides analyzing the code for the entire application, what would be a quick solution to get information about the errors and the locations where they occur? And how can you shield the site's users from the dirty details of the exception messages?
You can find answers to these exercises in Appendix A.
What You Learned in this Chapter
|
Breakpoint |
A marker you can set in your code to indicate where you want the debugger to halt at run time |
|
Data tips |
Tooltips that present simple or rich data about variables during debugging |
|
Debugging |
The process of finding and fixing bugs in your code |
|
Exception |
The .NET term for an error that may occur in your code |
|
Exception handling |
A methodology to identify and handle errors that occur at run time |
|
Stack trace |
A visual representation of the current stack of code calls |
|
Trace |
Enables ASP.NET controls and your own custom code to write information to a central log location at run time |
All materials on the site are licensed Creative Commons Attribution-Sharealike 3.0 Unported CC BY-SA 3.0 & GNU Free Documentation License (GFDL)
If you are the copyright holder of any material contained on our site and intend to remove it, please contact our site administrator for approval.
© 2016-2026 All site design rights belong to S.Y.A.