Programming in C (Fourth Edition) (2015)
17. Debugging Programs
This chapter teaches you two techniques you can use to debug your programs. One involves using the preprocessor to allow for the conditional inclusion of debugging statements in your program. The other technique involves the use of an interactive debugger. In this chapter, you are introduced to a popular debugger called gdb. Even if you use a different debugger (such as dbx, or one built in to an IDE tool), it is likely that your debugger will have similarities to gdb.
Again, as discussed in the opening of Chapter 14, “Working with Larger Programs,” some of the topics covered in this chapter may not seem applicable to you depending on the operating system and development environment you use, but the concepts are important and universal.
Debugging with the Preprocessor
As noted in Chapter 12, “The Preprocessor,” conditional compilation is useful when debugging programs. The C preprocessor can be used to insert debugging code into your program. By appropriate use of #ifdef statements, the debugging code can be enabled or disabled at your discretion. Program 17.1 is a program (admittedly contrived) that reads in three integers and prints out their sum. Note that when the preprocessor identifier DEBUG is defined, the debugging code (which prints to stderr) is compiled with the rest of the program, and when DEBUG isn’t defined, the debugging code is left out.
Program 17.1 Adding Debug Statements with the Preprocessor
#include <stdio.h>
#define DEBUG
int process (int i, int j, int k)
{
return i + j + k;
}
int main (void)
{
int i, j, k, nread;
nread = scanf ("%d %d %d", &i, &j, &k);
#ifdef DEBUG
fprintf (stderr, "Number of integers read = %i\n", nread);
fprintf (stderr, "i = %i, j = %i, k = %i\n", i, j, k);
#endif
printf ("%i\n", process (i, j, k));
return 0;
}
Program 17.1 Output
1 2 3
Number of integers read = 3
i = 1, j = 2, k = 3
6
Program 17.1 Output (Rerun)
1 2 e
Number of integers read = 2
i = 1, j = 2, k = 0
3
Note that the value displayed for k can be anything because its value was not set by the scanf() call and it was not initialized by the program.
The statements
#ifdef DEBUG
fprintf (stderr, "Number of integers read = %i\n", nread);
fprintf (stderr, "i = %d, j = %d, k = %d\n", i, j, k);
#endif
are analyzed by the preprocessor. If the identifier DEBUG has been previously defined (#ifdef DEBUG), the preprocessor sends the statements that follow up to the #endif (the two fprintf() calls) to the compiler to be compiled. If DEBUG hasn’t been defined, the twofprintf() calls never make it to the compiler (they’re removed from the program by the preprocessor). As you can see, the program prints out messages after it reads in the integers. The second time the program is run, an invalid character is entered (e). The debugging output informs you of the error. Note that to turn off the debugging code, all you have to do is remove (or comment out) the line
#define DEBUG
and the fprintf() statements are not compiled with the rest of the program. Although this program is so short you might not feel it’s worth the bother, consider how easy it is to turn debugging code on and off in a program several hundreds of lines long by simply changing one line.
You can even control the debugging from the command line when the program is compiled. If you’re using gcc, the command
gcc –D DEBUG debug.c
compiles the file debug.c, defining the preprocessor variable DEBUG for you. This is equivalent to putting the following line in your program:
#define DEBUG
Take a look at a slightly longer program. Program 17.2 takes up to two command-line arguments. Each of these is converted into an integer value and is assigned to the corresponding variables arg1 and arg2. To convert the command-line arguments into integers, the standard library function atoi() is used. This function takes a character string as its argument and returns its corresponding representation as an integer. The atoi() function is declared in the header file <stdlib.h>, which is included at the beginning of Program 17.2.
After processing the arguments, the program calls the process() function, passing the two command-line values as arguments. This function simply returns the product of these two arguments. As you can see, when the DEBUG identifier is defined, various debugging messages are printed, and when it isn’t defined, only the result is printed.
Program 17.2 Compiling in Debug Code
#include <stdio.h>
#include <stdlib.h>
int process (int i1, int i2)
{
int val;
#ifdef DEBUG
fprintf (stderr, "process (%i, %i)\n", i1, i2);
#endif
val = i1 * i2;
#ifdef DEBUG
fprintf (stderr, "return %i\n", val);
#endif
return val;
}
int main (int argc, char *argv[])
{
int arg1 = 0, arg2 = 0;
if (argc > 1)
arg1 = atoi (argv[1]);
if (argc == 3)
arg2 = atoi (argv[2]);
#ifdef DEBUG
fprintf (stderr, "processed %i arguments\n", argc - 1);
fprintf (stderr, "arg1 = %i, arg2 = %i\n", arg1, arg2);
#endif
printf ("%i\n", process (arg1, arg2));
return 0;
}
Program 17.2 Output
$ gcc –D DEBUG p18-2.c Compile with DEBUG defined
$ a.out 5 10
processed 2 arguments
arg1 = 5, arg2 = 10
process (5, 10)
return 50
50
Program 17.2 Output (Rerun)
$ gcc p18-2.c Compile without DEBUG defined
$ a.out 2 5
10
When the program is ready for distribution, the debugging statements can be left in the source file without affecting the executable code, as long as DEBUG isn’t defined. If a bug is found at some later time, the debugging code can be compiled in and the output examined to see what’s happening.
The previous method is still rather clumsy because the programs themselves tend to be difficult to read. One thing you can do is change the way the preprocessor is used. You can define a macro that can take a variable number of arguments to produce your debugging output:
#define DEBUG(fmt, ...) fprintf (stderr, fmt, __VA_ARGS__)
and use it instead of fprintf as follows:
DEBUG ("process (%i, %i)\n", i1, i2);
This gets evaluated as follows:
fprintf (stderr, "process (%i, %i)\n", i1, i2);
The DEBUG macro can be used throughout a program, and the intent is quite clear, as shown in Program 17.3.
Program 17.3 Defining a DEBUG Macro
#include <stdio.h>
#include <stdlib.h>
#define DEBUG(fmt, ...) fprintf (stderr, fmt, __VA_ARGS__)
int process (int i1, int i2)
{
int val;
DEBUG ("process (%i, %i)\n", i1, i2);
val = i1 * i2;
DEBUG ("return %i\n", val);
return val;
}
int main (int argc, char *argv[])
{
int arg1 = 0, arg2 = 0;
if (argc > 1)
arg1 = atoi (argv[1]);
if (argc == 3)
arg2 = atoi (argv[2]);
DEBUG ("processed %i arguments\n", argc - 1);
DEBUG ("arg1 = %i, arg2 = %i\n", arg1, arg2);
printf ("%d\n", process (arg1, arg2));
return 0;
}
Program 17.3 Output
$ gcc pre3.c
$ a.out 8 12
processed 2 arguments
arg1 = 8, arg2 = 12
process (8, 12)
return 96
96
As you can see, the program is much more readable in this form. When you no longer need debugging output, simply define the macro to be nothing:
#define DEBUG(fmt, ...)
This tells the preprocessor to replace calls to the DEBUG macro with nothing, so all uses of DEBUG simply turn into null statements.
You can expand on the notion of the DEBUG macro a little further to allow for both compile-time and execution-time debugging control: Declare a global variable Debug that defines a debugging level. All DEBUG statements less than or equal to this level produce output. DEBUG now takes at least two arguments; the first is the level:
DEBUG (1, "processed data\n");
DEBUG (3, "number of elements = %i\n", nelems)
If the debugging level is set to 1 or 2, only the first DEBUG statement produces output; if the debugging level is set to 3 or more, both DEBUG statements produce output. The debugging level can be set via a command-line option at execution time as follows:
a.out –d1 Set debugging level to 1
a.out -d3 Set debugging level to 3
The definition for DEBUG is straightforward:
#define DEBUG(level, fmt, ...) \
if (Debug >= level) \
fprintf (stderr, fmt, __VA_ARGS__)
So
DEBUG (3, "number of elements = %i\n", nelems);
becomes
if (Debug >= 3)
fprintf (stderr, "number of elements = %i\n", nelems);
Again, if DEBUG is defined to be nothing, the DEBUG calls become null statements.
The following definition provides all the mentioned features, as well as the ability to control the definition of DEBUG at compile time.
#ifdef DEBON
# define DEBUG(level, fmt, ...) \
if (Debug >= level) \
fprintf (stderr, fmt, __VA_ARGS__)
#else
# define DEBUG(level, fmt, ...)
#endif
When compiling a program containing the previous definition (which you can conveniently place inside a header file and include in your program), you either define DEBON or not. If you compile prog.c as follows:
$ gcc prog.c
it compiles in the null definition for DEBUG based on the #else clause shown in the previous preprocessor statements. On the other hand, if you compile your program like this:
$ gcc –D DEBON prog.c
the DEBUG macro that calls fprintf based on the debug level is compiled in with the rest of your code.
At runtime, if you have compiled in the debugging code, you can select the debug level. As noted, this can be done with a command-line option as follows:
$ a.out –d3
Here, the debug level is set to 3. Presumably, you would process this command-line argument in your program and store the debug level in a variable (probably global) called Debug. And in this case, only DEBUG macros that specify a level of 3 or greater cause the fprintf calls to be made.
Note that a.out -d0 sets the debugging level to zero and no debugging output is generated even though the debugging code is still in there.
To summarize, you have seen here a two-tiered debugging scheme: Debugging code can be compiled in or out of the code, and when compiled in, different debugging levels can be set to produce varying amounts of debugging output.
Debugging Programs with gdb
gdb is a powerful interactive debugger that is frequently used to debug programs compiled with GNU’s gcc compiler. It allows you to run your program, stop at a predetermined location, display and/or set variables, and continue execution. It allows you to trace your program’s execution and even execute it one line at a time. gdb also has a facility for determining where core dumps occur. A core dump occurs due to some abnormal event, possibly division by zero or attempts to access past the end of an array. This results in the creation of a file named core that contains a snapshot of the contents of the process’s memory at the time it terminated.1
1. Your system might be configured to disable the automatic creation of this core file, often due to the large size of these files. Sometimes, this has to do with the maximum file creation size, which can be changed with the ulimit command.
Your C program must be compiled with the gcc compiler using the -g option to make full use of gdb’s features. The -g option causes the C compiler to add extra information to the output file, including variable and structure types, source filenames, and C statement to machine code mappings.
Program 17.4 shows a program that attempts to access elements past the end of an array.
Program 17.4 A Simple Program for Use with gdb
#include <stdio.h>
int main (void)
{
const int data[5] = {1, 2, 3, 4, 5};
int i, sum;
for (i = 0; i >= 0; ++i)
sum += data[i];
printf ("sum = %i\n", sum);
return 0;
}
Here’s what happens when the program is run on a Mac OS X system from a terminal window (on other systems you might get a different message displayed when you run the program):
$ a.out
Segmentation fault
Use gdb to try to track down the error. This is certainly a contrived example; nevertheless, it is illustrative.
First, make sure you compile the program with the –g option. Then, you can start up gdb on the executable file, which is a.out by default. This might result in lines of introductory messages being displayed on your system:
$ gcc –g p18.4.c Recompile with debugging information for gdb
$ gdb a.out Start up gdb on the executable file
GNU gdb 5.3-20030128 (Apple version gdb-309) (Thu Dec 4 15:41:30 GMT 2003)
Copyright 2003 Free Software Foundation, Inc.
GDB is free software, covered by the GNU General Public License, and you are
welcome to change it and/or distribute copies of it under certain conditions.
Type "show copying" to see the conditions.
There is absolutely no warranty for GDB. Type "show warranty" for details.
This GDB was configured as "powerpc-apple-darwin".
Reading symbols for shared libraries .. done
When gdb is ready to accept commands, it displays a (gdb) prompt. In our simple example, you’re simply telling it to run your program by entering the run command. This causes gdb to start execution of your program until it finishes or an abnormal event occurs:
(gdb) run
Starting program: /Users/stevekochan/MySrc/c/a.out
Reading symbols for shared libraries . done
Program received signal EXC_BAD_ACCESS, Could not access memory.
0x00001d7c in main () at p18-4.c:9
9 sum += data[i];
(gdb)
So your program receives an error (as it did before), but it still remains under the control of gdb. That’s the nice part because now you can see what it was doing when the error occurred as well as look at the values of variables at the time of the error.
As you can see from the previous display, the program tried to perform an invalid memory access at line 9 in your program. The actual line in question is automatically displayed from your source file. To gain a little context around that line, you can use the list command, which displays a window of 10 lines around the specified line (5 lines before and 4 lines after):
(gdb) list 9
4 {
5 const int data[5] = {1, 2, 3, 4, 5};
6 int i, sum;
7
8 for (i = 0; i >= 0; ++i)
9 sum += data[i];
10
11 printf ("sum = %i\n", sum);
12
13 return 0;
(gdb)
You can look at variables by using the print command. Take a look at what the value of sum was at the time the program stopped with an error:
(gdb) print sum
$1 = -1089203864
This value for sum is obviously out of whack (and on your system might differ from what’s shown here). The $n notation is used by gdb to keep track of the values you’ve previously displayed, so you can easily reference them again later.
Take a look at what the index variable i is set to:
(gdb) print i
$2 = 232
Oops! That’s not good. You have only five elements in the array and you tried to access the 233rd element when the error occurred. On your system, the error might occur earlier or later. But eventually, you should get an error.
Before you exit from gdb, look at another variable. See how nicely gdb deals with variables like arrays and structures:
(gdb) print data Show the contents of the data array
$3 = {1, 2, 3, 4, 5}
(gdb) print data[0] Show the value of the first element
$4 = 1
You’ll see an example of a structure a little later. To complete this first example with gdb, you need to learn how to get out. You can do that with the quit command:
(gdb) quit
The program is running. Exit anyway? (y or n) y
$
Even though the program had an error, technically speaking, it was still active inside gdb; the error merely caused your program’s execution to be suspended, but not terminated. That’s the reason gdb asked for confirmation about quitting.
Working with Variables
gdb has two basic commands that allow you to work with variables in your program. One you’ve seen already is print. The other allows you to set the value of a variable. This is done with the set var command. The set command actually takes a number of different options, but varis the one you want to use to assign a value to a variable:
(gdb) set var i=5
(gdb) print i
$1 = 5
(gdb) set var i=i*2 You can write any valid expression
(gdb) print i
$2 = 10
(gdb) set var i=$1+20 You can use so-called "convenience variables"
(gdb) print i
$3 = 25
A variable must be accessible by the current function, and the process must be active, that is, running. gdb maintains an idea of a current line (like an editor), a current file (the source file of the program), and a current function. When gdb starts up without a core file, the current function ismain(), the current file is the one that contains main(), and the current line is the first executable line in main(); otherwise, the current line, file, and procedure are set to the location where the program aborted.
If a local variable with the specified name doesn’t exist, gdb looks for an external variable of the same name. In the previous example, the function executing at the time the invalid access occurred was main(), and i was a variable local to main.
A function can be specified as part of the variable name in the form function::variable to reference a variable local to a specific routine, for example,
(gdb) print main::i Display contents of i in main
$4 = 25
(gdb) set var main::i=0 Set value of i in main
Note that attempting to set a variable in an inactive function (that is, a function that is not either currently executing or waiting for another function to return to continue its own execution) is an error and results in the following message:
No symbol "var" in current context.
Global variables can be directly referenced as 'file'::var. This forces gdb to access an external variable as defined in the file file and ignore any local variable of the same name in the current function.
Structure and union members can be accessed using standard C syntax. If datePtr is a pointer to a date structure, print datePtr->year prints the year member of the structure pointed to by datePtr.
Referencing a structure or union without a member causes the contents of the entire structure or union to be displayed.
You can force gdb to display a variable in a different format, for example hexadecimal, by following the print command with a / and a letter that specifies the format to use. Many gdb commands can be abbreviated with a single letter. In the following example, the abbreviation for theprint command, which is p, is used:
(gdb) set var i=35 Set i to 3
(gdb) p /x i Display i in hexadecimal
$1 = 0x23
Source File Display
gdb provides several commands that give you access to the source files. This enables you to debug the program without having to reference a source listing or open your source files in other windows.
As mentioned earlier, gdb maintains an idea of what the current line and file are. You’ve seen how you can display the area around the current line with the list command, which can be abbreviated as l. Each time you subsequently type the list command (or more simply, just press theEnter or Return key), the next 10 lines from the file are displayed. This value of 10 is the default and can be set to any value by using the listsize command.
If you want to display a range of lines, you can specify the starting and ending line numbers, separated by a comma, as follows:
(gdb) list 10,15 List lines 10 through 15
Lines from a function can be listed by specifying the function’s name to the list command:
(gdb) list foo Display lines for function foo
If the function is in another source file, gdb automatically switches to that file. You can find the name of the current source file being displayed with gdb by typing in the command info source.
Typing a + after the list command causes the next 10 lines from the current file to be displayed, which is the same action that occurs if just list is typed. Typing a – causes the previous 10 lines to be displayed. Both the + and – options can also be followed by a number to specify a relative offset to be added or subtracted from the current line.
Controlling Program Execution
Displaying lines from a file doesn’t modify the way a program is executed. You must use other commands for that. You’ve seen two commands that control the execution of a program in gdb: run, which runs the program from the beginning, and quit, which terminates execution of the current program.
The run command can be followed by command-line arguments and/or redirection (< or >), and gdb handles them properly. Subsequent use of the r command without any arguments reuses the previous arguments and redirection. You can display the current arguments with the commandshow args.
Inserting Breakpoints
The break command can be used to set breakpoints in your program. A breakpoint is just as its name implies—a point in your program that, when reached during execution, causes the program to “break” or pause. The program’s execution is suspended, which allows you to do things such as look at variables and determine precisely what’s going on at the point.
A breakpoint can be set at any line in your program by simply specifying the line number to the command. If you specify a line number but no function or filename, the breakpoint is set on that line in the current file; if you specify a function, the breakpoint is set on the first executable line in that function.
(gdb) break 12 Set breakpoint on line 12
Breakpoint 1 at 0x1da4: file mod1.c, line 12.
(gdb) break main Set breakpoint at start of main
Breakpoint 2 at 0x1d6c: file mod1.c, line 3.
(gdb) break mod2.c:foo Breakpoint in function foo in file mod2.c
Breakpoint 3 at 0x1dd8: file mod2.c, line 4.
When a breakpoint is reached during program execution, gdb suspends execution of your program, returns control to you, and identifies the breakpoint and the line of your program at which it stopped. You can do anything you want at that point: You can display or set variables, set or unset breakpoints, and so on. To resume execution of the program, you can simply use the continue command, which can be abbreviated as simply c.
Single Stepping
Another useful command for controlling program execution is the step command, which can be abbreviated as s. This command single steps your program, meaning that one line of C code in your program is executed for each step command you enter. If you follow the step command with a number, then that many lines are executed. Note that a line might contain several C statements; however, gdb is line oriented, and executes all statements on a line as a single step. If a statement spans several lines, single stepping the first line of the statement causes all the lines of the statement to be executed. You can single step your program at any time that a continue is appropriate (after a signal or breakpoint).
If the statement contains a function call and you step, gdb takes you into the function (provided it’s not a system library function; these are typically not entered). If you use the next command instead of step, gdb makes the function call and does not step you into it.
Try some of gdb’s features on Program 17.5, which otherwise serves no useful purpose.
Program 17.5 Working with gdb
#include <stdio.h>
#include <stdlib.h>
struct date {
int month;
int day;
int year;
};
struct date foo (struct date x)
{
++x.day;
return x;
}
int main (void)
{
struct date today = {10, 11, 2014};
int array[5] = {1, 2, 3, 4, 5};
struct date *newdate, foo ();
char *string = "test string";
int i = 3;
newdate = (struct date *) malloc (sizeof (struct date));
newdate->month = 11;
newdate->day = 15;
newdate->year = 2014;
today = foo (today);
free (newdate);
return 0;
}
In the sample session for Program 17.5, your output might be slightly different, depending on which version and on what system you are running gdb.
Program 17.5 gdb Session
$ gcc -g p18-5.c
$ gdb a.out
GNU gdb 5.3-20030128 (Apple version gdb-309) (Thu Dec 4 15:41:30 GMT 2003)
Copyright 2003 Free Software Foundation, Inc.
GDB is free software, covered by the GNU General Public License, and you are
welcome to change it and/or distribute copies of it under certain conditions.
Type "show copying" to see the conditions.
There is absolutely no warranty for GDB. Type "show warranty" for details.
This GDB was configured as "powerpc-apple-darwin".
Reading symbols for shared libraries .. done
(gdb) list main
14
15 return x;
16 }
17
18 int main (void)
19 {
20 struct date today = {10, 11, 2014};
21 int array[5] = {1, 2, 3, 4, 5};
22 struct date *newdate, foo ();
23 char *string = "test string";
(gdb) break main Set breakpoint in main
Breakpoint 1 at 0x1ce8: file p18-5.c, line 20.
(gdb) run Start program execution
Starting program: /Users/stevekochan/MySrc/c/a.out
Reading symbols for shared libraries . done
Breakpoint 1, main () at p18-5.c:20
20 struct date today = {10, 11, 2014};
(gdb) step Execute line 20
21 int array[5] = {1, 2, 3, 4, 5};
(gdb) print today
$1 = {
month = 10,
day = 11,
year = 2014
}
(gdb) print array This array hasn't been initialized yet
$2 = {-1881069176, -1880816132, -1880815740, -1880816132, -1880846287}
(gdb) step Run another line
23 char *string = "test string";
(gdb) print array Now try it
$3 = {1, 2, 3, 4, 5} That's better
(gdb) list 23,28
23 char *string = "test string";
24 int i = 3;
25
26 newdate = (struct date *) malloc (sizeof (struct date));
27 newdate->month = 11;
28 newdate->day = 15;
(gdb) step 5 Execute 5 lines
29 newdate->year = 2014;
(gdb) print string
$4 = 0x1fd4 "test string"
(gdb) print string[1]
$5 = 101 'e'
(gdb) print array[i] The program set i to 3
$6 = 4
(gdb) print newdate This is a pointer variable
$7 = (struct date *) 0x100140
(gdb) print newdate->month
$8 = 11
(gdb) print newdate->day + i Arbitrary C expression
$9 = 18
(gdb) print $7 Access previous value
$10 = (struct date *) 0x100140
(gdb) info locals Show the value of all local variables
today = {
month = 10,
day = 11,
year = 2014
}
array = {1, 2, 3, 4, 5}
newdate = (struct date *) 0x100140
string = 0x1fd4 "test string"
i = 3
(gdb) break foo Put a breakpoint at the start of foo
Breakpoint 2 at 0x1c98: file p18-5.c, line 13.
(gdb) continue Continue execution
Continuing.
Breakpoint 2, foo (x={month = 10, day = 11, year = 2014}) at p18-5.c:13
13 ++x.day; 0x8e in foo:25: {
(gdb) print today Display value of today
No symbol "today" in current context
(gdb) print main::today Display value of today from main
$11 = {
month = 10,
day = 11,
year = 2014
}
(gdb) step
15 return x;
(gdb) print x.day
$12 = 12
(gdb) continue
Continuing.
Program exited normally.
(gdb)
Note one feature of gdb: After a breakpoint is reached or after single stepping, it lists the line that will be executed next when you resume execution of your program, and not the last executed line. That’s why array was still not initialized the first time it was displayed. Single stepping one line caused it to be initialized. Also note that declarations that initialize automatic variables are considered executable lines (they actually do cause the compiler to produce executable code).
Listing and Deleting Breakpoints
Once set, breakpoints remain in a program until gdb exits or until you delete them. You can see all the breakpoints that you have set by using the info break command, as follows:
(gdb) info break
Num Type Disp Enb Address What
1 breakpoint keep y 0x00001c9c in main at p18-5.c:20
2 breakpoint keep y 0x00001c4c in foo at p18-5.c:13
You can delete a breakpoint at a particular line with the clear command followed by the line number. You can delete a breakpoint at the start of a function by specifying the function’s name to the clear command instead:
(gdb) clear 20 Remove breakpoint from line 20
Deleted breakpoint 1
(gdb) info break
Num Type Disp Enb Address What
2 breakpoint keep y 0x00001c4c in foo at p18-5.c:13
(gdb) clear foo Remove breakpoint on entry into foo
Deleted breakpoint 2
(gdb) info break
No breakpoints or watchpoints.
(gdb)
Getting a Stack Trace
Sometimes, you’ll want to know exactly where you are in terms of the hierarchy of function calls when a program gets interrupted. This is useful information when examining a core file. You can take a look at the call stack by using the backtrace command, which can be abbreviated asbt. The following is an example use of Program 17.5.
(gdb) break foo
Breakpoint 1 at 0x1c4c: file p18-5.c, line 13.
(gdb) run
Starting program: /Users/stevekochan/MySrc/c/a.out
Reading symbols for shared libraries . done
Breakpoint 1, foo (x={month = 10, day = 11, year = 2014}) at p18-5.c:13
13 ++x.day;
(gdb) bt Print stack trace
#0 foo (x={month = 10, day = 11, year = 2014}) at p18-5.c:13
#1 0x00001d48 in main () at p18-5.c:31
(gdb)
When the break is taken on entry to foo(), the backtrace command is entered. The output shows two functions on the call stack: foo() and main(). As you can see, the arguments to the functions are also listed. Various commands (such as up, down, frame, and info args) that are not covered here allow you to work your way around in the stack so that you can more easily examine arguments passed to a particular function or work with its local variables.
Calling Functions and Setting Arrays and Structures
You can use function calls in gdb expressions as follows:
(gdb) print foo(*newdate) Call foo with date structure pointed to by newdate
$13 = {
month = 11,
day = 16,
year = 2014
}
(gdb)
Here, the function foo() is as defined in Program 17.5.
You can assign values to an array or structure by listing them inside a set of curly braces, as follows:
(gdb) print array
$14 = {1, 2, 3, 4, 5}
(gdb) set var array = {100, 200}
(gdb) print array
$15 = {100, 200, 0, 0} Unspecified values set to zero
(gdb) print today
$16 = {
month = 10,
day = 11,
year = 2014
}
(gdb) set var today={8, 8, 2014}
(gdb) print today
$17 = {
month = 8,
day = 8,
year = 2014
}
(gdb)
Getting Help with gdb Commands
You can use the built-in help command to get information about various commands or types of commands (called classes by gdb).
The command help, without any arguments, lists all the available classes:
(gdb) help
List of classes of commands:
aliases -- Aliases of other commands
breakpoints -- Making program stop at certain points
data -- Examining data
files -- Specifying and examining files
internals -- Maintenance commands
obscure -- Obscure features
running -- Running the program
stack -- Examining the stack
status -- Status inquiries
support -- Support facilities
tracepoints -- Tracing of program execution without stopping the program
user-defined -- User-defined commands
Type "help" followed by a class name for a list of commands in that class.
Type "help" followed by command name for full documentation.
Command name abbreviations are allowed if unambiguous.
Now, you can give the help command one of those listed classes, as follows:
(gdb) help breakpoints
Making program stop at certain points.
List of commands:
awatch -- Set a watchpoint for an expression
break -- Set breakpoint at specified line or function
catch -- Set catchpoints to catch events
clear -- Clear breakpoint at specified line or function
commands -- Set commands to be executed when a breakpoint is hit
condition -- Specify breakpoint number N to break only if COND is true
delete -- Delete some breakpoints or auto-display expressions
disable -- Disable some breakpoints
enable -- Enable some breakpoints
future-break -- Set breakpoint at expression
hbreak -- Set a hardware assisted breakpoint
ignore -- Set ignore-count of breakpoint number N to COUNT
rbreak -- Set a breakpoint for all functions matching REGEXP
rwatch -- Set a read watchpoint for an expression
save-breakpoints -- Save current breakpoint definitions as a script
set exception-catch-type-regexp –
Set a regexp to match against the exception type of a caughtobject
set exception-throw-type-regexp –
Set a regexp to match against the exception type of a thrownobject
show exception-catch-type-regexp –
Show a regexp to match against the exception type of a caughtobject
show exception-throw-type-regexp –
Show a regexp to match against the exception type of a thrownobject
tbreak -- Set a temporary breakpoint
tcatch -- Set temporary catchpoints to catch events
thbreak -- Set a temporary hardware assisted breakpoint
watch -- Set a watchpoint for an expression
Type "help" followed by command name for full documentation.
Command name abbreviations are allowed if unambiguous.
(gdb)
Alternatively, you can specify a command, such as one from the previous list:
(gdb_ help break
Set breakpoint at specified line or function.
Argument may be line number, function name, or "*" and an address.
If line number is specified, break at start of code for that line.
If function is specified, break at start of code for that function.
If an address is specified, break at that exact address.
With no arg, uses current execution address of selected stack frame.
This is useful for breaking on return to a stack frame.
Multiple breakpoints at one place are permitted, and useful if conditional.
break ... if <cond> sets condition <cond> on the breakpoint as it is created.
Do "help breakpoints" for info on other commands dealing with breakpoints.
(gdb)
So, you can see that you have a lot of help information built right in to the gdb debugger. Be sure to take advantage of it!
Odds and Ends
Many other features are available with gdb that can’t be covered here for space reasons. These include the ability to
![]() Set temporary breakpoints that are automatically removed when they are reached.
Set temporary breakpoints that are automatically removed when they are reached.
![]() Enable and disable breakpoints without having to clear them.
Enable and disable breakpoints without having to clear them.
![]() Dump memory locations in a specified format.
Dump memory locations in a specified format.
![]() Set a watchpoint that allows for your program’s execution to be stopped whenever the value of a specified expression changes (for example, when a variable changes its value).
Set a watchpoint that allows for your program’s execution to be stopped whenever the value of a specified expression changes (for example, when a variable changes its value).
![]() Specify a list of values to be displayed whenever the program stops.
Specify a list of values to be displayed whenever the program stops.
![]() Set your own “convenience variables” by name.
Set your own “convenience variables” by name.
In addition, if you are using an integrated development environment (IDE), most have their own debugging tools, many of which are similar to the gdb commands described in this chapter. It’s impossible to cover each individual IDE in this chapter, so the best way to explore the options available to you is run the debugging tools on your programs—even introduce some errors that you have to hunt down with your debugger.
Table 17.1 lists the gdb commands covered in this chapter. A leading bold character for a command name shows how the command can be abbreviated.
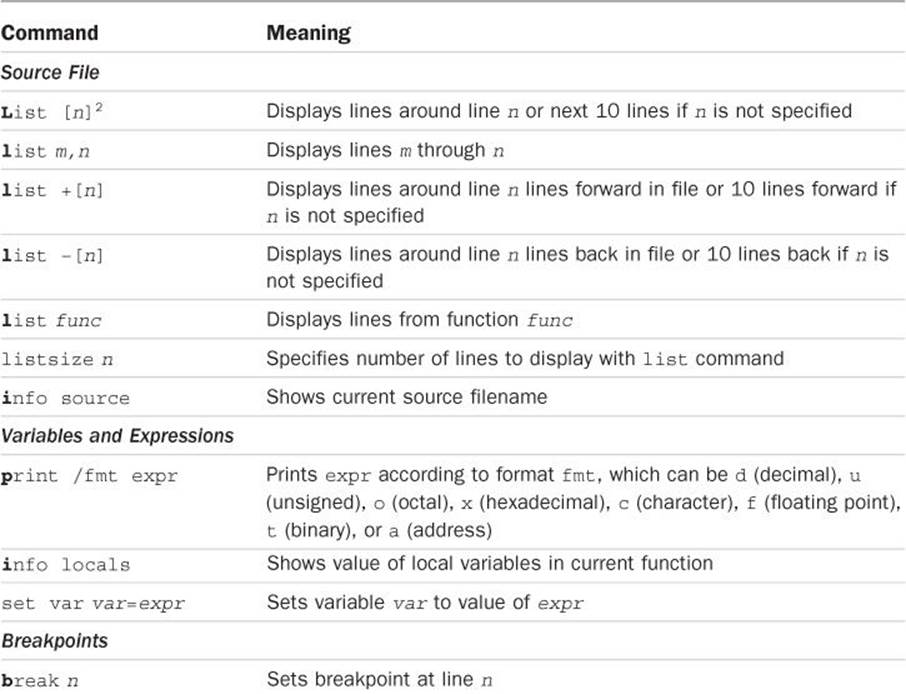
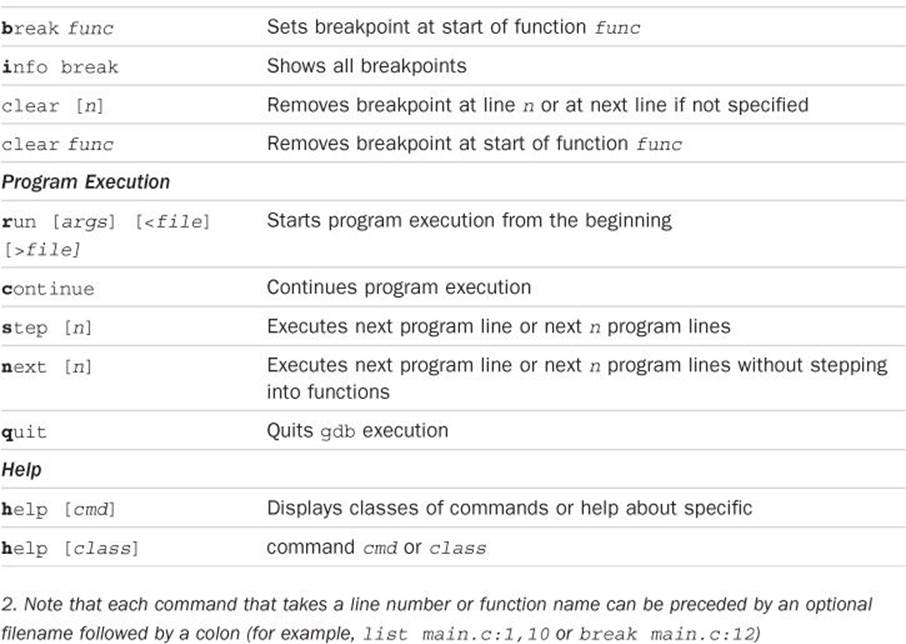
Table 17.1 Common gdb Commands
All materials on the site are licensed Creative Commons Attribution-Sharealike 3.0 Unported CC BY-SA 3.0 & GNU Free Documentation License (GFDL)
If you are the copyright holder of any material contained on our site and intend to remove it, please contact our site administrator for approval.
© 2016-2026 All site design rights belong to S.Y.A.