Sams Teach Yourself C# 5.0 in 24 Hours (2013)
Part I: C# Fundamentals
Hour 2. Introducing Visual Studio
What You’ll Learn in This Hour
• Introducing the Visual Studio editions
• Writing your first program
• Debugging in Visual Studio
• Visualizing data
• Commenting your code
Visual Studio is a complete Integrated Development Environment (IDE) that is actually made up of many different tools designed with one goal: enabling you to create innovative, next-generation applications. At its heart, Visual Studio includes a powerful code editor, language compilers (including support for Visual Basic, C#, C++, and F#), and debugging tools.
Visual Studio also includes much more than that:
• Integration with source control systems
• Graphical design tools
• Tools for Microsoft Office, SharePoint, and cloud development
• Testing tools
Although it is entirely possible to write applications using your favorite text editor and the command-line utilities that are part of the .NET Framework software developer kit (SDK), it is not practical to do so. The benefits of the integration of the editing and debugging tools, combined with the productivity enhancements provided by Visual Studio, enable you to easily and effectively write and debug your applications.
In this hour, you are introduced to Visual Studio by writing your first .NET application. You then learn the basics of working with the Visual Studio debugger and how it can be used to help you locate and correct application flaws, or bugs.
Introducing the Visual Studio Editions
Microsoft offers several editions of Visual Studio, some of which must be purchased and some of which are free. You may have one of the Visual Studio products, such as the following:
• Ultimate with MSDN
• Premium with MSDN
• Professional with MSDN
• Professional (without MSDN)
• Express for Web
• Express for Windows 8
• Express for Windows Desktop
The Express editions are free and targeted at web, Windows Store apps, and more traditional Windows desktop development. The other four editions are designed for use in a corporate development setting and offer additional features and capabilities.
Throughout this book, most of the examples and screen images are from Express for Windows Desktop (except those in Hour 19, “Building Windows Store Apps,” which uses Express for Windows 8). If you run one of the other Visual Studio editions, the screen images may look different.
When Visual Studio starts, you see the Start Page, shown in Figure 2.1, which enables you to access recent projects, create new projects, learn about upcoming product releases, or read the latest development news.
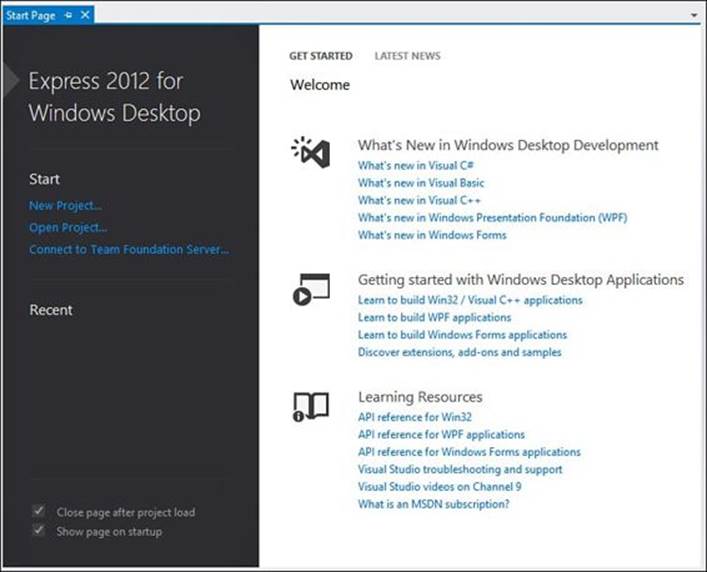
Figure 2.1. Express 2012 Start Page.
The Start Page is divided into the following sections:
• The command section, which shows the New Project and Open Project commands. This section can also show the Connect to Team Foundation Server command, if you have installed one of the Visual Studio with MSDN editions.
• The Recent Projects list, which shows the most recently opened projects. Clicking one of the projects opens it in Visual Studio. It is also possible to pin a project, as shown in Figure 2.2, which keeps it in its current position after other projects are opened and closed.
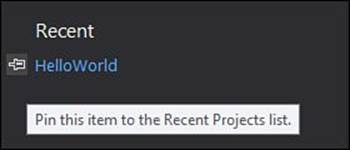
Figure 2.2. Pinning recent projects.
• A tabbed content area. The Get Started tab displays a list of Help topics and other resources that can help you learn about the features of Visual Studio. The Latest News tab lists featured articles from the selected RSS feed.
Solutions, Projects, and Items
Visual Studio uses two concepts to help you organize and interact with your source code files called solutions and projects.
A project is a collection of source files and related metadata that produce a single assembly when compiled. A solution includes one or more projects plus additional files and metadata that define the solution as a whole. Whenever you create a new project, Visual Studio automatically creates a solution for you. When necessary, you can add additional projects to that solution. A project can belong to multiple solutions, and complex applications can require more than one solution.
The Solution Explorer, shown in Figure 2.3, displays the solution, the project (or projects) contained in that solution, and the items for each project, enabling you to easily view and manage these containers and their associated items.
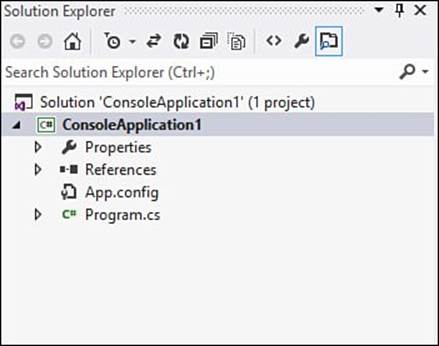
Figure 2.3. Solution Explorer.
Most of the time, you interact with the Solution Explorer by double-clicking a project item, such as a code file, to display it in an editor window or through the context menu to add or remove items or projects.
Writing Your First Program
At this point, you should be familiar enough with the C# language and syntax to write your first program. If you haven’t already installed Visual Studio, now is the time to do so. As your first introduction to C#, you will continue the tradition of starting with a simple application that displays the message “Hello, world” on the screen.
Creating a Project
Creating the project can be done using the New Project command on the Start Page, the New Project toolbar button, or the application menu. These three locations are shown in Figure 2.4. If you have one of the Visual Studio with MSDN editions installed, the location of the menu item and toolbar button may be slightly different.
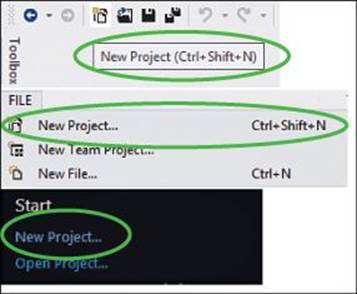
Figure 2.4. New Project commands.
This displays the New Project dialog box, shown in Figure 2.5, which enables you to specify the name and type of project.
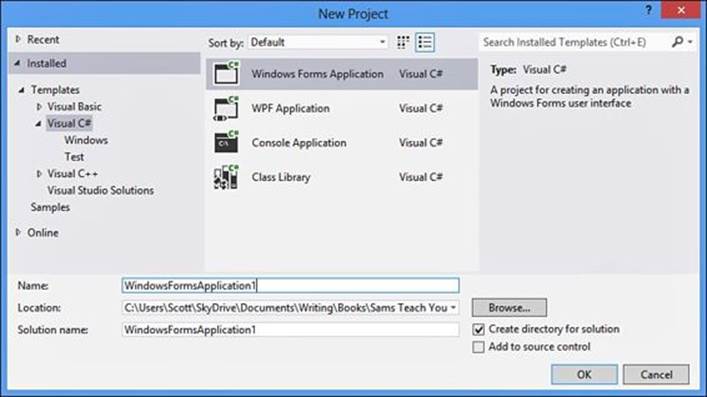
Figure 2.5. New Project dialog box.
For this first application, you will create a console application named ConsoleHelloWorld. After you select the project type and provide the name, you can click the OK button or double-click the project type. This closes the dialog box, creates the project, and displays the default code for that project, as shown in Figure 2.6.
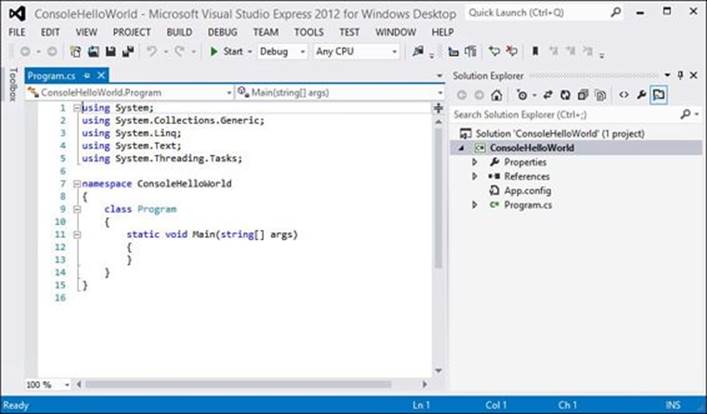
Figure 2.6. Default code for a console application.
As you can see, Visual Studio has already done some of the work for us and provided some starting code. Before we start adding our own code, let’s examine the code Visual Studio generated for us.
At the top of the file (lines 1 to 5) is a list of namespaces (see Figure 2.7). Each namespace is included by a using directive, which is simply the keyword using followed by the namespace. Using directives tell the compiler, and us, that we are referencing a namespace and the types declared in that namespace should be available for use.
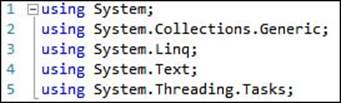
Figure 2.7. Using directives.
Just below the using directives (see Figure 2.8), you declare a namespace named ConsoleHelloWorld (line 7) and a class named Program (line 9). Inside this class, we have defined a static function named Main (line 11). You learn about classes and methods in more detail in Hour 4, “Understanding Classes and Objects the C# Way,” but for now, think of them as a container whose boundaries are defined by the opening and closing braces.
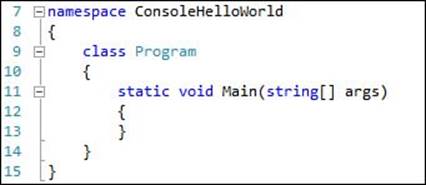
Figure 2.8. Default Program.cs contents.
Adding Program Statements
Now, you can focus on what we need this application to do. Because you are working in a console application, you need a way to interact with the console window that runs our application. By examining the framework class library, you will find a class named Console, which provides methods for displaying messages and receiving user input through the keyboard.
To display text in the console window, you need to enter the following statement between the braces that define Main (lines 12 and 13):
Console.WriteLine("Hello, world");
Your file should now look like Figure 2.9.
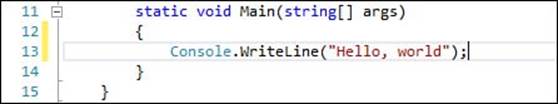
Figure 2.9. Adding Console.WriteLine.
You could have also written this line using the full type name, which is System.Console. It isn’t necessary to do so because of the using directives included at the beginning of the file. Because these using directives tell the compiler that you want to use types declared in that namespace, you can use just the type name. If, however, there were two types with the same name in two included namespaces, the compiler cannot determine which one to use. In that case, you would still need to use the full type name.
At this point, you have a complete “Hello, world” application. Although this might seem like a trivial example, it only appears that way. Keep in mind that a Windows command prompt is not a managed application, so that single line in your C# program encapsulates all the necessary logic to interact with that unmanaged application and direct it to display the text you want. To the C# compiler, that seemingly innocuous line ultimately depends on dozens of types in about a dozen different namespaces, all provided by the framework class library.
Running the Application
If you haven’t already done so, run your application by pressing Ctrl+F5. Visual Studio then saves your file (if you haven’t already saved it), compiles it to an application named ConsoleHelloWorld.exe, and runs it.
Note: “Press Any Key to Continue...”
If you use the Start Debugging menu option, the Debug Target toolbar button, or F5, the application will run and then immediately exit. To prevent that from happening, you should use either Ctrl+F5 or the Start Without Debugging menu option, under the DEBUG menu.
When you run without debugging, Visual Studio automatically adds the message “Press any key to continue...”. If you don’t want to see that message or remember to use Ctrl+F5 each time, you could add the following as the last statement in the Main method:
Console.ReadLine();
This will cause the application to wait until the Enter key is pressed before continuing. Because this is the last line of the method, the application will simply exit.
If you entered everything correctly, you should see the message “Hello, world” in a command window, as shown in Figure 2.10.
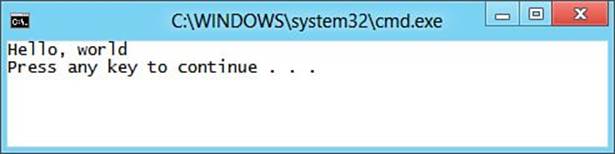
Figure 2.10. Hello, world.
Debugging in Visual Studio
The Visual Studio debugger is actually made up of a set of tools that enable you to inspect your application’s internal state as it is running. Some of the tasks the debugger enables you to perform are as follows:
• Examining your code
• Controlling the execution of your application
• Evaluating and modifying variables
• Seeing the variable contents when an exception occurs
All of the debugging tools can be accessed through the Debug menu in Visual Studio, including the different debugger windows and dialog boxes that enable you to see and modify information about your application.
Compiler and Runtime Errors
Errors can occur at any time in your application, including when you write the code. These errors are compiler or build errors, and actually prevent the compiler from successfully compiling your code into an assembly. Runtime errors occur when your application is actually executing in the form of exceptions and are the errors the Visual Studio debugger enables you to locate and diagnose.
One of the basic rules for integer division is that you cannot divide a number by zero. If you attempt to do this at compile time, you see a compiler error, as shown in Figure 2.11.
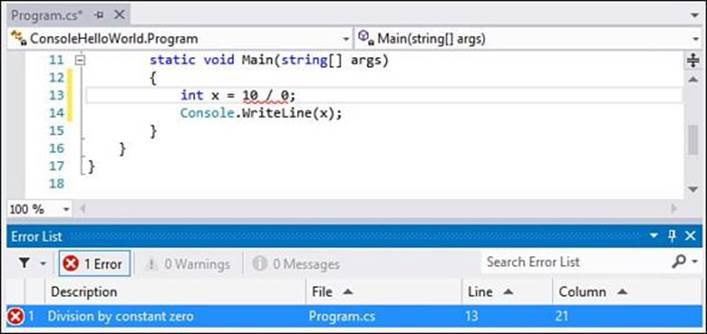
Figure 2.11. Compiler error shown in the error list.
To easily find the location of the compiler error, you can double-click the entry in the error list to go directly to that line in the code.
Most likely, this isn’t actually what was intended. Instead, you want to divide by a user-provided divisor, as shown in Listing 2.1. This code retrieves a value provided by the user, converts it to an integer value, and then uses it as the divisor.
Listing 2.1. Dividing Using a User-Provided Divisor
static void Main(string[] args)
{
string input = Console.ReadLine();
int divisor = Convert.ToInt32(input);
int x = 10 / divisor;
Console.WriteLine(x);
}
Although this code compiles and runs without any errors, what happens if the divisor entered is zero or, even worse, not numeric at all?
If you are running the application outside of Visual Studio, your application will crash with one of two possible unhandled exceptions:
• System.DivideByZeroException—Attempted to divide by zero
• System.FormatException—Input string was not in a correct format
Debugging Your Code
If you run the application inside Visual Studio, however, you get the ability to debug the application at the point the exception occurred, as shown in Figure 2.12.
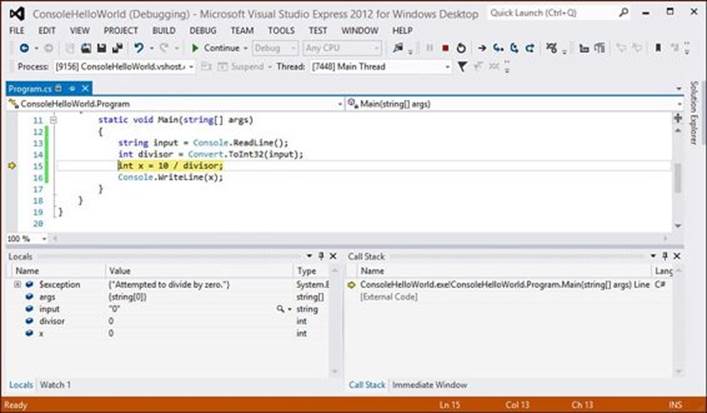
Figure 2.12. Visual Studio debugger breaking on an exception.
The Visual Studio debugger suspended (commonly called breaking) program execution at the point the DivideByZeroException occurred. The line that contains the exception is highlighted, by default, in yellow, and the gray bar on the left of the code editor (called the margin) contains a yellow arrow indicating the execution point. The Exception Assistant, shown in detail in Figure 2.13, also appears and shows the type of exception, the exception message, troubleshooting tips, and corrective actions. In this case, the Exception Assistant indicates that you attempted to divide by zero and there are no corrective actions.
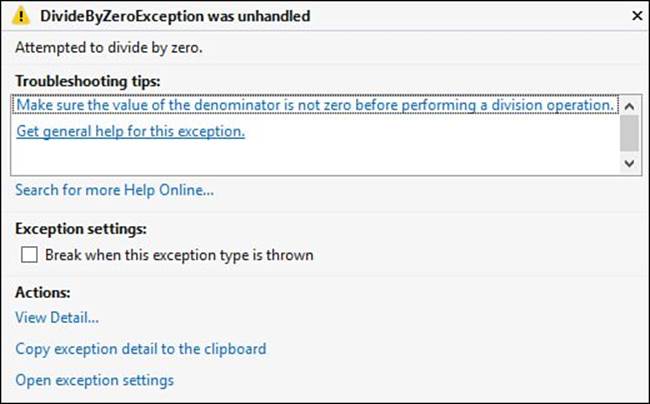
Figure 2.13. Exception Assistant.
Go To
HOUR 11, “HANDLING ERRORS USING EXCEPTIONS,” for more information on exceptions.
Note: Breaking on Exceptions
Having your application break on all exceptions might not be the desired behavior during a debugging session. This behavior is configurable, allowing you to break only on certain exceptions, break only on unhandled exceptions, and a few other options.
You can access these settings through the Exceptions choice on the Debug menu.
If you are running Visual Studio Express, instead of the Exception Assistant, you will see an Exception dialog box, as shown in Figure 2.14.
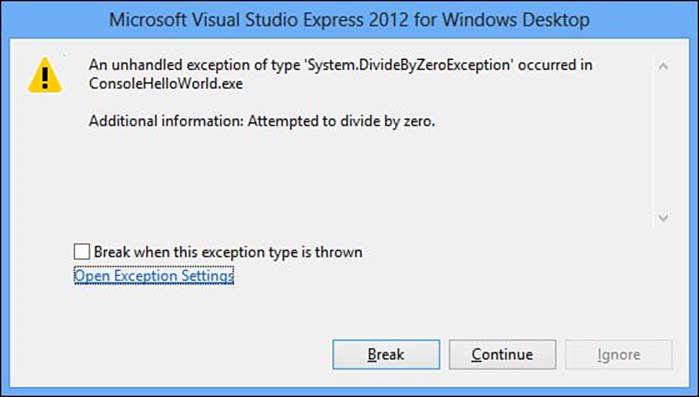
Figure 2.14. Exception dialog box.
In addition to the Exception Assistant, Visual Studio includes a number of tools that help you identify and eliminate program errors; the primary ones are as follows:
• Variable windows
• DataTips
• Immediate window
• Breakpoints
• Execution control
Variable Windows
Variable windows display the name, value, and data type of variables while you debug. Although seeing the current value of a variable is helpful when you debug, modifying the value of a variable is even more helpful. Fortunately, the variable windows enable you to do just that. By double-clicking in the value column, or using the Edit Value context menu, you can edit the value of that variable.
Visual Studio Express provides two variable windows: the Locals window and the Watch window. These windows appear below the code editor while you debug and can be accessed using the Debug Windows menu.
Caution: Visual Studio with MSDN Editions
If you are using one of the Visual Studio with MSDN editions, you have a few extra capabilities not found in the Visual Studio Express editions.
In addition to the Locals and Watch windows, you also have an Autos window, which displays variables used in the current and preceding line of code. Like the Locals window, the debugger also automatically populates the Autos window.
Although the Watch window allows you to examine many variables or expressions, the QuickWatch dialog box enables you to examine a single variable or expression at a time and is useful for quickly seeing a single value or large data structure.
You also have multiple Watch windows, four of them actually, instead of just one.
The Locals window, shown in Figure 2.15, displays all the local variables that are currently in scope. When a value has been modified, it appears in red.
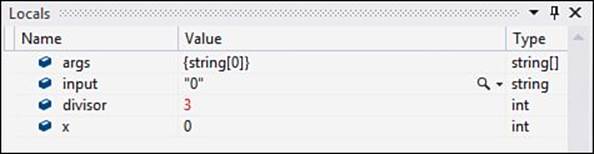
Figure 2.15. Locals window.
The Watch window enables you to enter expressions directly. The simplest expression you can enter is a variable name; however, the debugger accepts most valid language expressions. The expression evaluator does not accept lambdas or LINQ query syntax expressions. To evaluate an expression in the Watch window, you can do the following:
• Click on the Name column in an empty row and enter the variable name or expression.
• Drag a variable or expression from the code editor to an empty row.
• Use the Add Watch context menu from the selected expression.
When an expression has been added to the Watch window, it remains there until you remove it. If the expression is no longer in scope, it displays in a disabled state.
When the Watch window displays a dynamic object, a special “Dynamic View” node is added that shows the members of the dynamic object but does not enable editing the values.
Go To
HOUR 22, “DYNAMIC TYPES AND LANGUAGE INTEROPERABILITY,” for more information on dynamic types.
Note: Expressions with Side Effects
Expressions that change data are said to have side effects. When you enter such an expression into the Watch window, the side effect occurs each time the expression is evaluated by the Watch window. If you are not aware that the expression has side effects, this can lead to unexpected results.
When an expression is known to have side effects, it is evaluated only the first time you enter it. Subsequent evaluations are disabled; however, you can override this behavior by clicking the Update icon (which resembles two green arrows circling in opposite directions within a green circle) that appears next to the value.
Using DataTips
You can also view the current value using a DataTip, which is one of the more convenient ways for viewing information about variables and objects in your program while you are debugging. By placing the mouse pointer over the variable in a source editor while you debug, the DataTip displays, as shown in Figure 2.16. Just as you can in the Locals window, you can edit the value by clicking on the DataTip.
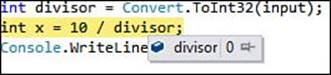
Figure 2.16. DataTip.
By default, DataTips are transient and disappear when you move the mouse cursor away from the variable. DataTips can also be pinned, as shown in Figure 2.17, to a specific location in the source file by clicking the Pin to Source icon (the pushpin on the right side of the DataTip).
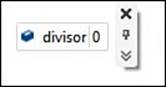
Figure 2.17. A pinned DataTip.
Although DataTips are visible only during a debugging session, pinned DataTips display a pushpin icon in the margin of the editor that you can place the mouse cursor over to view the value from the last debugging session, as shown in Figure 2.18.
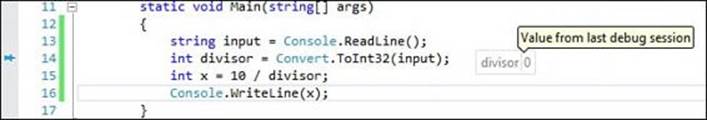
Figure 2.18. A pinned DataTip while editing.
By clicking the Unpin from Source icon, you can float the DataTip above any open windows. A pinned or floating DataTip will be visible in the same location for any subsequent debugging sessions, including after restarting Visual Studio.
Tip: Sharing DataTips
You can also export DataTips to an XML file to share with other developers working on the same project.
To export DataTips, click Export DataTips on the DEBUG menu, navigate to the location where you want to save the XML file, provide a name for the file, and click OK. To import DataTips, click Import DataTips on the DEBUG menu and select the appropriate XML file.
Using the Immediate Window
The Immediate window enables you to evaluate expressions, execute statements, print variable values, and many other actions. The Immediate window also supports specific Visual Studio commands in addition to allowing you to execute language statements.
For example, the commands to display the value of the divisor variable at the time the exception occurred are shown in Figure 2.19. You can use the Up and Down arrow keys to cycle through previously entered commands.
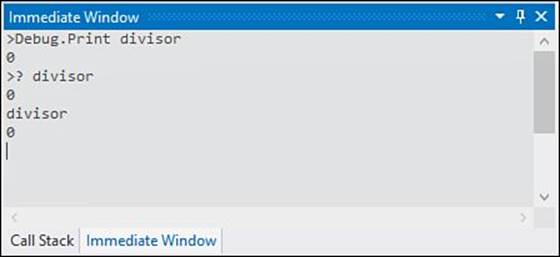
Figure 2.19. Immediate window.
Understanding Breakpoints
When debugging an application using the Visual Studio debugger, your application is either executing (running) or in Break mode. Break mode occurs when the debugger breaks the program execution as the result of an exception, a user-defined breakpoint, or manually breaking the execution. Most of the debugger features are available only when your application is in Break mode.
To manually break the execution of your program, you can use Break All from the Debug menu. This causes the debugger to stop the execution of all programs running under the debugger.
As the name implies, a breakpoint tells the debugger that your application should break execution at a certain point. When a breakpoint is set, the line is shown in red by default, and a solid red circle displays in the editor margin, as shown in Figure 2.20.
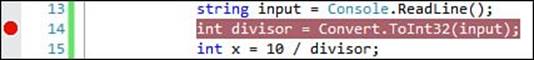
Figure 2.20. An enabled breakpoint.
There are multiple ways to set a breakpoint. To set a breakpoint on an entire line, you can click the margin next to the line of code, place the mouse cursor over the line of code and use the Insert Breakpoint context menu option, or place the caret (the text cursor represented by the vertical bar) in the line of code and press the F9 key.
After a breakpoint has been set, your application will break at that location every time it is run under a debugger. When you no longer want the breakpoint set, you can remove it by clicking the breakpoint symbol in the margin. You can also place the mouse cursor over the line of code containing the breakpoint and use the Delete Breakpoint context menu option, or place the caret (the text cursor represented by the vertical bar) in the line of code and press the F9 key.
Sometimes, however, you only want to disable a breakpoint. To do this, you can right-click the breakpoint symbol in the margin or place the mouse cursor over the line of code containing the breakpoint, and use the Disable Breakpoint context menu option. You can also place the caret in the line of code and press the Ctrl+F9 keys. A disabled breakpoint, shown in Figure 2.21, is displayed with a red outlined circle in the editor margin and a red border around the line containing the breakpoint.
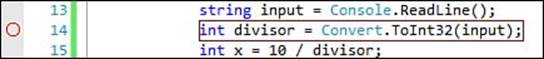
Figure 2.21. A disabled breakpoint.
To reenable a breakpoint, right-click the breakpoint symbol in the margin or place the mouse cursor over the line of code containing the breakpoint and use the Enable Breakpoint context menu option. You can also place the caret in the line of code and press the Ctrl+F9 keys.
Note: Extra Breakpoint Capabilities
If you use one of the paid Visual Studio editions, you have a few extra breakpoint capabilities not found in the Express editions.
The most apparent one is the ability to create a tracepoint. A tracepoint is a breakpoint, which, by default, does not break program execution but instead performs a custom action. Tracepoints are most commonly used for printing messages when your program reaches a certain point.
In addition to tracepoints, you can also place restrictions on when a breakpoint will actually cause the debugger to break program execution by applying a condition. The debugger evaluates the condition expression when the breakpoint is reached. If the condition is satisfied, the debugger breaks program execution; if not, the program continues to execute. Closely related to conditions, you can also indicate that the breakpoint should occur after it has been hit a certain number of times. By default, execution breaks every time a breakpoint is hit.
Finally, you can use the Breakpoints window to display all the current breakpoints and tracepoints. The Breakpoints window also enables you to label a breakpoint or a group of breakpoints. Labels are useful when you want to mark a related group of breakpoints.
Controlling Program Execution
When an application is in Break mode, one of the most common debugging procedures is to execute code one line at a time. The Visual Studio debugger provides four ways to do this:
• Step Into
• Step Over
• Step Out
• Step Into Specific
Step Into and Step Over both instruct the debugger to execute the next line of code. The only difference is that if the line contains a function, Step Over executes the entire function and stops at the first line outside the function. Step Into halts at the first line of code inside the function.
When you are inside a function call and want to return to the calling function, you can use Step Out, which resumes execution until the function returns and then breaks at the first line outside the function.
Sometimes Step Into or Step Over isn’t enough, particularly when you have nested function calls. Instead, you want to step into a specific function call at a certain nesting level. To do this, you can use the Step Into Specific context menu, which allows you to choose the function you want to step into.
The currently executing line is shown highlighted in yellow, by default, with a yellow arrow symbol in the margin, as shown in Figure 2.22.
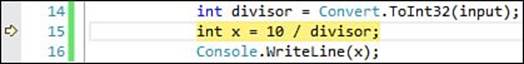
Figure 2.22. The current execution point.
The Step Into, Step Over, Step Out, and Step Into Specific actions all move “forward” in your program execution one line at a time. Sometimes, when you have started debugging you want to execute to a certain point and then break again. You can do this by finding the desired line, adding a new breakpoint, and then continuing execution with the F5 key.
However, this isn’t always necessary. You can also continue execution until it reaches the current cursor location. To do this, right-click on a line in the source code editor, and choose the Run To Cursor context menu.
Using the Call Stack Window
Although executing code and working with variables while debugging is certainly powerful, sometimes it is important to know where you have been as well. This information can be viewed through the Call Stack window, shown in Figure 2.23, which displays the name of each function on the stack and the programming language it was written in.
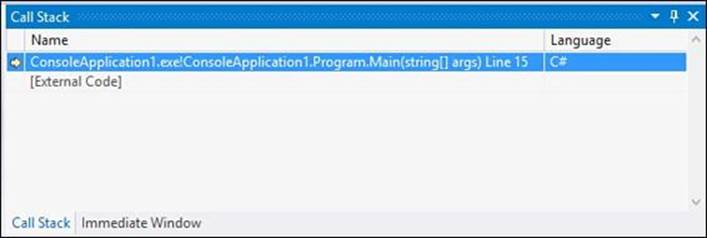
Figure 2.23. The Call Stack window.
Again, just as in the code editor, a yellow arrow indicates the stack frame containing the current execution point. The information shown in the Locals and Watch windows are from this frame. By double-clicking another row in the call stack, or right-clicking on another row and choosing Switch To Frame on the context menu, you can change context to another frame on the stack. A green arrow indicates the frame that has the current context and the line of code executed in that frame is highlighted in green, as shown in Figure 2.24.
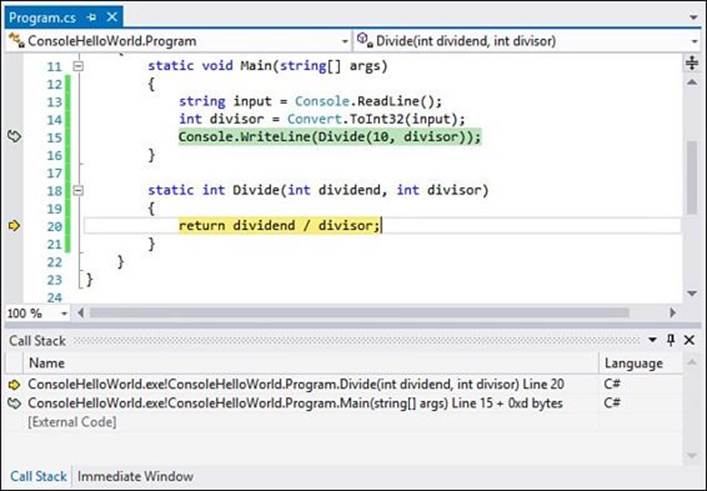
Figure 2.24. Switching to another call stack frame.
Caution: Switching Call Stack Frames
When you switch to another call stack frame, the current execution point remains in the original frame. When you continue execution or perform one of the Step actions, execution continues from the original frame, not the frame you selected.
Setting the Next Statement
Although switching context to another stack frame is useful, sometimes it is necessary to reexecute a line that has previously executed or even skip over sections of code. This can be accomplished by manually setting the next statement to be executed.
You can do this by moving the yellow arrow up or down to indicate the next statement. You can also place the mouse cursor over the desired line and use the Set Next Statement context menu.
Caution: Setting the Next Statement
When you set the next execution statement, you cause the program to jump directly to that location. This means that any instructions between the old and new execution points are not executed. It also means that if the execution point moves backward, any intervening instructions are not undone.
It is also not possible to move the next statement to another function or scope because doing so usually results in call-stack corruption, ultimately causing a runtime error to occur.
Visualizing Data
Seeing the value of a variable while debugging is useful, and as data structures become more complex, this ability becomes ever more powerful. Unfortunately, sometimes a value is better understood when seen using a manner that is more appropriate for its data type or value. For example, a string containing HTML is certainly more easily understood if the data is viewed as it would appear in a web browser, and a string containing XML is more easily understood when you can visually see the XML structure.
Visual Studio includes five standard visualizers:
• Text, HTML, and XML visualizers, which all work with string objects
• WPF Tree visualizer, for displaying the properties of a WPF object’s visual tree
• Dataset visualizer, which works for DataSet, DataView, and DataTable objects
Note: Visualizers
Many additional visualizers are available for you to download. Installing a new visualizer is as simple as copying the files to the following location (on Windows 7 and later):
Documents\Visual Studio 2012\Visualizers
When a data type has a visualizer available, you see a Magnifying Glass icon in the DataTip (as shown in Figure 2.25), variable windows, or the QuickWatch dialog box.
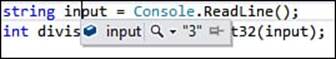
Figure 2.25. Debugger visualizers.
By clicking the magnifying glass, you are presented a menu of the available visualizers, shown in Figure 2.26; choosing one displays the value of the variable in the specified visualizer window.
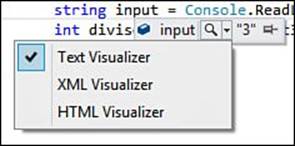
Figure 2.26. Menu of available visualizers.
For example, choosing the Text Visualizer displays the visualizer window shown in Figure 2.27.
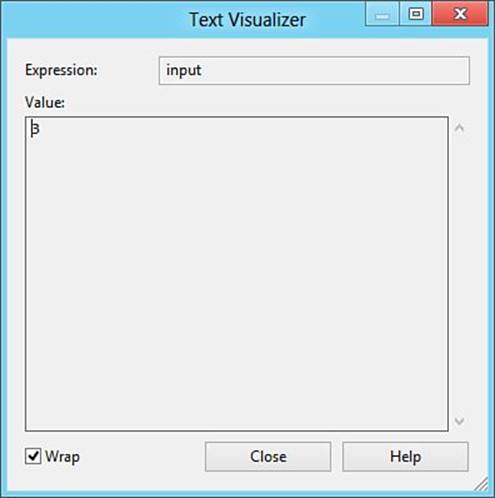
Figure 2.27. Text Visualizer.
Commenting Your Code
Although commenting your code isn’t actually a feature of the Visual Studio debugger, it is one of the simplest ways to reduce bugs from the start. Good comments make it easier to understand what the code is doing and, more important, why it is doing it a particular way. Comments are meant to be read by programmers and should be clear and precise. A comment that is hard to understand or incorrect isn’t much better than having no comment at all.
Note: XML Comments
Another form of comment that you should get in the habit of using are XML comments. An XML comment generally starts with three forward slashes (///) on each line. Everything after those slashes must be valid and well-formed XML. The simplest XML comment looks like
/// <summary>
/// This is a summary comment, typically describing what a
/// method or property does in one or two short sentences.
/// </summary>
These comments are most often used to create documentation for your code using external tools such as Sandcastle. Another nice feature of XML comments is that the Visual Studio code editor automatically uses them to generate IntelliSense ToolTips for your own code.
XML comments can also be delimited by starting with the /** character sequence and ending with */.
A comment is simply text ignored by the C# compiler. Comments are actually removed from the code text during compilation, so there is no impact to performance. For the compiler to recognize text as a comment, it must start with two forward slashes (//). Everything to the right of the slashes, and including the slashes, is a comment. This means that a comment can be on a line by itself, like this:
// This is a full line comment.
It can also appear at the end of a line of code, typically called an end-of-line comment, like this:
string name; // The name should include both first and last names.
Note: Delimited Comments
C# also supports a comment style made popular by the C programming language, which requires only a starting (/*) and ending (*/) comment character sequence; everything in between (including the start and end character sequence) is treated as a comment.
Although this comment style can be used for single-line comments, it is more commonly used for multiline comments. For example, a multiline comment using this style would be written as follows:
/* This is the start of a comment that spans
* multiple lines but does not require the
* characters at the start of each line. */
The C# editor automatically starts each line following the first one with a single asterisk (*) character. Multiline comments can also be easily accomplished by adding the // characters to each line.
Adding clear and precise comments to your code means that you don’t have to rely on memory to understand the “what” and “why” of a section of code. This is most important when you look at that code later on, or someone else must look at your code. Because comments become part of the textual content of your code, they should follow good writing principles in addition to being clearly written.
To write a good comment, you should do your best to document the purpose of the code (the why, not how) and indicate the reasoning and logic behind the code as clearly as possible. Ideally, comments should be written at the same time as you write the code. If you wait, you probably won’t go back and add them.
Note: Unit Tests
Although well-commented code can help with code maintenance, an effective way to both document and verify the functionality of your code is to write unit tests.
There are a variety of unit test frameworks, including the MSTest framework included with Visual Studio. No matter which unit testing framework you choose, the basic premise is similar. You write a unit test separate from your main code that tests a single “unit” (typically a method or property) to ensure that the method reliably produces the correct results under all possible conditions.
Unit tests also enable you to make code changes with confidence that those changes have not changed the expected behavior or result.
Summary
In this hour, you learned the basics of Visual Studio. You also wrote your first C# console application. Whether this was your first managed application as well or simply your first C# application, these first steps are laying the foundation for what comes later. This might have seemed like a trivial example—after all, how exciting is it to print the words “Hello, world” on the screen—but it is just the beginning.
Later, you learned how to use the Visual Studio debugging tools to diagnose and help fix application runtime errors. You learned about the importance of providing meaningful code comments and the differences between compile time and runtime errors.
Finally, you learned about the different tools the Visual Studio debugger makes available, including the variable windows and the Immediate window. You also learned how you can control program execution and set breakpoints to stop program execution at specific locations.
Q&A
Q. What is the purpose of a breakpoint?
A. A breakpoint suspends the execution of your application at a specific point.
Q. What is the difference between the Locals window and the Autos window?
A. The Locals window displays variables that are local to the current scope, typically the currently executing procedure or function. The Autos window displays variables only for the currently executing and the preceding statement.
Workshop
Quiz
1. What characters are used to indicate a single-line comment?
2. What does the yellow arrow in the code editor margin or call stack window indicate?
3. Can the value of a variable be modified while debugging?
Answers
1. Two forward slash (//) characters are used to indicate a single-line comment.
2. The yellow arrow indicates the next statement to be executed.
3. Yes, the value of a variable can be modified through the Locals, Autos, Watch, and Immediate windows. It can also be modified through a DataTip.
Exercises
1. Explore what else is available in the System.Console class by changing the “Hello, world” application to ask for your name and output “Hello, name.”, where name is text entered while the program is running.
2. Implement the code shown in Figure 2.24, but change lines 2 and 3 of the Main method so that the Divide method looks like the following:
int divisor = -1;
if (Int32.TryParse(input, out divisor))
{
try
{
Console.WriteLine(Divide(10, divisor));
}
catch (DivideByZeroException ex)
{
Console.WriteLine(ex.Message);
}
}
All materials on the site are licensed Creative Commons Attribution-Sharealike 3.0 Unported CC BY-SA 3.0 & GNU Free Documentation License (GFDL)
If you are the copyright holder of any material contained on our site and intend to remove it, please contact our site administrator for approval.
© 2016-2026 All site design rights belong to S.Y.A.