Administering ArcGIS for Server (2014)
Chapter 3. Consuming GIS Services
In Chapter 2, Authoring Web Services, we learned about the concept of web services. We glanced at their types and managed to author basic GIS services. It was a slightly theoretical chapter with some definitions that were necessary to equip you with the basics to kick-start this book. In this chapter, we will learn how to consume and interact with the services we authored; after all, what is the use of these services if we don't know how to use them?
The real power of Server will start to surface in this chapter. You will see how your data can be put to good use, and how sharing it can open up a whole new dimension for potential analysis. You will be surprised to see how your data can be used in conjunction with others' data, if published on your intranet or publicly. There are a lot of people with great ideas out there who would love to have access to your data to create useful applications. You can even reach a stage where it is possible to sell your services per usage. Similarly, you can consume other services and add them to your data. For instance, a government could have a Server installation where all government entities can supply secured services of its data to this centralized ArcGIS for Server installation. Imagine a scenario where the traffic department is monitoring the flow of traffic in the city with a real-time map service layer with Geographical Rich Site Summary (GeoRSS) enabled. There is a traffic jam on one of the roads. A traffic police officer guesses that it is probably an accident, so he adds the recent accidents layer, also real time, to overlay it with the traffic layer. He notes that there are no accidents on that road so he adds the incidents layer to check the recent incidents in the area. The incidents layer shows a water leak from a main pipe on that road causing vehicles to slow down, therefore creating congestion.
Note
GeoRSS is a standard for encoding locations into a real-time web feed.
This chapter is divided into three main sections, the first section, Using GIS services for visualization, is where you will learn how to present your data and mash different services together to create rich maps that you can share easily or put onto your website or blog. The second section, Using GIS services for editing, is the editing part. It allows you to use featured services to edit your data and add new records to your geodatabase; this is very useful for you if you have people on the field with mobile devices into which they can feed in data directly from the field. The final section, Using GIS services for analysis, highlights the analysis part and discusses how to analyze data in order to find useful patterns that help answer questions.
I can promise you this chapter will be interesting and full of practical exercises. You can even start the book with this chapter if you are already comfortable with your ArcGIS for Server setup and already know how to create GIS services.
Before you start
There are a few things we have to do before we go into the fun part of putting your map services to use.
Getting the map service URL
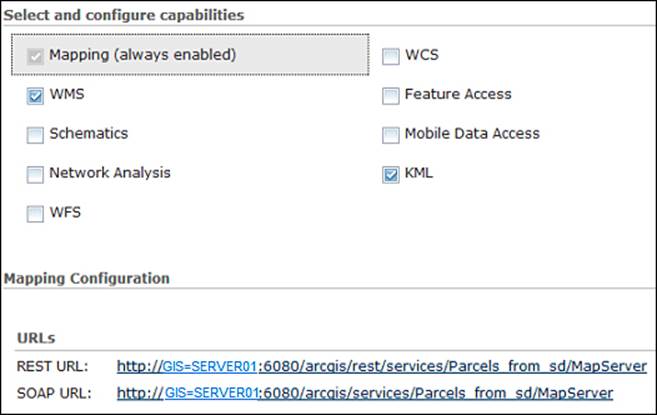
To consume the services, we first need to get a unique pointer to the service. There is a dedicated URL for each standard that the map service supports. For instance, to consume the map service over SOAP, you will need a SOAP URL. This applies to REST and all OGC standards where each end point returns different results, as seen in Chapter 2, Authoring Web Services. We have shown that Server enables both REST and SOAP protocols on any published map service by default, and we have learned how to enable other standards such as WMS on the GIS service. To get the URL, we need to log in to ArcGIS for Server Manager; go ahead and click on the Manager bookmark you saved earlier. In case you didn't bookmark Manager, you can access it from here: http://GIS-SERVER01:6080/arcgis/manager. Use the credentials for the primary administrator account. You will see the list of services that you have published. Scroll to Parcels_FGDB and click on it to view its details. From the left-hand pane, click on Capabilities to view the supported protocols published for this map service, and then select Mapping (always enabled). It should be activated by default, but just in case, this will list the default supported protocols SOAP and REST as shown in the following screenshot:
The URL http://GIS-SERVER01:6080/arcgis/rest/services/Parcels_FGDB /MapServer points to the map service using the REST protocol; we will use these links in our future exercises.
Tip
Best practice
This URL points to one of the physical GIS servers directly, so if this server is down for some reason, you will not be able to access the service even if you have another GIS server joined to the site. Therefore, it is recommended that you convert this URL to the Web Adaptor version through your dedicated Web server; refer to Chapter 1, Best Practices for Installing ArcGIS for Server, for more details.
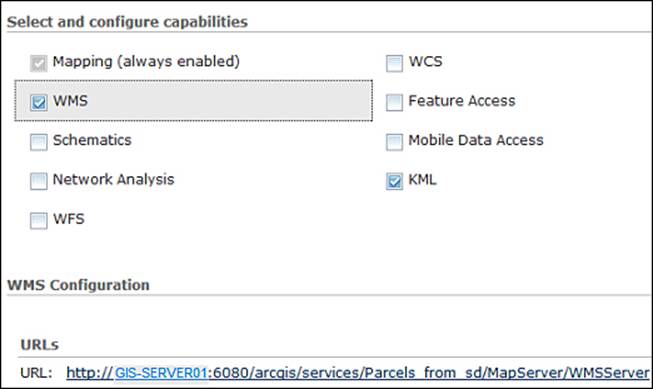
If, however, you published one of your map services as an OGC, like we did back in Chapter 2, Authoring Web Services, and you want to get the WMS link, you have to select the WMS capability as shown in the following screenshot:
Publishing the utility map service
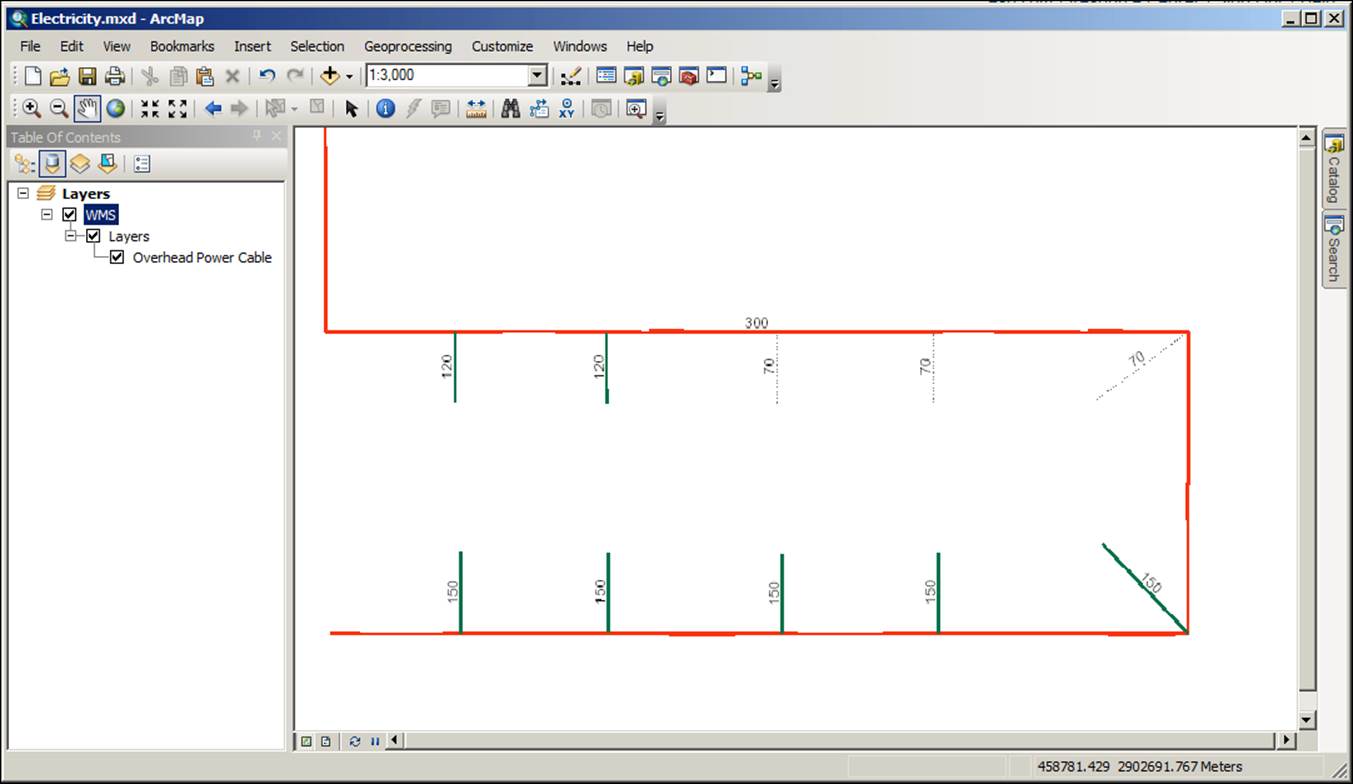
In the coming exercises, we will be using some utility data along with some other data that I have provided with the book. We need to publish and register the geodatabase using the same techniques we learned in Chapter 2, Authoring Web Services. Download the book data from www.packtpub.com; you will find the utility data in 7364EN_03_Files\AGSA\Data\Utility.gdb. Open the Electricity.mxd file in 7364EN_03_Files\AGSA\Documents. I have already done the symbology and labeling work for you, so you don't need to worry about that part. Go ahead and publish the Electricity map service and make sure to enable the OGC WMS capability. This is just the start; we will publish more services as we progress through the chapter.
Note
When you open the Electricity.mxd file, the source might be lost; simply set the overhead power cable layer to the UNC path \\GIS-SERVER01 \AGSA\Data\Utility.gdb\PowerCable feature class. To do that, you must first share the folder AGSA as we did back in Chapter 2, Authoring Web Services. This is the best way you can successfully register the folder.
The following screenshot shows the utility data we just added to the map:
Using GIS services for visualization
The first thing that comes to mind when you want to use a map service is how you can see it, visualize it, present it, browse through it, and look for patterns—in other words, how you consume it. There are many tools that allow you to visualize the GIS services that you author in ArcGIS for Server, we will inspect and try out a few of them, and you can pick your favorite based on your preferences. We will also tackle how to consume your map services from well-known APIs such as JavaScript API. Don't worry! You do not need polished programming skills to do this; everything is made easy with a few lines of code, and you can compile and run a complete web page hosting your map services.
Consuming services from the GIS software
Since map services follow certain standards, they can be consumed from any software. We will explore the out-of-the-box software that has the capability to read map services.
Using ArcMap
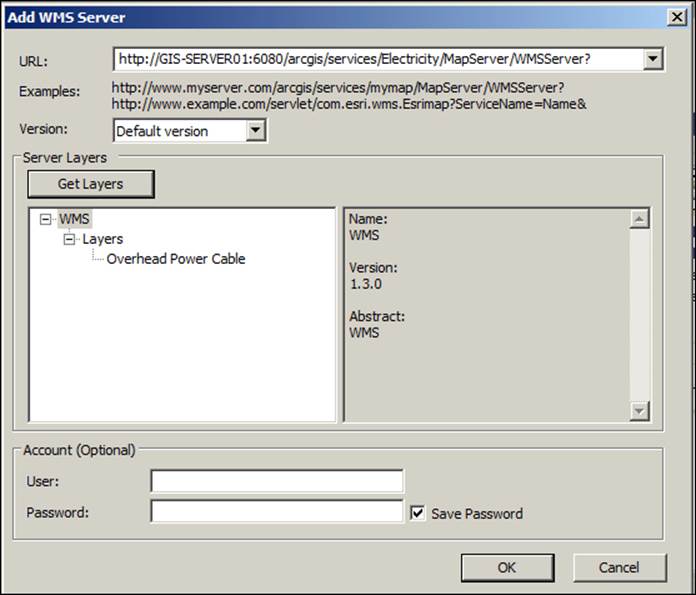
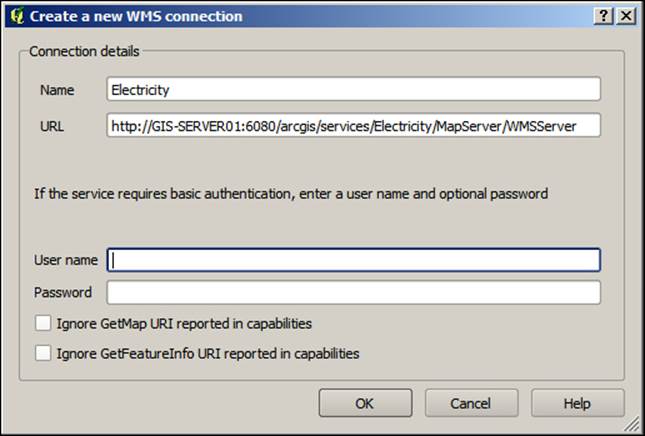
ArcMap is a great tool to author and consume services. Esri has invested so many resources in developing and perfecting ArcMap that it has become a consolidated geography toolset. It is Esri's cash cow. Sometimes, I like to call ArcMap the "geosmith" of the GIS ecosystem, as most of the work we need to do can be done with this software. If you recall, in Chapter 2, Authoring Web Services, we consumed a map service from ArcMap to test our data. To avoid replicating information, you can refer to Chapter 2, Authoring Web Services, and rework the exercise in the Testing the GIS services section. Reading an OGC service from ArcMap is not difficult: to do that, we will need a WMS service (which we just published) enabled. Let us go and fetch the WMS service URL for the Electricitymap service. To do that, we need to go to Manager, as we said before, and copy the WMS URL to the clipboard so you don't have to type the whole thing.
Open ArcMap and click on Add Data to add the utility WMS layer to the map. From Catalog Tree, select GIS Servers and then double-click on Add WMS Server. This will establish a connection with the WMS service. In the next form, paste or type in the WMS service URL for our Electricity service: http://GIS-SERVER01:6080/arcgis/services/Electricity/MapServer/WMSServer. Again, it is recommended that you use a dedicated Web server if you have installed a Web Adaptor thus avoiding to point explicitly to the GIS servers. Click on Get Layers to establish the connection; if the connection is successful, you will be able to add the layer to the map. Click on OK and rename the connection to Electricity@GIS-SERVER01. You just created a WMS connection on the fly. We will now use this connection to read the WMS service. The screenshot of the WMS configuration is as follows:
Note
You can create the WMS connection from ArcCatalog as well.
Double-click on the Electricity@GIS-SERVER01 connection you just created, select the Electricity service and click on Add. Refer the following screenshot:
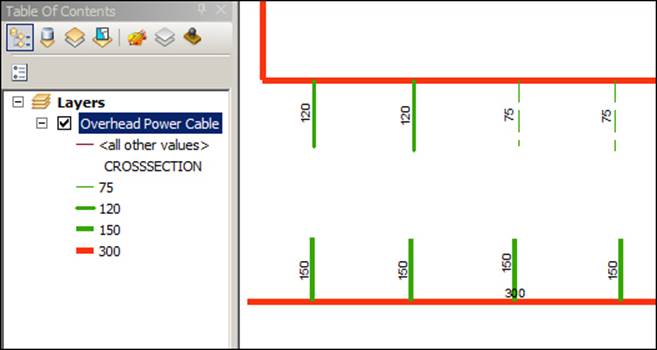
Now that we have added the utility layer as a WMS service, we can do basic zooming, panning, and even identifying. From the Tools toolbar, select the Identify tool and click on the red power cable to identify its attributes. You should get a small window with the basic attribute of that power cable. You can see that the voltage on the cable is 400 volts, and it is a large cable, around 300 mm2 in diameter, and more than a kilometer in length. Refer the following table:
|
OBJECTID |
SHAPE |
VOLTAGE_V |
CROSSSECTION_MM2 |
SHAPE_Length_M |
|
1 |
Polyline |
400 |
300 |
1441.9821 |
Using QGIS
We have managed to consume and browse the map services we authored in ArcMap; however, not everyone will have ArcMap to read this service. Plus, your map service is published in other formats, so it could be consumed by other software as well. There is plenty of GIS software out there, and many of these software are free, such as QGIS, GRASS, ArcGIS Explorer, gvSIG, and many others. My personal favorite is QGIS. We will be using this free software to browse our electric network on the WMS standard. QGIS is available on many platforms, including Windows, Linux, and Mac OS X. Recently, the team at QGIS compiled an Android version as well, so you can see how much time and resources have been spent on this product. QGIS supports WMS along with other OGC services. In this exercise, we learn how to use WMS service in QGIS and combine it with existing data. You can download QGIS Version 1.8 from www.qgis.org.
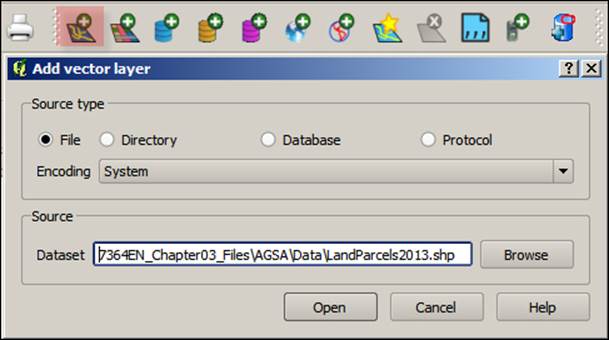
What you are about to do was an actual real scenario that I needed to resolve with one of my clients. Let us assume there are two departments, E and P, responsible for updating electric network and parcels respectively in separate geodatabases. Every time there is a new electric project, the department E checks for the latest parcels data in order to make the proper network design. Currently, E is getting parcels shape files on a yearly basis from the P department. So you can assume that the parcels might not be up to date. In this chapter data, you will find the file LandParcels2013.shp, which holds data for the land parcels in the year 2013. Let us assume you are an engineer at E and you are going to add the parcels shape file to QGIS to see if the new proposed electric project fits perfectly. Open QGIS, which you just installed, and on the toolbar, click on the Add Vector Layer button. From the Add vector layer form, select File and click on Browse to browse for LandParcels2013.shp in 7364EN_Chapter03_Files\AGSA\Data. Then, click on theOpen button to add the data as shown in the following screenshot:
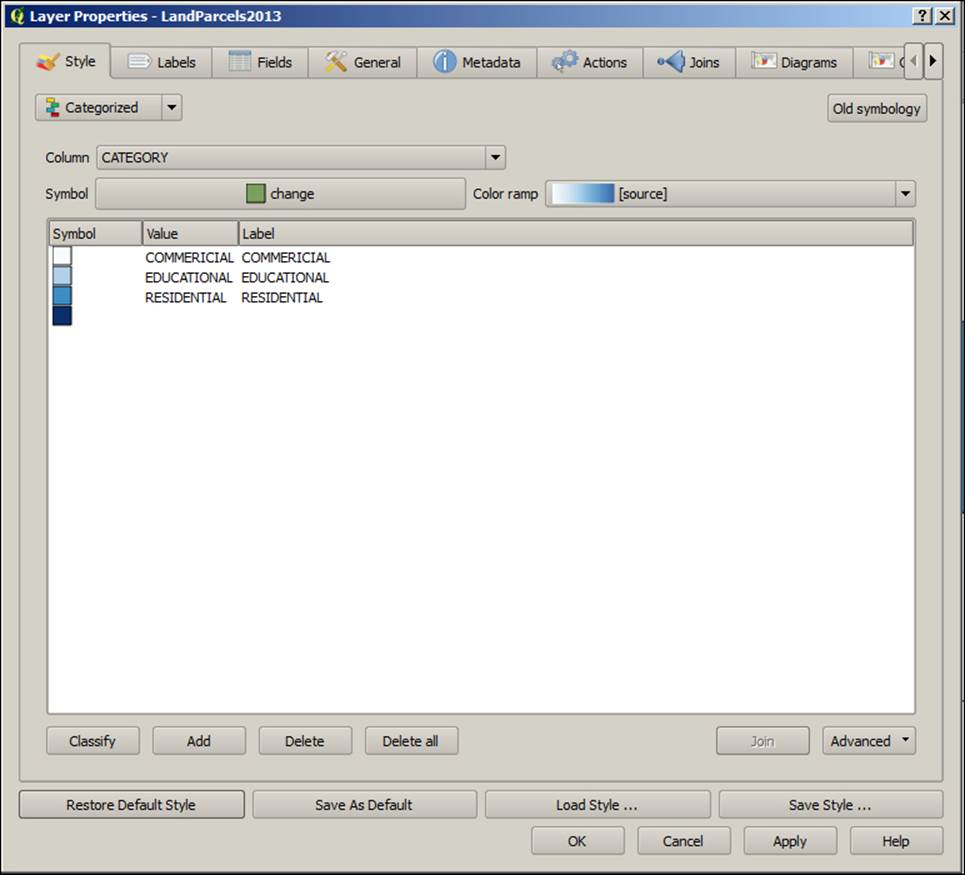
We need to do some work on this data, double-click on the LandParcels2013 layer, and the Layer Properties form will be displayed. In the Style tab, from the drop-down list which shows a single symbol, select Categorized. From the Column drop-down list, selectCATEGORY, and finally, from the Color ramp drop-down list, select the blue color. Click on the Classify button and then on the OK button as shown in the following screenshot:
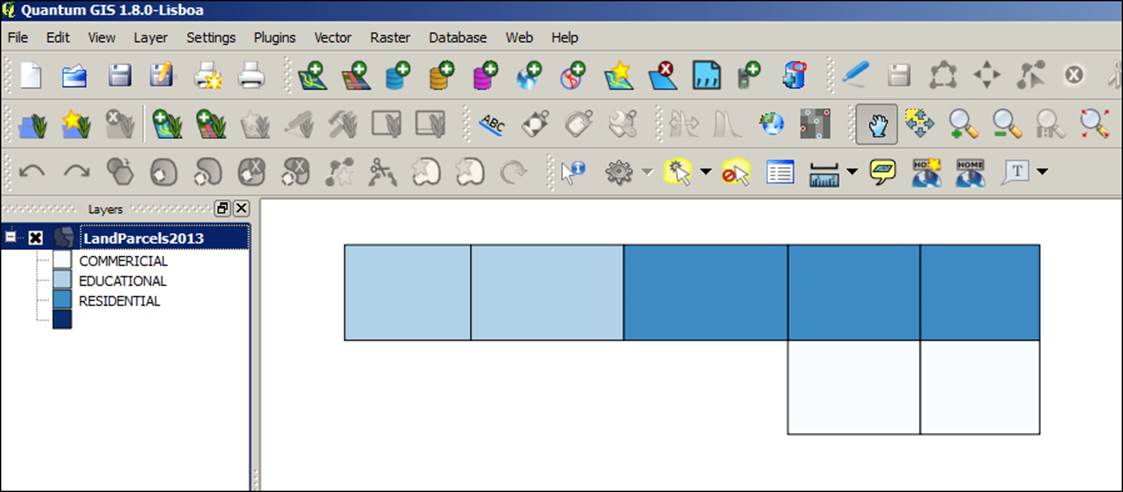
Once you do that, you will see that the symbology of the parcels changes to give each parcel a unique color, along with a legend, to describe it, as shown in the following screenshot:
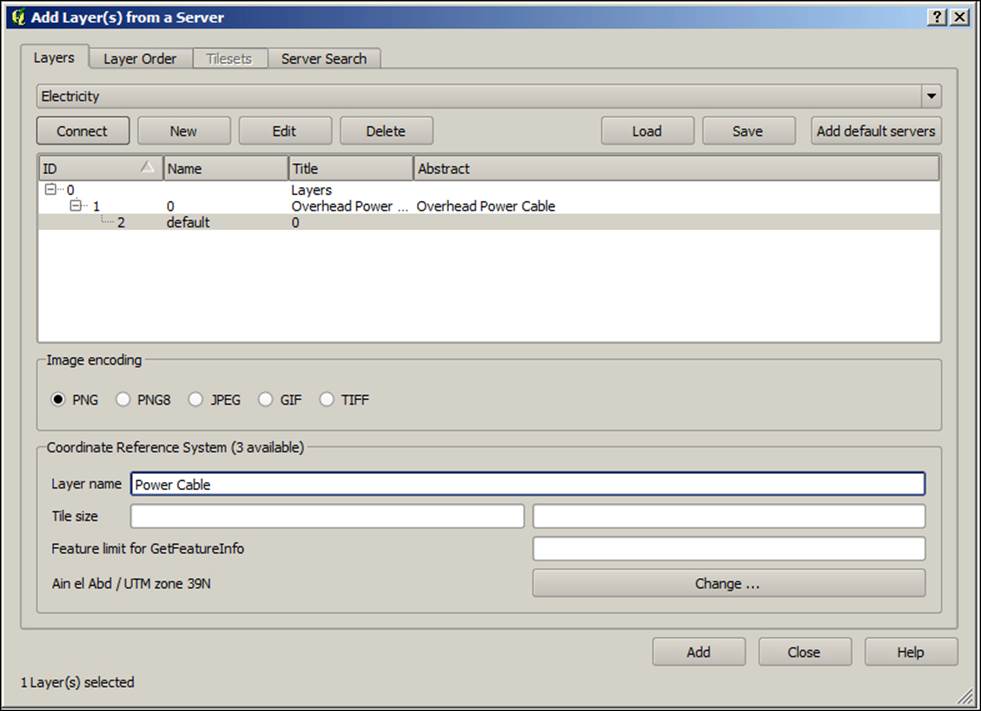
Now that we have the parcel data, we need to add our electric network to check it against the parcels to see if the wiring has been done properly or not. Fortunately, our latest data is already published as WMS, so let us add our electric network. From QGIS toolbar, click on the Add WMS Layer button; a form will be displayed. This form will have the list of all, WMS layers that you are going to add. In the Add Layer(s) from a Server form, click on New to add a new WMS layer, new form will pop up. In the Name field, type the name of the layer. Since we are adding an electricity layer, we will type Electricity in the Name field, and in the URL field, you can write your WMS URL that you got from ArcGIS for Server Manager in the beginning of this chapter. Leave the rest of the fields blank and click on the OK button, as shown in the following screenshot:
You will notice that the previous form will now have one layer in the drop-down list. Select Electricity from the drop-down list and then click on Connect to fetch the WMS layer information. From the tree view, select 0 as the layer ID (the ID column).
In the Image Encoding box, select PNG and then type Power Cable in the Layer name textbox. Finally, click on the Add button to add the layer to the QGIS map.
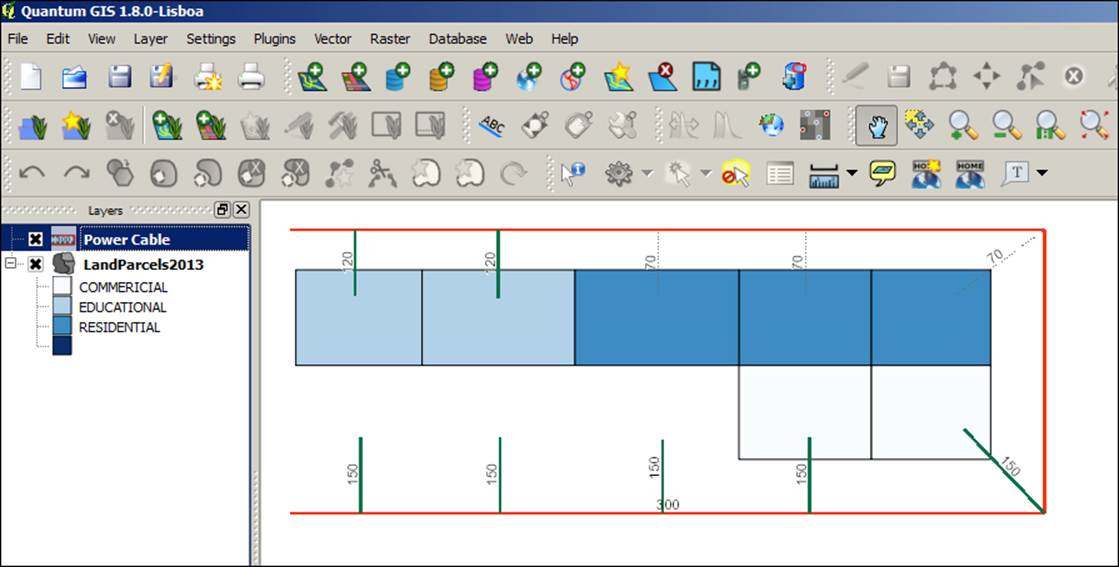
Now, you can see that the electricity layer has been added on top of the parcels, giving us a nice visual coloration to indicate which cable feeds which parcel. The following screenshot displays this representation:
Tip
Best practice
WMS server offers many image encoding schemes; you have to use the format that suits your application. Choose JPEG and PNG encoding if you want fast loading, and choose TIFF if you want high resolution.
Clearly, you can see that the parcels data is not up-to-date, as there are three power cables with no parcels. This means your electric network is more up-to-date than the parcels, so we have to ask the P department to send us the new Parcels shape file. Alternatively, we could convince them to publish their Parcels service as WMS so that we can just use that instead of shape files. Fortunately, back in Chapter 2, Authoring Web Services, you did publish the Parcels service as WMS, so you may now use it. Now, we have a live WMS service pointing to the latest up-to-date Parcels database from the URL http://GIS-SERVER01:6080/arcgis/services/Parcels_FGDB/MapServer/WMSServer. Let's add that to QGIS using the same approach and name it Parcels. Turn off the layerLandParcels2013 and drag the Power Cable layer above Parcels. You will see that you got the full and up-to-date Parcels data, and it turns out that the three power cables were feeding three large commercial stores that happen to have been registered recently.
Using Google Earth
Google Earth is one of the clients that ArcGIS for Server supports. Some like to use Google Earth for its updated satellite imagery as a reference to overlay their data. With ArcGIS for Server, you can publish your services as KMZ files, which can be rendered by Google Earth. First, we will publish a new map service with the KML capability, using the skills you acquired in Chapter 2, Authoring Web Services. Let us open the map document I created for you. You can find it here: 7364EN_03_Files\AGSA\Documents named US_States.mxd. If the document loses its source data, simply point it back to the corresponding data in 7364EN_03_Files\AGSA\Data\USS_states.gdb. Share the document as a map service and make sure the KML is enabled. Leave everything to its default and name the map service US_States.
Now, we need to get the KML URL, which will allow Google Earth to fetch the data. The URL should look as follows:
http://<SERVER>/arcgis/rest/services/<SERVICE NAME>/MapServer/Kml/mapImage.kmz
So our States service will be as follows:
http://GIS-SERVER01:6080/arcgis/rest/services/US_States/MapServer/Kml/mapImage.kmz
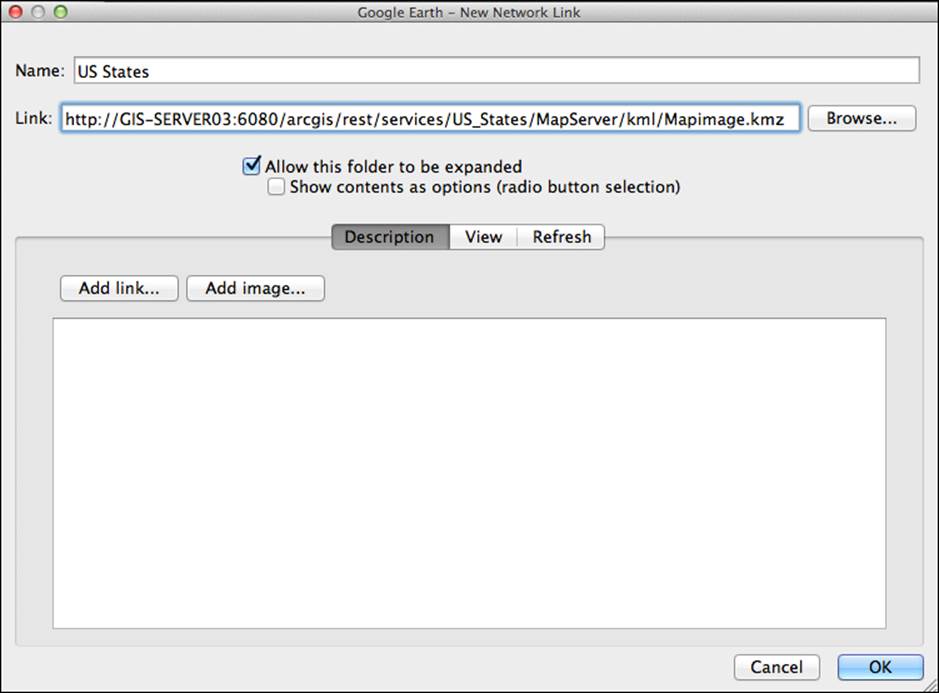
We are almost ready; we now need to run Google Earth. Download Version 7.1 at www.google.com/earth, install the software, and run it. From the Places pane on the left-hand side, right-click on My Places and point to Add menu, then click on Network Link. On the New Network Link form, type US States in the Name field and the URL in Link field and click on the OK button:
This will take a few moments until the KMZ file is downloaded and rendered by Google Earth. Once it is downloaded, you will start seeing it drawing on Google Earth.
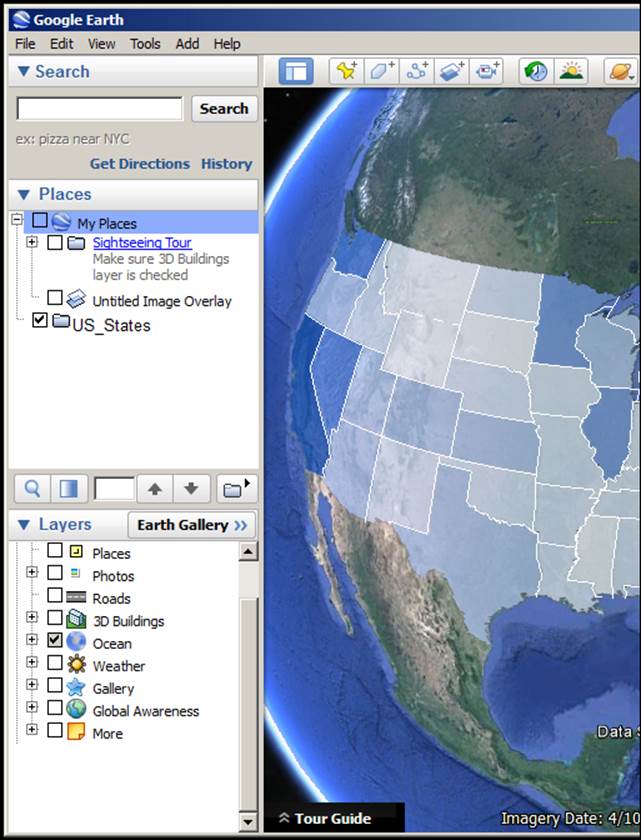
That looks good! You just added your map service on Google Earth. Think of all the applications that you could use this for. There is one more option we want to explore in Google Earth before we move on to the next section. Let us say you don't want to enable KML for security reasons, as you know KML files can be downloaded and shared offline. For that, you can either use KML network link or standardize your services and only permit the use of WMS service. Fortunately, Google Earth can consume OGC WMS services as well, so let us go back to the US States service in the ArcGIS Manager and enable the WMS capability. From the My Places section on the left-hand side under the Places pane, right-click on My Places and point to Add, then click on Image Overlay. In the pop-up form, type in US States WMS in the Name field and leave the Link field empty. Activate the Refresh tab and click on WMS Parameters. On the Web Mapping Service Parameters window, click on Add and then type in the WMS URL. Click on OK to commit the changes, and make sure the layer is under the selected layers. You will see the new WMS layer has been added on Google Earth.
Consuming services from APIs
We have published services and managed to find an out-of-the-box method to consume them without writing any lines of code, and that worked pretty well. However, there are times when you will need to write your own programs to consume your services. This is when you will use the APIs.
Winter is coming – the Flex and Silverlight APIs
There are several APIs that allow you to consume ArcGIS for Server services. Silverlight and Flex are two of the most used APIs that Esri invested in for years. Despite their ease of use and abundant resources, I will not be covering them in this book simply because they are not among the ascending technologies. They are also not supported on tablets and mobile devices and are alien to the new cloud technology, which is where everything is headed. They also require special plugins to run, while JavaScript runs natively on browsers. The debate between Silverlight and Flex versus JavaScript reminds me of how Homo Neanderthal and Homo Heidelbergensis went extinct because of us, Homo Sapiens. It might not be a fair comparison since the evolution of the latter spans millions of years as compared to these technologies; however, the three of these technologies spawned from the same web ecosystem, the Homo Erectus. Silverlight and Flex are technologies that have had their spring, and I believe it is more strategic for Esri to pour its time and resources into molding a full-fledged, rich JavaScript map viewer that developers can use and extend—the next ArcMap of the Web, the Web Geo Smith.
Using the ArcGIS JavaScript API
The ArcGIS JavaScript API uses a rich library built on top of Dojo, a JavaScript toolkit. This library allows clients to do so much more with maps. We will tackle two approaches to consume map services using the JavaScript API. The first one will be the online method; this is a simple method in which the JavaScript library is located on Esri servers, and it therefore requires an Internet connection to work. The second method is the offline method, where you will be able to download the library offline and run it without the need to connect to the Internet.
Online mode
Here, you will be able to use the JavaScript API. Make sure you have an Internet connection as we need to access the ArcGIS library necessary to render the map services that you are going to load. In this exercise, we will load the World data hosted by Esri on the REST URL http://server.arcgisonline.com/ArcGIS/rest/services/World_Topo_Map/MapServer into an HTML page using a few lines of JavaScript. The beauty of this is that all we need is a text editor, such as Notepad, and a web browser.
First, we will write the HTML file step by step, which will enable you to understand how the API works. Go ahead and open Notepad or your favorite text editor. I use Notepad++ since it is light, free, and supports many programming language syntaxes (you can download it from www.notepad-plus-plus.org). However, your Windows Notepad or Mac TextPad will do the same. Since we are writing an HTML file, we will start the basic HTML headers and skeleton as follows:
<html>
<header>
</header>
<body>
</body>
</html>
Save the file at 7364EN_03_Files\AGSA\Code and name it agsJS_Online_Mode.html. Now, we will add our first HTML element in which the map will be drawn; it is a div element. Let us call it MapCanvas; we should add that in the body tag:
<html>
<header>
</header>
<body>
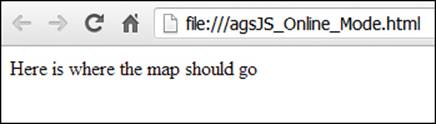
<div id ="MapCanvas">Here where the map should go</div>
</body>
</html>
Double-click on the HTML file to run it. Don't expect a map to pop up just yet. I just want to show you what you will get. You should get something like the following:
Note
ArcGIS JavaScript API is on Version 3.6 now, but I'm going to use 3.5 as it is more stable.
Let us continue to add code to the HTML file, but first remove the text in MapCanvas, add the reference to the JavaScript library, and add the script tag to the header element, as shown in the following code:
<html>
<header>
<script src="http://js.arcgis.com/3.5/"></script>
</header>
<body>
<div id ="MapCanvas"> </div>
</body>
</html>
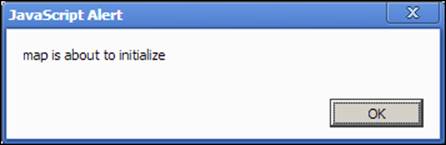
Still there is no map because this is just a reference; we need to use the functions in that library to create the map. Let us add another script tag; we will import the map library using the keyword dojo.require, and then we will add an empty function, startup. Using the keyword dojo.addonLoad, the script will call out startup function when the code is initialized successfully. To test this, we will add a small alert message in the startup function just to make sure things are working:
<html>
<header>
<script src="http://js.arcgis.com/3.5/"></script>
<script>
dojo.require("esri.map");
Function startup()
{
alert("map is about to initialize")
}
dojo.addOnLoad(startup);
</script>
</header>
<body>
<div id ="MapCanvas"> </div>
</body>
</html>
Open your HTML file, and you should see a small message box if JavaScript is enabled on your browser. The message box will look like the following screenshot:
Remove the alert code, and let us add the code you are waiting for. We will now create a map object and then add a layer to that map. The line map = new esri.Map() takes our div element, MapCanvas, and creates a map object which will hold the layers that we add to it. To create a layer, we need to create a ArcGISDynamicMapServiceLayer object that will take our REST URL and then render it as a layer. The last line is map.addlayer, which will add the layer to the map. As shown in the following code, I have also added some style to our canvas to force the map to draw in fullscreen mode:
<html>
<header>
<script src="http://js.arcgis.com/3.5/"></script>
<script>
dojo.require("esri.map");
function startup()
{
var map = new esri.Map("MapCanvas");
var layer = new esri.layers.ArcGISDynamicMapServiceLayer("http://server.arcgisonline.com/ArcGIS/rest/services/World_Topo_Map/MapServer");
map.addLayer(layer);
}
dojo.addOnLoad(startup);
</script>
</header>
<body>
<div id ="MapCanvas" style = "height: 100%;width:100%" > </div>
</body>
</html>
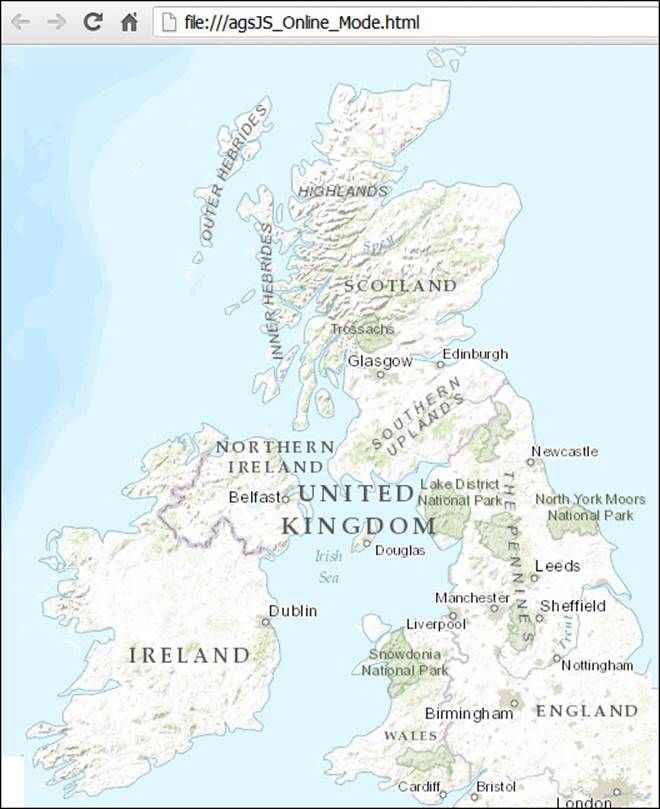
Run your code and you will finally see your map. You can add necessary effects to make your page look good. There are plenty of JavaScript API examples that can be found at resources.esri.com. You will see the following map after running the code:
You can use the same piece of code to load your local services; let us load our Parcels and Electricity REST map services. It is recommended that you use a dedicated Web server; however, it is ok to use the built-in Web server to get the URL. Either will work; refer to Chapter 2, Authoring Web Services, to learn the differences between the two.
Tip
Best practice
Remember it is recommended that you use a dedicated Web server when you expose your services so that you can utilize the power of your GIS servers.
This following code will allow you to view both services:
<html>
<header>
<script src="http://js.arcgis.com/3.5/"></script>
<script>
dojo.require("esri.map");
function startup()
{
var map = new esri.Map("MapCanvas");
var parcelsLayer = new esri.layers.ArcGISDynamicMapServiceLayer(
"http://WEB-SERVER01/wa/rest/services/Parcels/MapServer"
);
var electriclayer = new esri.layers.ArcGISDynamicMapServiceLayer(
"http://WEB-SERVER01/wa/rest/services/Electricity/MapServer"
);
map.addLayer(parcelsLayer);
map.addLayer(electriclayer);
}
dojo.addOnLoad(startup);
</script>
</header>
<body>
<div id ="MapCanvas" style = "height: 100%;width:100%" > </div>
</body>
</html>
And the output of this code will be as follows:
Offline mode
Most organizations don't allow Internet access on their servers for security reasons, they run everything off the intranet. In this case, the online mode for JavaScript API development will not be of use. There is a way to download the ArcGIS JavaScript API library and reference it on your websites; we will learn how to do that in this section. Before you start, make sure you install IIS—if you haven't done that already. You can use your Web server, WEB-SERVER01, which you can find at the 7364EN_03_Files\AGSA\jsapi35 folder. Copy the folder arcgis_js_api to c:\inetpub\wwwroot and then open your text editor and write the same code you used in online mode. We will make a slight change to the reference: we will point to the library we just copied to WEB-SERVER01.
Note
You can replace WEB-SERVER01 with GIS-SERVER01 if you are using the express installation; just make sure that IIS is installed and that the path c:\inetpub\ is valid.
<html>
<header>
<script src="http://WEB-SERVER01/arcgis_js_api/library/3.5/3.5/init.js"></script>
<script>
dojo.require("esri.map");
function startup()
{
var map = new esri.Map("MapCanvas");
var parcelsLayer = new esri.layers.ArcGISDynamicMapServiceLayer(
"http://WEB-SERVER01/wa/rest/services/Parcels/MapServer"
);
var electriclayer = new esri.layers.ArcGISDynamicMapServiceLayer(
"http://WEB-SERVER01/wa/rest/services/Electricity/MapServer"
);
map.addLayer(parcelsLayer);
map.addLayer(electriclayer);
}
dojo.addOnLoad(startup);
</script>
</header>
<body>
<div id ="MapCanvas" style = "height: 100%;width:100%" > </div>
</body>
</html>
Save the file to c:\inetpub\wwwroot and name it agsJS_Offline_Mode.html. To run the page, open Chrome, type the following, and hit Enter:
http://WEB-SERVER01/agsJS_Offline_Mode.html
You can now access this URL from any machine in the same network to browse your map services. If you are connected to Wi-Fi, you can even browse it from your mobile or tablet. I have provided you with the two files agsJS_Online_Mode_Original.html andagsJS_Offline_Mode_Original.html. You can find them at 7364EN_03_Files\AGSA\Code. They have slightly more code to adjust the layout, and they use a bit of Cascade Style Sheets (CSS), styles used in HTML documents.
Using GIS services for editing
Editing GIS services is challenging. It requires some steps, and unfortunately, there is no single well-documented and consolidated resource that discusses this section. Therefore, I made this section as detailed as possible. Editing data through a GIS service is useful in many scenarios. I can think of a scenario where this might prove to be of use; let us take the case of incident reporting. If you find something in the road—a blown main pipe or a sparking power cable—you would want to report it immediately as you really don't have the time to drive to the office and connect to your geodatabase where your data is stored and start editing incidents then. It would be much more efficient if you were able to directly access your geodatabase from your laptop, or smart phone while you are on the site, add the incident, and sync it with the geodatabase. A GIS service that can be edited is called a feature service. In this section, we will create a new feature class on an enterprise geodatabase, publish a feature service, and then edit it in ArcMap.
Prerequisites
There are a number of things you need before you can edit a feature service. First of all, you should know that you cannot edit a feature service that is pointing to a personal geodatabase; your database should be an enterprise SDE geodatabase. I have an SQL Server enterprise geodatabase; you may also use PostgreSQL, which can be downloaded for free at www.postgresql.org. Next, it is recommended that you use database authentication instead of operating system authentication or else you will run into problems. Database authentication can be controlled, whereas operating system authentication, while effective, requires all GIS servers to have operating system authentication access to the database. This might not always be the case and you will run into problems while registering the data store. Lastly, your geodatabase should be registered in the ArcGIS for Server data store, and your data should be registered as versioned in the SDE, with options to move edits to the base. We will now perform all these steps.
Setting up the SDE geodatabase
First, we need to create the database user that will be able to connect to and edit the geodatabase. If you already have an SDE geodatabase ready, you may skip this step. Log in to your enterprise geodatabase server—mine is SDE-SERVER01—and open SQL Server Management Studio, connect using the sa user or any user that have database administrator privileges. The sa user is created by default when you install the SQL Server. From the Object Explorer tree view, expand the Security folder and then right-click onLogins and select New Login; this will pop up a new window. In the Login name field, type agsEditor and select SQL Server authentication. Type the password in the Password and Confirm password fields, and make sure to uncheck the Enforce password policy if you are not worried about sophisticated passwords right now. From the Default database drop-down list, select your geodatabase, which should be SDE. On the Select a page list, click on User Mapping to set the permissions and select the SDE database to map it. From the Database role membership window for SDE, check db_datareader and db_datawriter so you give read and write access to the user agsEditor. Lastly, we will perform one more temporary step; we will assign agsEditor to the sysadmin server role so the user can manage the geodatabase. Click on Server Roles and check the sysadmin role and click on OK to save.
Note
The sysadmin server role is assigned so the agsEditor user can also create a feature class; you will need it in this exercise. However, if your feature classes are already created, you may revoke it safely.
Connecting and registering the SDE geodatabase
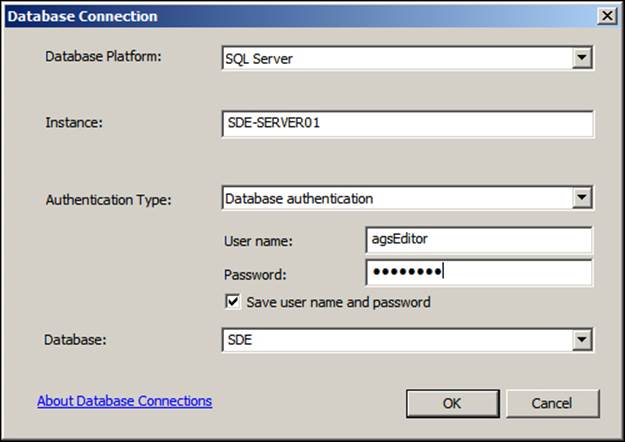
If you already have an enterprise geodatabase set up, make sure you have the agsEditor user with read/write privileges and you will be ready. Go to your publisher machine, GIS-SERVER01, or the machine that has an ArcGIS for Desktop installation so that we can connect to the geodatabase. Make sure you have your 64-bit DBMS client installed on this machine and every other GIS server, as discussed in the previous chapters. Open ArcCatalog; from the Catalog Tree menu, expand the Database Connections option and double-click on Add Database Connection to create a new connection. In the Database Connection window, select SQL Server from the Database Platform drop-down list and type in the Instance field the geodatabase server name—SDE-SERVER01—of your SDE server. You can use the IP Address here as well. In the Authentication Type drop-down menu, select Database Authentication and type in the database credentials of the user profile we have just created. Then, select SDE from the Database drop-down list so we connect to this database. In case you have multiple geodatabases on your server, click on OK and rename the connection to agsEditor@SDEServer.
Note
If you are using a database other than SQL Server, select it from the Database Platform dropdown.
Now, it is time to register the geodatabase in the data store, we did this exercise back in section Registering with an enterprise geodatabase in Chapter 2, Authoring Web Services. Use the agsEditor@SDEServer SDE file to register this connection in the Server data store. Now, we need to create the feature class that we will edit; this is the Incidents feature class. It is a point feature class that we will use to log incidents in our geodatabase. The feature class is already created for you, so you can simply copy and paste it in your geodatabase. From ArcCatalog, connect to the book data folder 7364EN_03_Files\AGSA\Data, double-click on the Incidents file geodatabase, and then right-click on the Incidents feature class and click on Copy. Go to agsEditor@SDEServer and double-click on the connection to open it; right-click on it and paste the feature class there. Now, we need to enable versioning on our feature class so we can edit it; to do that, right-click on the Incidents feature class, select Manage and then click on Register As Versioned. This will enable editing on this feature class. A new window will pop up, and you should check the option Register the selected objects with the option to move edits to base and then click on OK. This option is necessary so that any edits are moved directly to the base tables instead of waiting for an SDE compress operation to do it.
Publishing a feature service
We took some time to set up the enterprise geodatabase. We are now ready to publish our feature service, and we need to Geo Smith for that. Open ArcMap and click on Add Data to add the Incidents feature class by connecting to agsEditor@SDEServer. We will now create a feature template. These are templates introduced in ArcGIS 10 and allow the editor to save a template of a feature with values and symbology and use it to simplify the editing process. The feature template will be used later to edit the feature service. From ArcMap, activate the Editor toolbar and click on Start Editing. From the Create Feature dockable window, double-click on the Incidents template; this is the default template created, and we will change it. Name the template Power Surge and change the symbology to match the next figure.
Tip
To do
From the Manage Templates window, create another template for water leaks.
Now that we have a template ready for editing, let us publish this map. Give it the name Incidents_FS and make sure you have registered the geodatabase in the Server site data store before you continue, or you will run into problems. In the Service Editor window, click on Capabilities and check the Feature Access option. Click on Publish and this will publish our service as a feature service. You can imagine that a feature service will have a unique URL as well, which differs from the map service URL.
Note
Alternatively, you can use the Incidents.mxd file, which I already created with the symbology and feature templates. However, you have to set the data source to your local enterprise geodatabase service.
Editing feature services using ArcMap
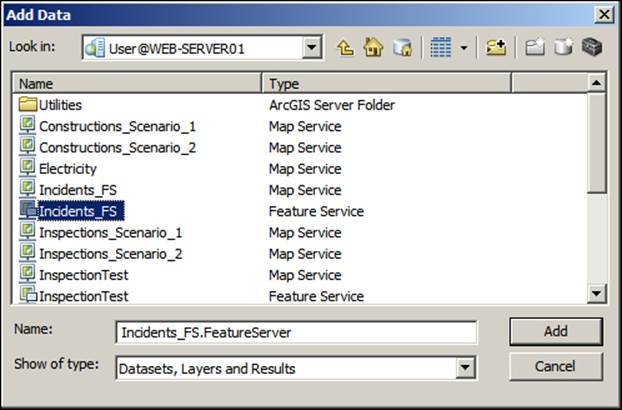
We have successfully published the feature service. Now it is time to put it to use and start editing it. Open ArcMap and click on Add Data. Connect to your Server site and add the Incidents_FS feature service. You will notice two instances of Incidents_FS: one will be a Map Service type, and the second one will be a Feature Service type. Make sure to select the Feature Service type and also make sure to add the Parcels and Electricity map services.
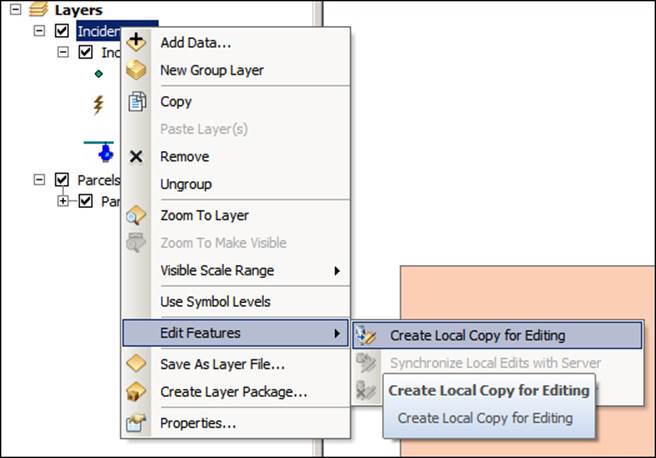
Unfortunately, while working with feature services, you can't just start editing from the editor toolbar and start working. To edit a feature service, ArcGIS for Server should copy a portion of the data in the current extent locally. We can start working normally on this local data after our work is finished and saved. We run a process called synchronization to synchronize our edits with those in the feature service. Now that this is explained, let us start. In the Table of Content window in ArcMap, right-click on the Incidents_FS group layer—which holds the feature service—and point to Edit Features. Then, click on Create Local Copy for Editing, as shown in the following screenshot. This will create a file geodatabase locally for you to edit.
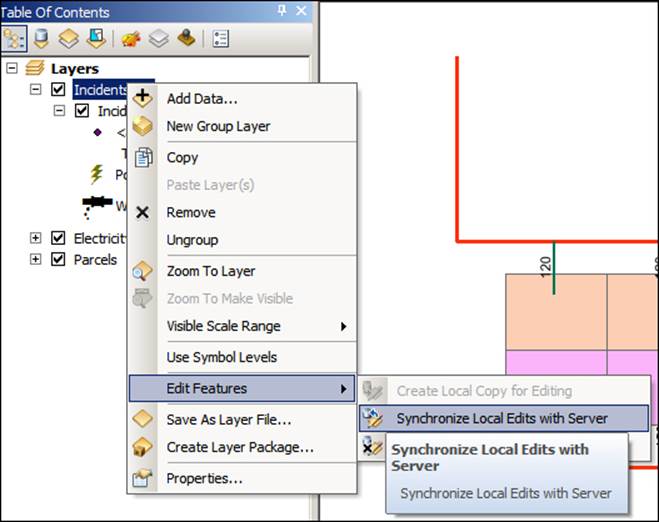
Now that the source of your Incidents_FS group layer is now set to a local file geodatabase, point to the editor toolbar and click on Start Editing. Add a Power Surge feature on the power cable and add a Water Leak feature near any house. From the editing toolbar, click on Save Editing and then on Stop Editing. To synchronize the edits back with the feature service, right click on the Incidents_FS group layer, point to Edit Features, and then click on Synchronize Local Edits with Server.
You have just created a feature service and edited it successfully in ArcMap. To test it further, get a laptop and install ArcGIS for Desktop on it. Connect it to the LAN, and try editing the feature service from there. You will notice that you do not need to have the geodatabase clients installed on the machine you are editing, which makes this a portable solution. If you do not have access to the Server site, you still can edit your data with the option Disconnect local copy from Server. With this, you can take your laptop to the field, edit there, and then return to the office to reconnect to Server and sync your edits.
Using GIS services for analysis
We have learned how to visualize our services, overlay more than one service together, and even write code to consume the services. Now, we need to put these services to use. We will do this by asking a question and trying to answer it by analyzing the different map services and trying to use the power of GIS. Put on your detective hat and let us start!
Prerequisites
Before we start, we need to publish some more new map services, Inspection, Construction, and Outage for each scenario. You can find their map documents at Chapter03\Code\7364EN_03_Files\AGSA\Documents. The Inspections_Scenario1, Inspections_Scenario2,Outage_Scenario1, and Outage_Scenario2 files can be located in the Utility geodatabase, while Constructions_Scenario1 and Constructions_Scenario2 are polygon feature classes that can be found in the Projects geodatabase.
Tip
To do
Publish the map documents Constructions_Scenario_1.mxd, Constructions_Scenario_2.mxd, Inspections_Scenario_1.mxd, Inspections_Scenario_2.mxd, Outage_Scenario_1.mxd, and Outage_Scenario_2.mxd as map services with default settings. If the source of the data is lost, set it to the UNC path of the corresponding geodatabase.
We will now use these services in our analysis. You can use ArcMap or Quantum GIS for analysis; I will be using ArcMap.
Finding the outage cause – scenario 1
You have been assigned the task analyzing the call logs of customers with electricity outages and trying to find the cause of the outages. When a customer reports an outage, the Outage Management System (OMS) will automatically record their call and update the outage database with the timestamp. The outages are already available as a real-time map service, which you can use to analyze the outages. In this scenario, there have been three outages on the electric network on the same area and you are asked to find the cause. The inspections and projects departments have given you access to their live data to help you with the analysis.
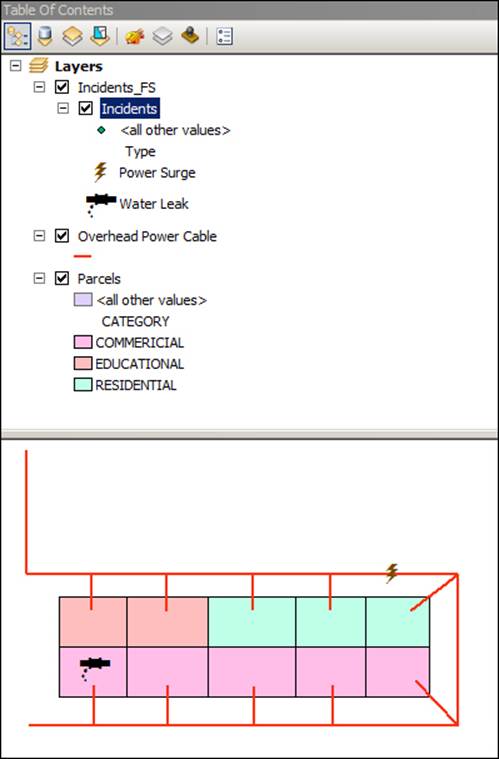
First, we need to create a user connection to our Server site, which hosts all the map services we need. This connection will provide us with a read-only view of our services. You may refer to the Testing the GIS Services section of Chapter 2, Authoring Web Services, which explains how to accomplish this. Open ArcMap and click on Add Data to add our services. Then, open your Server site connection and add these map services to your map to start the analysis: Electric, Parcels, and Outage_Scenario_1. On the Toolstoolbar, click on Full Extent to zoom to the full extent of the data. Then, drag the layers in the order Outages, Electricity, and Parcels to the bottom so the layers will be drawn in the correct order. Your map should look like the following screenshot:
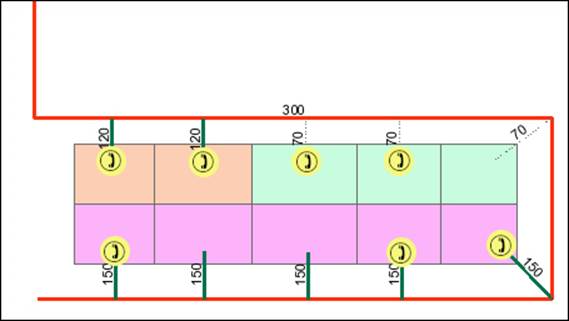
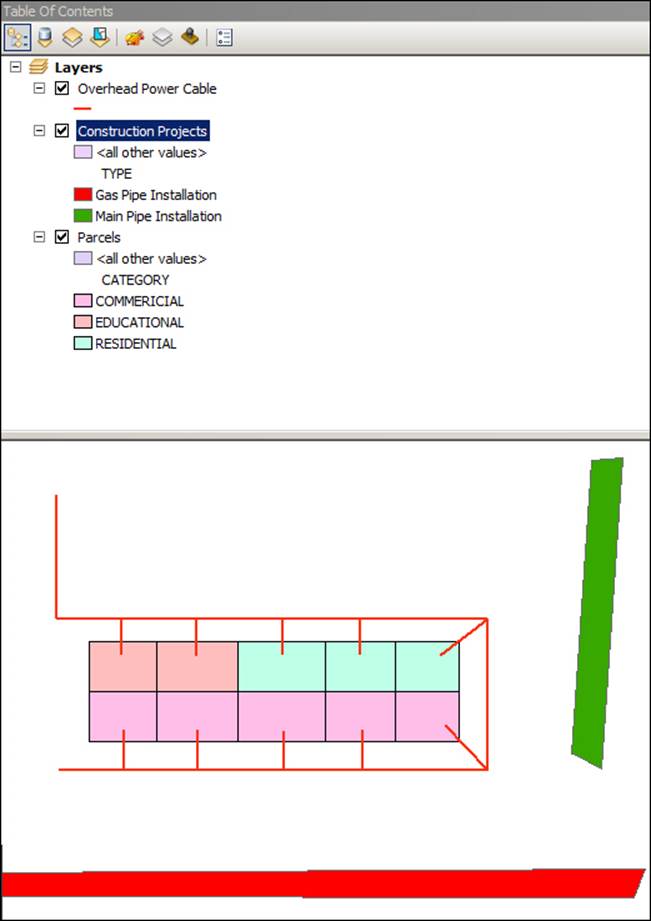
Note that there are a number of outages spread along the power cable and remember that all of them may not be represented here. There may be other outages that were not reported simply because the owner is not at home. We have to work with what we have and try to find the fault. From the magnitude of the outages, they all seem related to a single cause. If it is a single outage, we can narrow it down to the house itself. Therefore, we need more data to help us in our analysis. We will start by checking whether there are any other projects in the area that might have caused this. Go ahead and add the Constructions_Scenario_1 map service, which you can get by connecting to the projects department Server site (in this case, it is basically the same Server site).
There are two construction projects in the area. As you can see, they are far from our electric network (as shown in the following screenshot), so it is unlikely that they are the cause of the problem.
Since there are no projects in the area, let us see if there were any recent inspections; for that, we call the inspections department to provide us with a map service of their latest inspections. Fortunately, we have this. Let us add it, connect to the inspection department Server site and add the Inspections map service to the map, as shown in the following screenshot. From what we can see, there is one inspection in progress. If you use the Identify tool to check the type of inspection, you will find that it is a routine substation maintenance, which is most probably the cause of all the outages in this area.
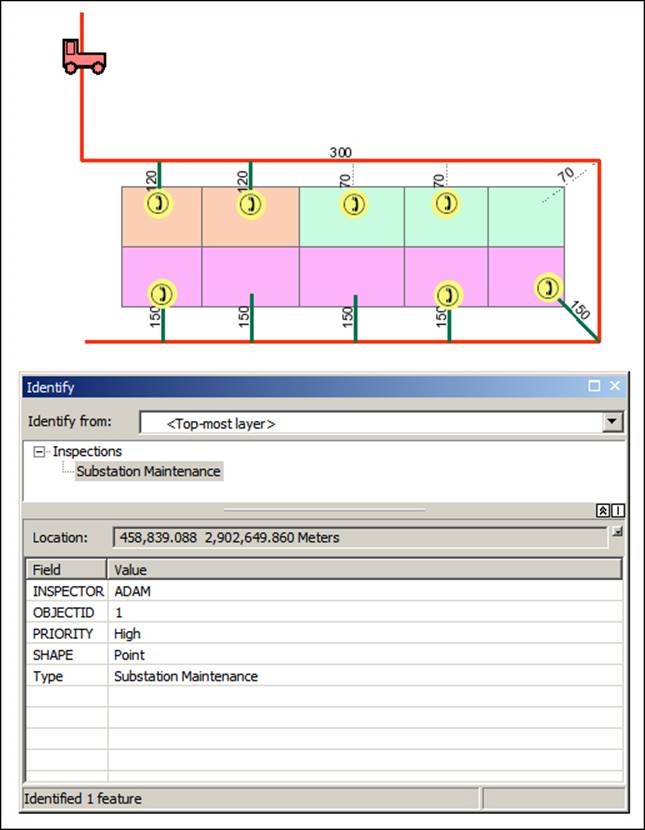
Problem solved! Let us dispatch a message to all customers to inform them that there is maintenance work going on in their area and it should wind up within the next hour. Here you can see how we quickly used multiple map services to analyze and solve a real-life problem. Let us move to the second scenario.
Finding the outage cause – scenario 2
In the first scenario, we managed to identify the reason behind the outages swiftly with the use of map services. Open ArcMap and click on Add Data to add our services. Open your Server site connection and add these map services to your maps to start the analysis: Electric, Parcels, and Outage_Scenario_2. From the Tools toolbar, click on Full Extent to zoom to the full extent of the data. Then, drag the layers in order Outages, Electricity, and Parcels to the bottom so the layers will be drawn in the correct order. According to the OMS outage log, it is clear that five adjacent commercial locations have been hit with an unknown, major outage, The rest of the houses seem to be running normally. You are asked to find out what caused the outage. The following screenshot illustrates the outage:
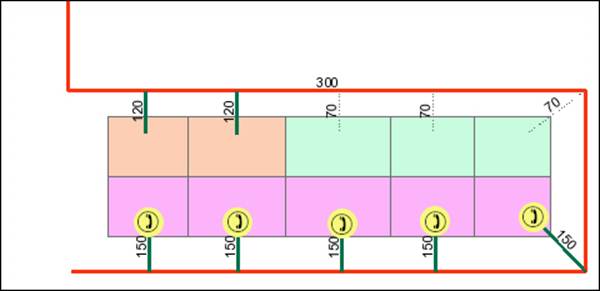
Since an inspection caused the previous scenario, let us check whether this scenario is also due to an inspection. Connect to the inspections Server site and add the Inspections_Scenario_2 map service and take a close look at the result:
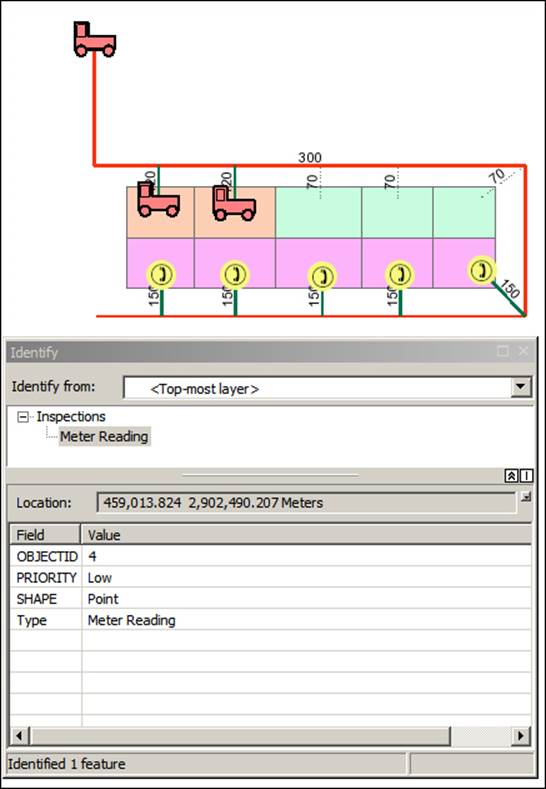
It looks like there are some inspections in the area. If you use the Identify tool, you will see that they are low-priority meter readings and are on the other side of the outage: they couldn't possibly have caused this outage. There must be something else that caused it. Since we have access to the projects data, we can add the Constructions_Scenario_2 map service to add the construction data; let us resume our analysis.
This must be the cause as there is a huge main pipe installation construction project running on the right-hand side of our electric network. This excavation may have caused one of the overhead power cable poles to fall, thus damaging the power cable and affecting all the customers fed downstream.
Meanwhile, on the GIS servers
There is a lot going on while we were consuming these services; let us take a moment to explore that. All the work we have been doing—whether it was visualizing, editing, or analyzing—is being done on the GIS servers. The GIS servers eventually receive the REST or SOAP request and process it. For instance, we always used a URL to connect to the Server site in the visualization section. The Server site then determines, based on history, which GIS server from the list of machines registered to the site is available and forwards the request to it. The GIS server then processes the request: if the request was to zoom in to a particular parcel, the GIS server queries the geodatabase, fetches the data within that extent, and then draws the map based on the selected protocol or standard. Whether to return it as a PNG image, KML, or SOAP XML is all based on the specified protocol. It is important to note that when a user is trying to connect to a map service using a hard REST URL, such as http://GIS-SERVER01:6080/arcgis/, which points directly to one of the GIS servers. The GIS-SERVER01 is playing two roles here: that of a Web server that connects to the Server site and fetches the site configuration, and that of a GIS server to crunch the request. Therefore, if GIS-SERVER01 is down, busy, or unreachable for any reason, the user has to wait although the Server site might have other GIS servers free. That is why I keep reminding you to use a dedicated Web server—something like http://WEB-SERVER01/arcgis/—so that the request is properly load balanced. We will have plenty to discuss about that in Chapter 6, Clustering and Load Balancing.
Summary
This chapter was full of practical exercises. You have done a lot of work with Server by now and know how powerful this product is. You now know how to consume the services you created in Chapter 2, Authoring Web Services, for visualization, editing, and analysis. You have used different GIS clients to consume these services and you have even written your own code to achieve that. You can see how diverse ArcGIS for Server is. You have data lying on your database, and Server allowed you to expose your GIS data to services supporting multiple standards and protocols. This made them capable of being used conveniently from multiple end points.
In the next chapter, we will discuss how to plan and design GIS services by analyzing their requirements.
All materials on the site are licensed Creative Commons Attribution-Sharealike 3.0 Unported CC BY-SA 3.0 & GNU Free Documentation License (GFDL)
If you are the copyright holder of any material contained on our site and intend to remove it, please contact our site administrator for approval.
© 2016-2026 All site design rights belong to S.Y.A.