Learning Ceph (2015)
Chapter 8. Monitoring Your Ceph Cluster
Ceph cluster monitoring is one of the prime responsibilities of Ceph storage administration. Monitoring plays a vital role in troubleshooting cluster and fixes the problem when a cluster is unhealthy.
In this chapter, we will cover the following topics:
· Monitoring a Ceph cluster
· Monitoring MON and MDS
· Monitoring OSD and PG
· Open source dashboards for Ceph such as Kraken, ceph-dash, and Calamari
Monitoring a Ceph cluster
Monitoring is one of the most important responsibilities for a storage administrator. System monitoring usually comes after cluster designing, deployment, and service implementation. As a storage administrator, you will need to keep an eye on your Ceph storage cluster and find out what's going on at any given time. Regular and disciplined monitoring keeps you updated with your cluster health. Based on monitoring notifications, you will get a bit more time to take necessary actions before service outages. Monitoring a Ceph cluster is an everyday task, which includes monitoring of MON, OSD, MDS, and PG, storage provisioning services such as RBD, radosgw, and CephFS, and Ceph clients. Ceph comes with a rich set of native command-line tools and API to monitor these components. In addition to this, there are open source projects, which are intentionally developed to monitor Ceph clusters on a GUI one-view dashboard.
Monitoring has a wider scope, which should not be limited to the software layer of Ceph. It should be extended to the underlying infrastructure, including hardware, networking, and other related systems which power your Ceph cluster. Usually, the manufacturer of these hardware systems provides a rich monitoring interface, which may or may not involve cost. We recommend you to use such tools for system monitoring at an infrastructure level. Remember that the more stable your underlying infrastructure is, the better results you can get out of your Ceph cluster. We will now focus on Ceph-based monitoring tools as well as some other open source projects for monitoring. Ceph comes with powerful CLI tools for cluster monitoring and troubleshooting. You can use the ceph tool to monitor your cluster.
Checking cluster health
To check the health of your cluster, use the ceph command followed by health as the command option:
# ceph health
The output of this command will be divided into several sections separated by semicolons:

The first section of the output shows that your cluster is in the warning state, HEALTH_WARN, as 64 placement groups (PGs) are degraded. The second section shows that 1,408 PGs are not clean, and the third section of the output shows that cluster recovery is in process for one out of 5,744 objects and the cluster is 0.017 percent degraded. If your cluster is healthy, you will receive the output as HEALTH_OK.
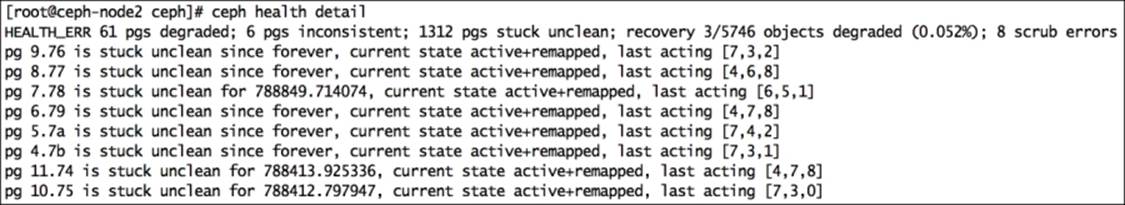
To know the health details of your Ceph cluster, use the ceph health detail command; this command will tell you all the placement groups that are not active and clean, that is, all the PGs that are unclean, inconsistent, and degraded will be listed here with their details. If your cluster is healthy, you will receive the output as HEALTH_OK. The following screenshot shows the health details of ceph:
Watching cluster events
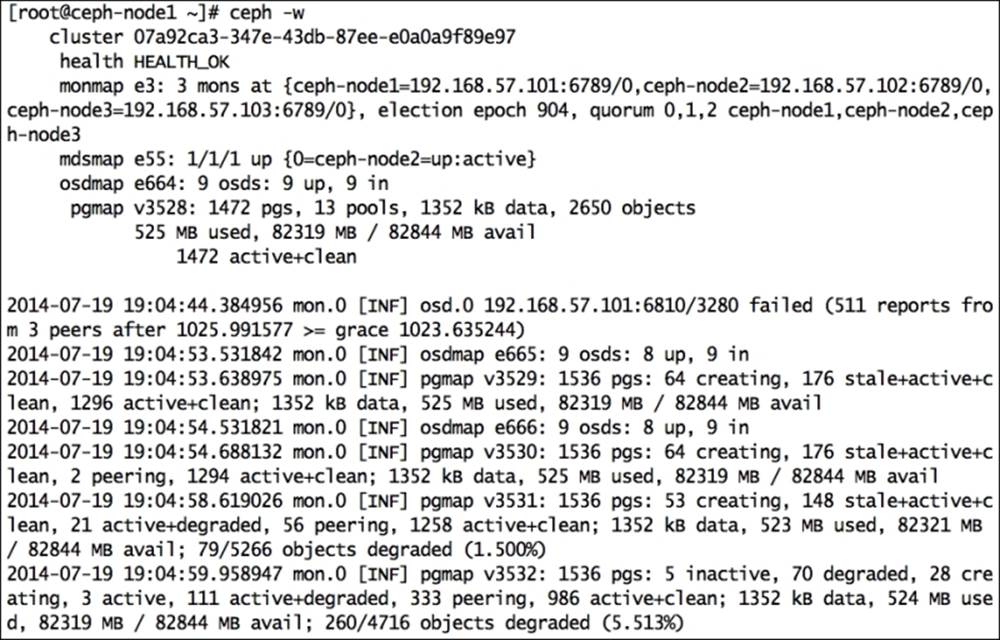
You can monitor cluster events using the ceph command with the -w option. This command will display all the cluster events, including INF (information), WRN (warning), and ERR (errors), in real time. This command will generate a continuous output of live cluster changes; you can use Ctrl + C to get on to the shell:
# ceph -w
There are other options as well that can be used with the ceph command to gather different types of event details:
· --watch-debug: This is used to watch debug events
· --watch-info: This is used to watch info events
· --watch-sec: This is used to watch security events
· --watch-warn: This is used to watch warning events
· --watch-error: This is used to watch error events
Cluster utilization statistics
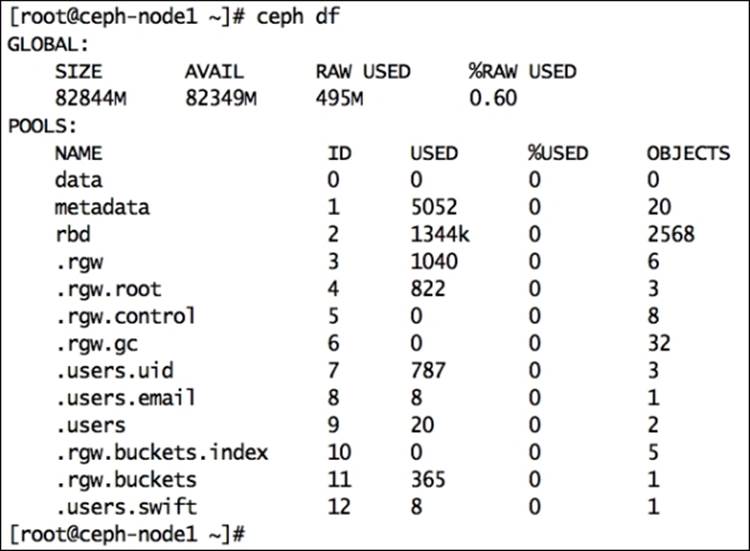
To know your cluster's space utilization statistics, use the ceph command with the df option. This command will show the total cluster size, available size, used size, and percentage. This will also display pool information such as pool name, ID, utilization, and number of objects in each pool:
# ceph df
Checking the cluster status
Checking the cluster status is the most common and frequent operation when managing a Ceph cluster. You can check the status of your cluster using the ceph command and the status option. Instead of the status subcommand, you can also use a shorter version,-s, as an option:
# ceph status
Alternatively, you can use:
# ceph -s
The following screenshot shows the status of our cluster:
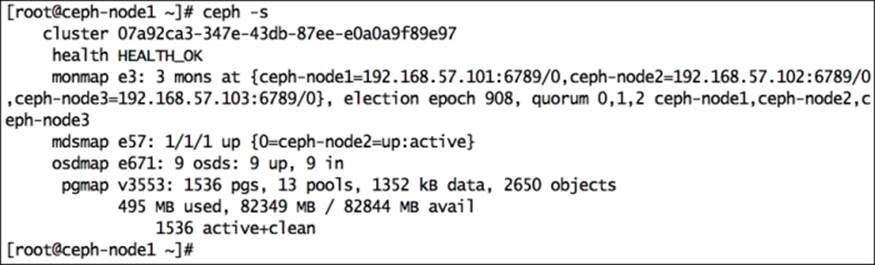
This command will dump a lot of useful information for your Ceph cluster. The following is the explanation:
· cluster: This represents the Ceph unique cluster ID.
· health: This shows the cluster health.
· monmap: This represents the monitor map epoch version, information, election epoch version, and quorum status.
· mdsmap: This represents the mdsmap epoch version and status.
· osdmap: This represents osdmap epoch and OSD's UP and IN count.
· pgmap: This shows the pgmap version, total number of PGs, pool count, and total objects. It also displays information about cluster utilization, including the used size, free size, and total size. Finally, it displays the PG status.
In order to view the real-time cluster status, you can use ceph status with Unix's watch command to get a continuous output:
# watch ceph -s
Cluster authentication keys
Ceph works on a strong authentication system based on keys. All cluster components interact with one other once they undergo a key-based authentication system. As a Ceph administrator, you might need to check key lists managed by clusters. You can use theceph command with the auth list subcommand to get a list of all keys:
# ceph auth list
Note
To know more about command operations, you can use help as a suboption, for instance, # ceph auth --help. Use the command as directed by the help option.
Monitoring Ceph MON
Usually, a Ceph cluster is deployed with more than one MON instance for increased reliability and availability. Since there are a large number of monitors, they should attain a quorum to make the cluster function properly. Monitoring of MONs regularly is of utmost importance.
The MON status
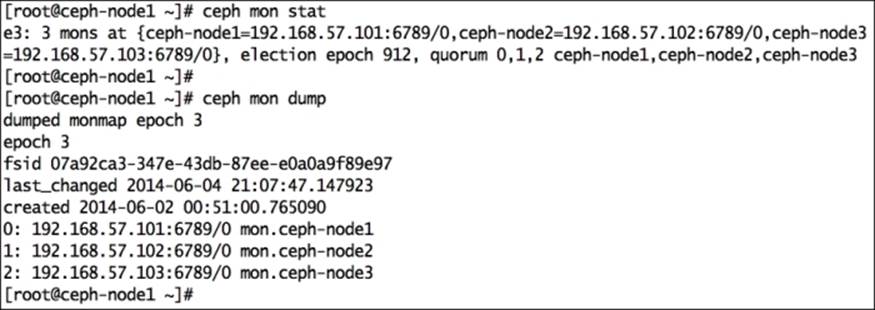
To display the cluster MON status and MON map, use the ceph command with either mon stat or mon dump as the suboption:
# ceph mon stat
# ceph mon dump
The following figure displays the output of this command:
The MON quorum status
To maintain a quorum between Ceph MONs, the cluster should always have more than 51 percent of available monitors in a Ceph cluster. Checking the quorum status of a cluster is very useful at the time of MON troubleshooting. You can check the quorum status by using the ceph command and the quorum_status subcommand:
# ceph quorum_status
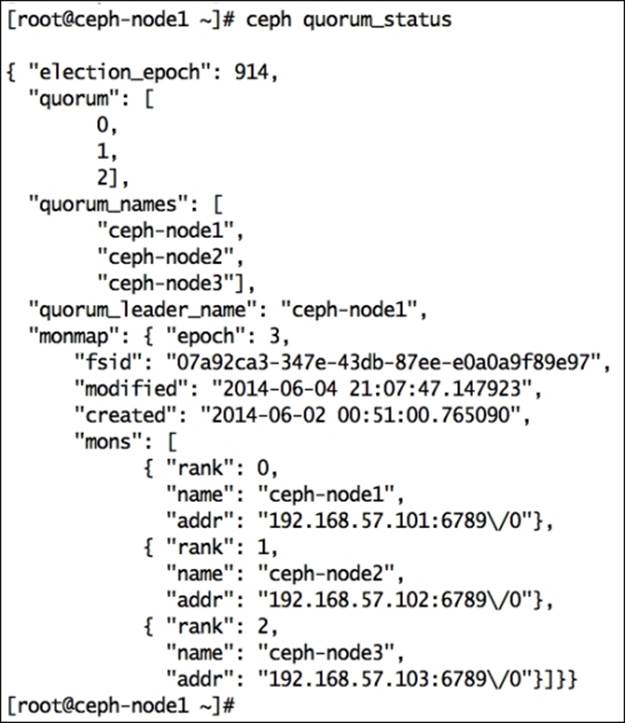
The quorum status displays election_epoch, which is the election version number, and quorum_leader_name, which denotes the hostname of the quorum leader. It also displays the MON map epoch, cluster ID, and cluster creation date. Each cluster monitor is allocated with a rank. For I/O operations, clients first connect to quorum lead monitors if the leader MON is unavailable; the client then connects to the next rank monitor.
Monitoring Ceph OSD
OSD in a Ceph cluster are the workhorses; they perform all the work at the bottom layer and store the user data. Monitoring OSDs is a crucial task and requires a lot of attention as there are a lot of OSDs to monitor and take care of. The bigger your cluster, the more OSDs it will have, and the more rigorous monitoring it requires. Generally, a Ceph cluster hosts a lot of disks, so the chances of getting OSD failure is quite high. We will now focus on Ceph commands for OSD monitoring.
OSD tree view
The tree view of OSD is quite useful to view OSD status such as IN or OUT and UP or DOWN. The tree view of OSD displays each node with all its OSDs and its location in a CRUSH map. You can check the tree view of OSD using the following command:
# ceph osd tree
This will display the following output:
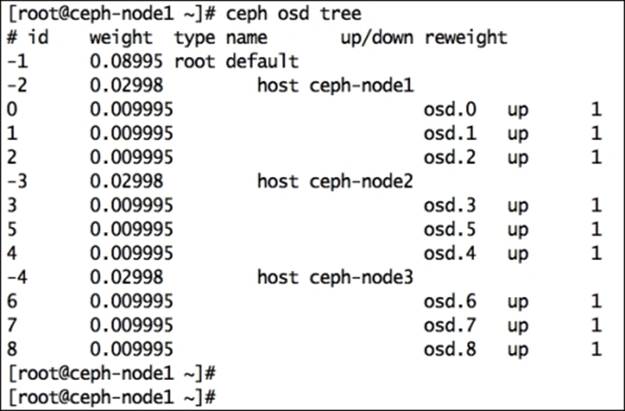
This command displays various useful information for Ceph OSDs, such as weight, the UP/DOWN status, and the IN/OUT status. The output will be beautifully formatted as per your Ceph CRUSH map. If you maintain a big cluster, this format will be beneficial for you to locate your OSDs and their hosting servers from a long list.
OSD statistics
To check OSD statistics, use # ceph osd stat; this command will help you to get the OSD map epoch, total OSD count, and their IN and UP statuses.
To get detailed information about the Ceph cluster and OSD, execute the following command:
# ceph osd dump
This is a very useful command that will output OSD map epochs, pool details, including the pool ID, pool name, and pool type that is replicated or erasure, the CRUSH ruleset, and placement groups.
This command will also display information such as OSD ID, status, weight, and a clean interval epoch for each OSD. This information is extremely helpful for cluster monitoring and troubleshooting.
To display blacklisted clients, use the following command:
# ceph osd blacklist ls
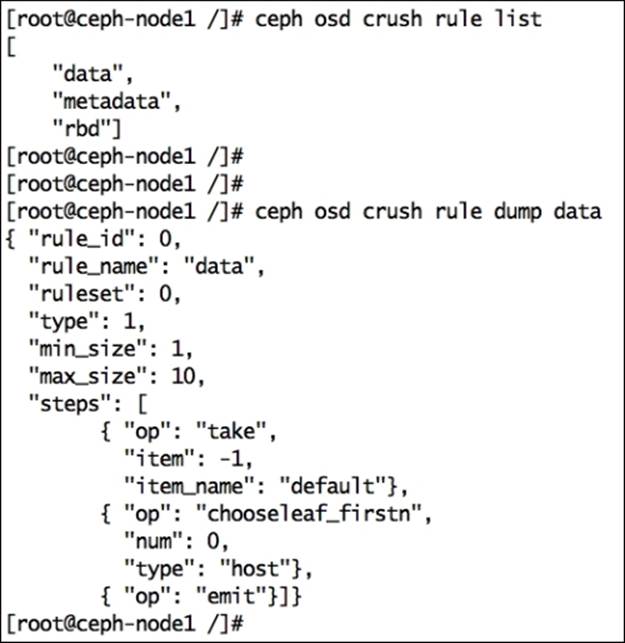
Checking the CRUSH map
We can query a CRUSH map directly from the ceph osd commands. The CRUSH map command-line utility can save a lot of time for a system administrator compared to manual way of viewing and editing a CRUSH map.
To view the CRUSH map, execute the following command:
# ceph osd crush dump
To view CRUSH map rules, execute:
# ceph osd crush rule list
To view a detailed CRUSH rule, execute:
# ceph osd crush rule dump <crush_rule_name>
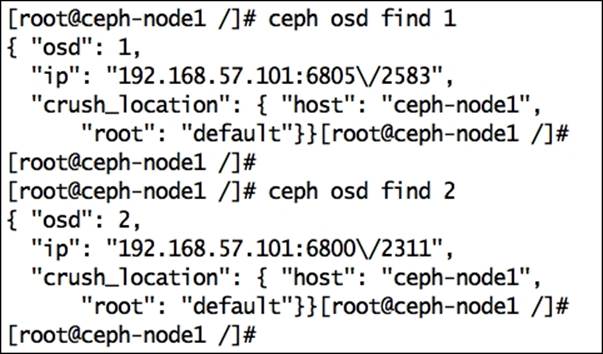
If you are managing a large Ceph cluster with several hundred OSDs, it's sometimes difficult to find the location of a specific OSD in the CRUSH map. It's also difficult if your CRUSH map contains multiple bucket hierarchies. You can use ceph osd find to search an OSD and its location in a CRUSH map:
# ceph osd find <Numeric_OSD_ID>
# ceph osd find 1
Monitoring placement groups
OSDs store placement groups, and placement groups contain objects. The overall health of a cluster majorly depends on placement groups. The cluster will remain in a HEALTH_OK status only if all the placement groups are on the active + clean status. If your Ceph cluster is not healthy, there are chances that the placement groups are not active + clean. Placement groups can exhibit multiple states:
· Peering: Under peering, the placement groups of the OSDs that are in the acting set, storing the replica of the placement group, come into agreement about the state of the object and its metadata in the PG. Once peering is completed, OSDs that store the PG agree about the current state of it.
· Active: Once the peering operation is complete, Ceph makes the PG active. Under the active state, the data in the PG is available on the primary PG and its replica for an I/O operation.
· Clean: Under the clean state, the primary and secondary OSDs have successfully peered, no PG moves away from their correct location, and the objects are replicated correct number of times.
· Degraded: Once an OSD goes down, Ceph changes the state of all its PGs that are assigned to this OSD as degraded. After the OSD comes UP, it has to peer again to make the degraded PGs clean. If the OSD remains down and out for more than 300 seconds, Ceph recovers all the PGs that are degraded from their replica PGs to maintain the replication count. Clients can perform I/O even after PGs are in a degraded stage. There can be one more reason why a placement group can be degraded; this is when one or more objects inside a PG become unavailable. Ceph assumes the object should be in the PG, but it's not actually available. In such cases, Ceph marks the PG as degraded and tries to recover the PG form its replica.
· Recovering: When an OSD goes down, the content of its placement groups fall behind the contents of its replica PGs on other OSDs. Once the OSD comes UP, Ceph initiates a recovery operation on the PGs to keep them up to date with replica PGs in other OSDs.
· Backfilling: As soon as a new OSD is added to a cluster, Ceph tries to rebalance the data by moving some PGs from other OSDs to this new OSD; this process is known as backfilling. Once backfilling is completed for the placement groups, the OSD can participate in client I/O. Ceph performs backfilling smoothly in the background and makes sure not to overload the cluster.
· Remapped: Whenever there is a change in a PG acting set, data migration happens from the old acting set OSD to the new acting set OSD. This operation might take some time based on the data size that gets migrated to the new OSD. During this time, the old primary OSD of the old acting group serves the client request. As soon as the data migration operation completes, Ceph uses new primary OSDs from the acting group.
· Stale: Ceph OSD reports its statistics to a Ceph monitor every 0.5 seconds; by any chance, if the primary OSDs of the placement group acting set fail to report their statistics to the monitors, or if other OSDs report their primary OSDs down, the monitor will consider these PGs as stale.
You can monitor placement groups using the commands explained here. The following is the command to get a placement group status:
# ceph pg stat
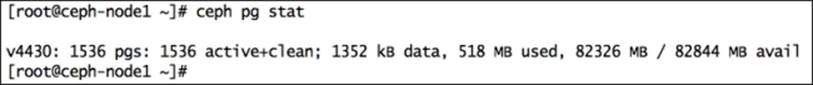
The output of the pg stat command will display a lot of information in a specific format:
vNNNN: X pgs: Y active+clean; R bytes data, U MB used, F GB / T GB avail
The variables here are:
· vNNNN: This is the PG map version number
· X: This is the total number of placement groups
· Y: This states the number of PGs with their states
· R: This specifies the raw data stored
· U: This specifies the real data stored after replication
· F: This is the remaining free capacity
· T: This is the total capacity
To get a placement group list, execute:
# ceph pg dump
This command will generate a lot of essential information, such as the PG map version, PG ID, PG state, acting set, and acting set primary, with respect to placement groups. The output of this command can be huge depending on the number of PGs in your cluster.
To query a particular PG for detailed information, execute the following command that has the ceph pg <PG_ID> query syntax:
# ceph pg 2.7d query
To list the stuck placement group, execute the following command that has the ceph pg dump_stuck < unclean | Inactive | stale > syntax:
# ceph pg dump_stuck unclean
Monitoring MDS
Metadata servers are used only for CephFS, which is not production ready at the time of writing this book. A metadata server has several states, such as UP, DOWN, ACTIVE, and INACTIVE. While performing monitoring of MDS, you should make sure that the state of MDS is UP and ACTIVE. The following commands will help you get information related to Ceph MDS.
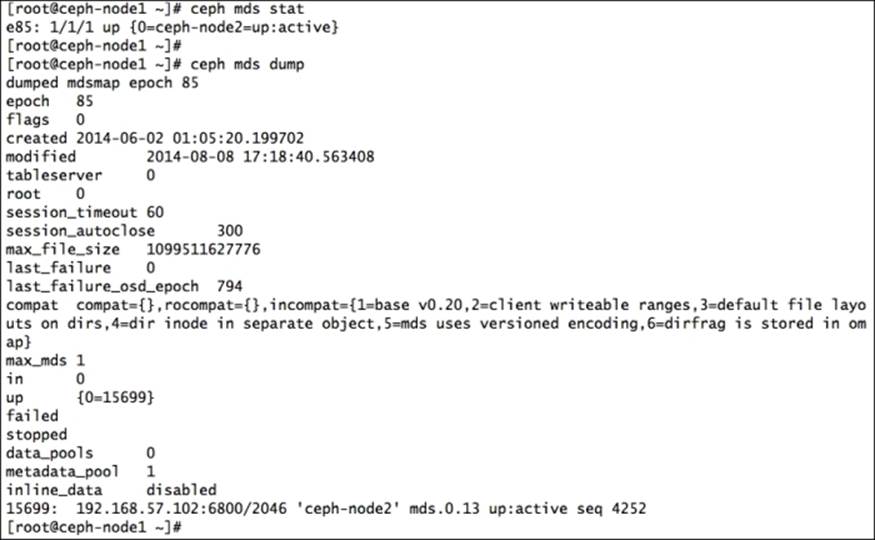
To check the MDS status, execute:
# ceph mds stat
To display the details of the metadata server, execute:
# ceph mds dump
The output is shown in the following screenshot:
Monitoring Ceph using open source dashboards
A Ceph storage administrator will perform most of the cluster monitoring using CLI via commands provided by the Ceph interface. Ceph also provides a rich interface for admin APIs that can be used natively to monitor the entire Ceph cluster. There are a couple of open source projects that make use of Ceph's REST admin API and represent the monitoring results in a GUI dashboard where you can have a quick look at your entire cluster. We will now take a look at such open source projects and their installation procedures.
Kraken
Kraken is an open source Ceph dashboard written in Python for stats and monitoring of a Ceph cluster, initially developed by Donald Talton, and later joined by David Moreau Simard.
Donald is the owner of Merrymack, an IT consulting company. He is an expert engineer with over 20 years of experience and has worked for companies such as Apollo Group, Wells Fargo, PayPal, and Cisco. During his tenure in PayPal and Cisco, he focused primarily on OpenStack and Ceph. During the time he was working for Cisco, he kickstarted the development of Kraken. Fortunately, Donald is one of the technical reviewers of this book, too.
David Simard started his career in 2006 when he was studying in college; he started working for iWeb, a web-hosting company, as a temporary employee during his summer holidays; later, when his job got converted to a full-time position, he had no other option than to leave his studies and continue working on amazing stuff at iWeb. It has now been 8 years since he started working with iWeb as an IT architecture specialist. He deals with cloud storage, cloud computing, and other interesting fields.
There are a few key reasons behind the development of Kraken. The first is that when it was conceived, Ceph's Calamari tool was only available to commercial customers of Inktank. Donald believes that it's necessary to have a good open source dashboard to monitor the Ceph cluster and its components from a single window; this will lead to better management and speed up the adoption of Ceph as a whole. He took this as a challenge and kicked off the development of Kraken. Donald decided to use ceph-rest-api to extract all the necessary cluster data for monitoring and reporting. To converge all this cluster data in a presentable dashboard format, Donald used several other tools such as Python, Django, humanize, and python-cephclient.
The roadmap for Kraken has been divided into several milestones. Currently, Kraken is at its first milestone, which consists of the following feature sets:
· Cluster data usage
· The MON status
· The OSD status
· The PG status
· Better user interface
· Support for multiple MONs
The next development stage of Kraken will be the inclusion of operational changes for OSD, live CRUSH map configuration, Ceph user authentication, pool operations, block device management, and system metrics such as CPU and memory usage. You can follow the Kraken roadmap on the GitHub page at https://github.com/krakendash/krakendash or on Kraken's readme file. Kraken is fully open source and follows BSD-licensing. Developers who want to contribute to Kraken can send a pull request to Donald and can contact him at <don@merrymack.com>.
The building blocks of Kraken consist of several open source projects such as:
· Python 2.7 or later: This is required for libraries such as collections.
· ceph-rest-api: This is included with Ceph binaries.
· Django 1.6.2 or later: This is the core framework for Kraken.
· humanize 0.5 or later: This is required for data-free display conversion.
· python-cephclient 0.1.0.4 or later: Recently used in Kraken, it is the client wrapper for ceph-rest-api. In the previous releases, Kraken made use of ceph-rest-api directly without any wrapper. This has been written by David to wrap ceph-rest-api, which gives us additional capabilities, such as being able to support multiple clusters in the future.
· djangorestframework 2.3.12 or later: This is used for some custom API additions that might or might not stay in Kraken.
· django-filter 0.7 or later: This is required by Django.
Deploying Kraken
In this section, we will learn how to deploy Kraken to monitor your Ceph cluster. It is a lightweight application that requires a significantly lower amount of system resources. In this deployment, we will use the ceph-node1 machine; you can use any Ceph cluster node that has access to a Ceph cluster. Follow the listed steps:
1. Install dependencies for Kraken, such as python-pip, screen, and the Firefox browser, using the following command. If you have any other browser, you can skip installing Firefox packages. Python-pip is a package manager used to install Python packages, which is required to install dependencies. Kraken will use separate screen sessions to initiate subprocess required for dashboards; these screens will be provided by the screen package:
2. # yum install python-pip screen firefox
3. Install the required development libraries:
4. # yum install gcc python-devel libxml2-devel.x86_64 libxslt-devel.x86_64
5. Create a directory for Kraken:
6. # mkdir /kraken
7. Clone the Kraken repository from GitHub:
8. # git clone https://github.com/krakendash/krakendash
9. Use the Python package manager to install the required packages for Kraken, such as Django, python-cephclient, djangorestframework, markdown, and humanize:
10.# cd krakendash
11.# pip install -r requirements.txt
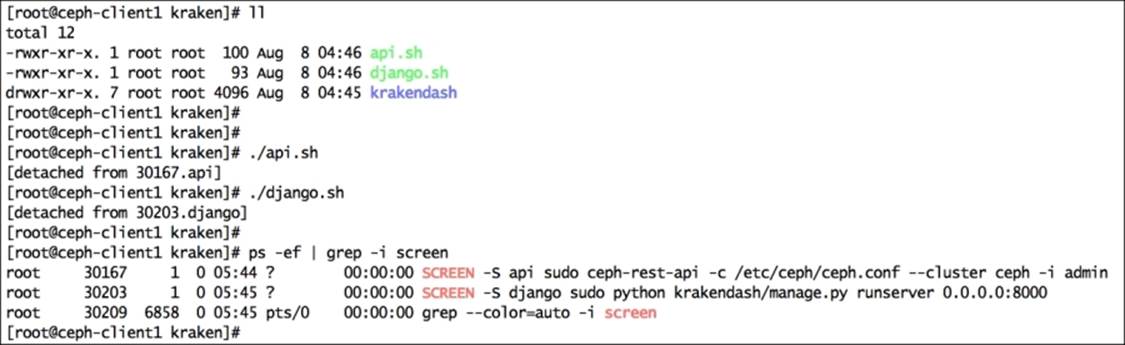
12. Once these packages are installed, execute api.sh and django.sh, which will invoke the ceph-rest-api and django python dashboards, respectively. These scripts will execute in independent screen environments; you can use screen commands to manage these sessions. Press Ctrl + D to detach screen sessions and move them to the background:
13.# cp ../krakendash/contrib/*.sh .
14.# ./api.sh
15.# ./django.sh
16. You can check the screen sessions using the ps command and reattach to the screen session using the -r command:
17.# ps -ef | grep -i screen
The output is shown in the following screenshot:
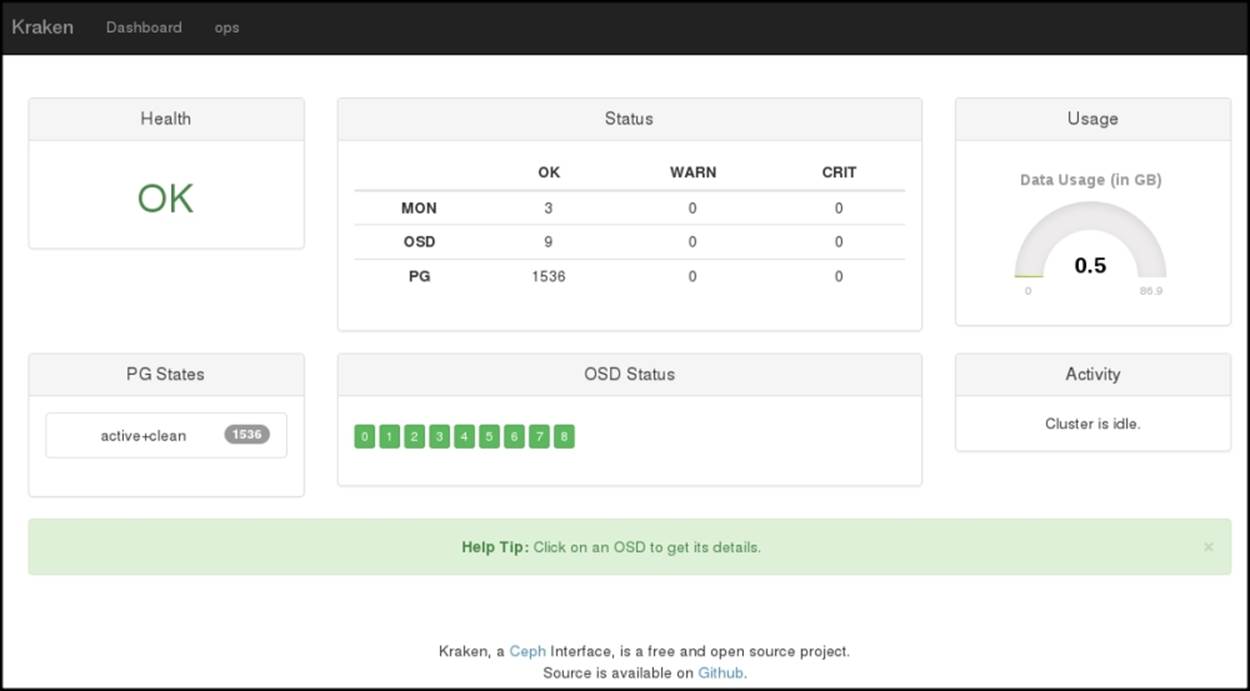
18. Finally, when api.sh and django.sh are running, open your web browser and navigate to http://localhost:8000/; you should be able to view your Ceph cluster status on the Kraken dashboard:
The ceph-dash tool
The ceph-dash is another free open source dashboard/monitoring API for a Ceph cluster, which has been developed by Christian Eichelmann, who is working fulltime for 1&1 Internet AG, Germany as a senior software developer. Christian started the development of this project at the time when there were very few open source dashboards available for Ceph. Moreover, the other dashboards that were available had complex architectures and did not work well with large clusters. So, Christian focused on developing a simple REST API-based dashboard that allows cluster monitoring via simple REST calls that should work well with large Ceph clusters.
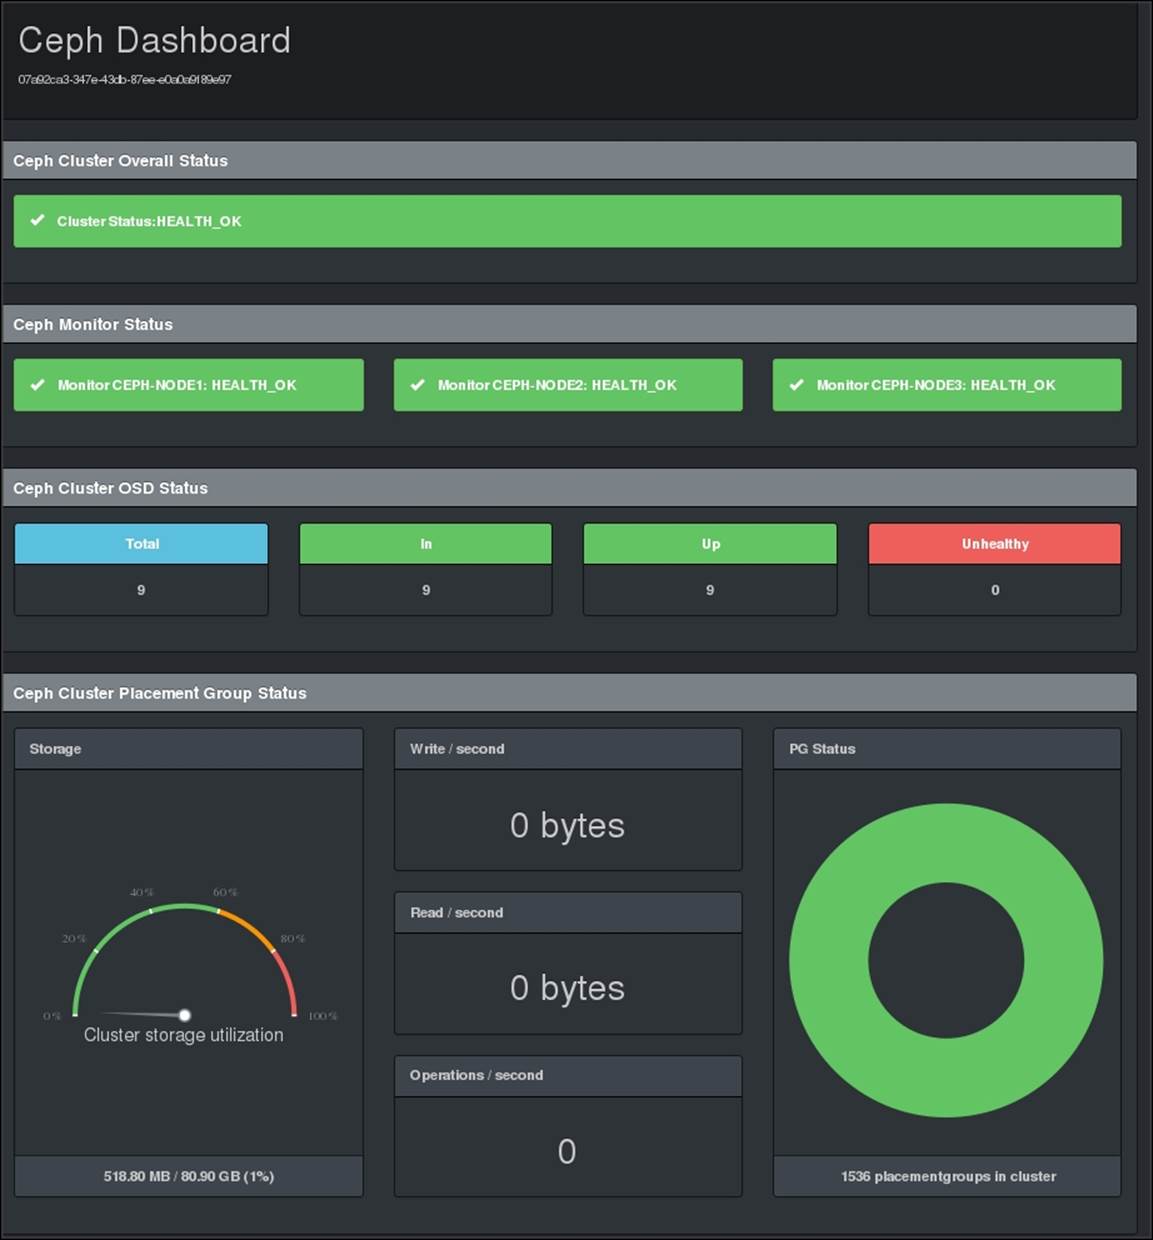
The ceph-dash tool has been designed with a keep-it-simple approach to provide an overall Ceph cluster health status via a RESTful JSON API as well as web GUI. It is a lightweighted application that does not have any dependencies on ceph-rest-api. It is a pure Python wsgi application that talks to the cluster directly via librados. Currently, ceph-dash provides a clean and simple web GUI that is able to show the following information about the Ceph cluster:
· The overall cluster status with detailed problem description
· Support for multiple monitors and the status of every monitor
· The OSD status with count for IN, OUT, and unhealthy OSD
· Graphical storage capacity visualization
· The current throughput, including writes/second, reads/second, and operations/second
· Graphical placement group status visualization
· Cluster recovery state
In continuation to this, ceph-dash also provides REST endpoint that generates all the cluster information in JSON format, which can further be used in various creative ways. Since ceph-dash is an open source project, anyone can contribute by sending pull requests to Christian via https://github.com/Crapworks/ceph-dash.
If you run ceph-dash tests/development purposes, you can run it independently. For production usage, it is strongly recommended to deploy the application on a wsgi capable web server (Apache, nginx, and so on). The ceph-dash tool uses Flask microframework and ceph-python bindings to connect directly to the Ceph cluster. The access to Ceph cluster by ceph-dash is purely read only and doesn't require any write privileges. The ceph-dash tool uses the ceph status command via the Python Rados class. The returned JSON output is then either exposed via the REST API or via a web GUI that refreshes itself every 5 seconds.
Deploying ceph-dash
In this section, we will learn how to deploy ceph-dash for a Ceph cluster. Proceed with the following steps:
1. The ceph-dash tool must be installed on a machine that has access to a Ceph cluster. Since it is not resource hungry, you can designate any of your monitor machines for it.
2. Create a directory for ceph-dash and clone its repository from GitHub:
3. # mkdir /ceph-dash
4. # git clone https://github.com/Crapworks/ceph-dash.git
5. Install python-pip:
6. # yum install python-pip
7. Install Jinja2 package:
8. # easy_install Jinja2
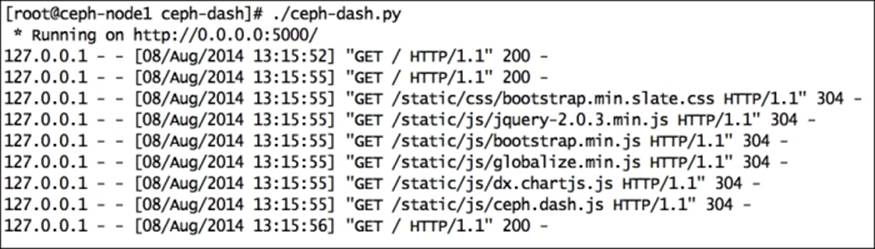
9. Once the installation is complete, you are good to launch the ceph-dash GUI. To start ceph-dash, execute:
10.# ./ceph-dash.py
The output is shown in the following screenshot:
11. Open the web browser, point it to http://localhost:5000/, and start monitoring your cluster using ceph-dash:
Calamari
Calamari is the management platform for Ceph, an attractive dashboard to monitor and manage your Ceph cluster. It was initially developed by Inktank as a proprietary software that ships with the Inktank Ceph Enterprise product for their customers. Just after the acquisition of Inktank by Red Hat, it was open sourced on May 30, 2014 by Red Hat. Calamari has several great feature sets, and its future roadmap is quite impressive. Calamari has two parts and each part has its own repositories.
Fronted is the browser-based graphical user interface that is majorly implemented in JavaScript. The fronted part makes use of Calamari's REST API and is constructed in a modular approach so that each component of the fronted can be updated or can undergo maintenance independently. The Calamari frontend has been open sourced with an MIT license. You can find the repository at https://github.com/ceph/calamari-clients.
Calamari backend is the core part of the platform, which is written in Python. It also makes use of other components such as SaltStack, ZeroRPC, graphite, djangorestframework, Django, and gevent, and provides a new REST API for integration with Ceph and other systems. Calamari has been reinvented in its new version, where it uses the new Calamari REST API to interact with Ceph clusters. The pervious release of Calamari uses the Ceph REST API, which is a bit restrictive for this purpose. The Calamari backend has been open sourced with the LGPL2+ license; you can find the repository at https://github.com/ceph/calamari.
Calamari has a good documentation available at http://calamari.readthedocs.org. Whether you are a Calamari operator, a developer working on Calamari, or a developer using the Calamari REST API, this documentation is a good source of information to get you started with Calamari. Like Ceph, Calamari has also been developed upstream; you can get involved with Calamari on IRC irc://irc.oftc.net/ceph by registering to the mailing list <ceph-calamari@ceph.com> or sending pull requests on Calamari GitHub accounts athttps://github.com/ceph/calamari and https://github.com/ceph/calamari-clients.
If you want to install Calamari and are curious to see what it looks like, you can follow my blog about Calamari's step-by-step installation at http://karan-mj.blogspot.fi/2014/09/ceph-calamari-survival-guide.html.
Summary
In this chapter, we covered the monitoring aspect of Ceph, including cluster monitoring and monitoring of different Ceph components such as MON, OSD, and MDS. We also learned about monitoring placement groups, including their various states. The states of placement groups are very much dynamic and require keen monitoring. Most of the changes that happen on a Ceph cluster are in its placement groups. This chapter also covered some open source GUI monitoring dashboard projects such as Kraken and ceph-dash. These projects are separate from the Ceph community, managed and developed by individual efforts, yet they are open source, so you can contribute to these projects. We also covered an overview of Calamari, which is a management and monitoring service for Ceph, which has been recently open sourced by Red Hat (Inktank). In the next chapter, we will learn about how Ceph extends its benefits to cloud platforms such as OpenStack. We will also focus on integrting Ceph with OpenStack.
All materials on the site are licensed Creative Commons Attribution-Sharealike 3.0 Unported CC BY-SA 3.0 & GNU Free Documentation License (GFDL)
If you are the copyright holder of any material contained on our site and intend to remove it, please contact our site administrator for approval.
© 2016-2026 All site design rights belong to S.Y.A.