Megan Squire (2015)
Chapter 3. Workhorses of Clean Data - Spreadsheets and Text Editors
When designing a home kitchen, the typical layout invokes the classic work triangle, the points of which are the refrigerator, sink, and stove. In our Clean Data kitchen, we have a few indispensible devices as well. Two of these are the humble spreadsheet and the text editor. Although these unpretentious tools are often overlooked, full knowledge of their features can make many cleaning tasks quicker and easier. In Chapter 2, Fundamentals – Formats, Types, and Encodings, we briefly introduced these two tools in the context of learning about data types and file types, but in this chapter, we are ready to dig deeper into:
· Useful functions in Excel and Google Spreadsheets that can help us manipulate data, including text to columns, splitting and concatenating strings, searching and formatting to find unusual values, sorting, importing spreadsheet data into MySQL, and even generating SQL using a spreadsheet
· Typical features of a text editor that can automatically extract and manipulate data into a more useful format, including searching and replacing with regular expressions, altering line beginnings and endings, and column-based editing
· A small project where we use features of both of these tools to clean some real-world data
Spreadsheet data cleaning
The utility of the spreadsheet for data cleaning comes from two things: its ability to organize data into columns and rows and its suite of built-in functions. In this section, we will learn how to use the spreadsheet to its fullest in our quest for clean data.
Text to columns in Excel
As spreadsheets are designed to hold data in columns and rows, one of the first cleaning tasks we might need to do is arrange our data accordingly. For instance, if you paste a large amount of data into Excel or Google Spreadsheets, the software will first try to look for a delimiter (such as a comma or tab) and divide the data into columns that way. (Refer to Chapter 2, Fundamentals – Formats, Types, and Encodings, for a review of delimited data.) Sometimes, the spreadsheet software will not find a delimiter, so we will have to provide it more guidance about how to divide the data into columns. Consider the following snippet of text from a list of several thousand Internet Relay Chat channel topics on Freenode:
[2014-09-19 14:10:47] === #eurovision 4 Congratulations to Austria, winner of the Eurovision Song Contest 2014!
[2014-09-19 14:10:47] === #tinkerforge 3
[2014-09-19 14:10:47] === ##new 3 Welcome to ##NEW
Note
To generate a list of channels and their topics in an IRC chat server, use the alis command, which can be sent as part of either /query or /msg, depending on your server's settings. On Freenode, the /msg alis * command will generate a list of channels. More information on IRC chat can be found here: https://freenode.net/services.shtml
We can see with our human eyes that the first chunk of data is a timestamp, followed by ===, # and a channel name, a number (the count of users on the channel at the moment the list was constructed), and a description of the channel. However, if we paste these lines into Excel or Google Spreadsheets, it is unable to automatically make the same observations about what columns should be. The rows are detected correctly by the spreadsheet, but the delimiting is too inconsistent for columns to be detected automatically. How the data looks when pasted into Google Spreadsheets is given in the following image. By highlighting cell A1, we can see that the entire line is shown in the formula bar, indicating that the entire row has been pasted into cell A1:
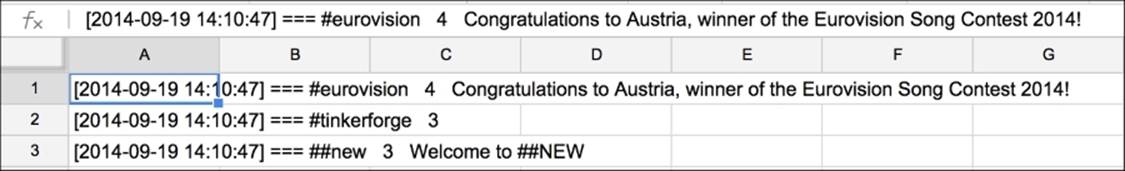
How can we easily create columns from this data in the spreadsheet? We would like each separate data item to be in its own column. By doing this, we will be able to, for example, take an average of the number of users on the channels or sort the data by the channel names. Right now, we cannot easily sort or use formulas on this data as it is all in one giant text string.
One strategy will be to use Excel's text-to-columns wizard to split the data into recognizable chunks; then, we can reassemble them and strip out extra characters if needed. This is shown in the steps mentioned as follows:
1. Highlight column A, and launch the text-to-columns wizard (located in the Data menu). In step 1, choose a fixed width, and in step 2, double-click on all the lines that have been drawn to delimit the description field. The following figure shows you how the data should look after delimiting the first few columns and removing all the extra lines:
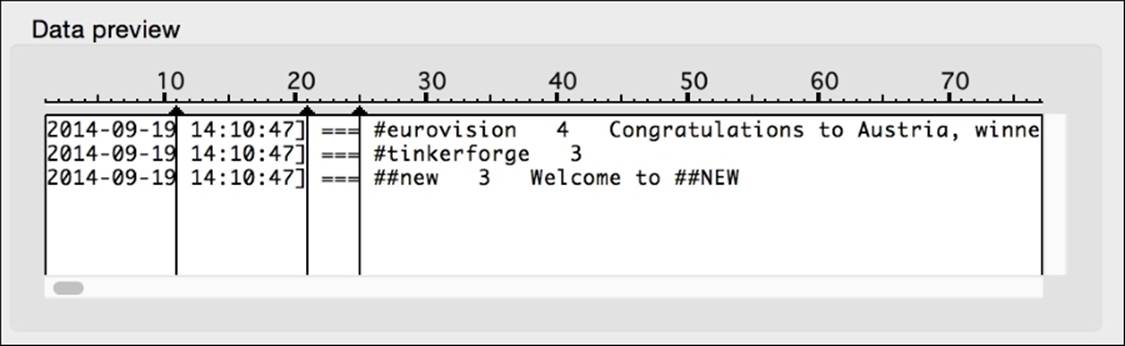
Fixed-width splitting in Excel.
The resulting data looks like the following figure. The first three columns are good, but the fixed-width delimiting did not work to separate the count of users and channel names in column D. This happened because the channel names are not as predictable in length as the previous columns.
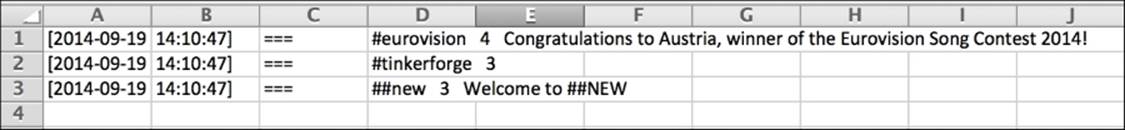
This is the result after the first round of text-to-columns splitting.
2. We will have to run text-to-columns again but just on column D this time, and we will use delimited instead of fixed-width procedure. First, note that there are two spaces between the channel name #eurovision and the number of users (4) and two spaces again between 4 and the channel description. Even though text-to-columns does not allow us to type two spaces as a delimiter (it allows single characters only), we can use the Find-Replace dialogue to replace all cases of two spaces with a symbol that is not used anywhere else in our text. (Perform a Findoperation first to make sure.) I chose a ^ symbol.
This particular step seems a little sloppy, so if you are interested in an alternate approach, I do not blame you one bit. Excel is more limited than other tools in its ability to find and replace bad text. We will learn how to use regular expressions in the Text editor data cleaning section later in this chapter.
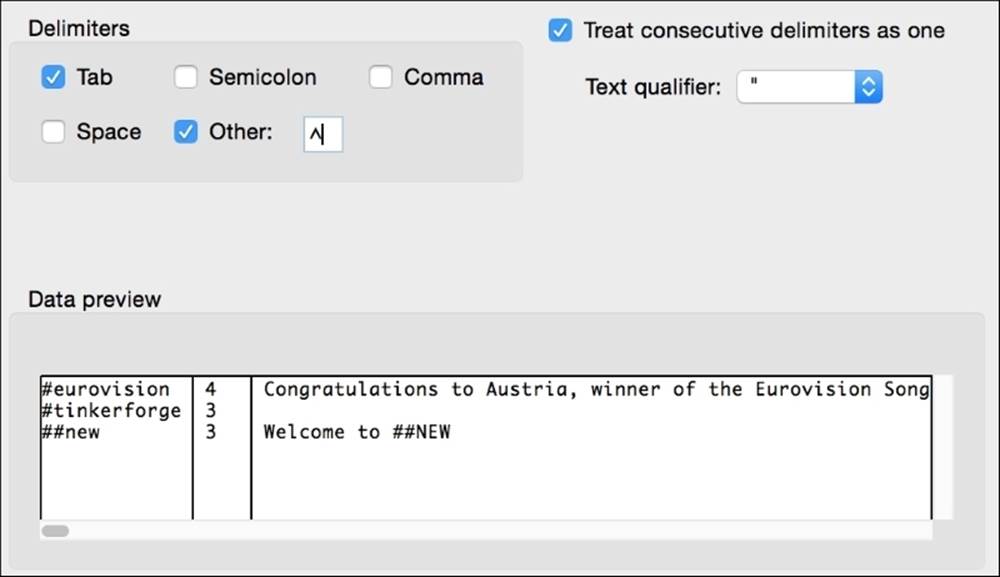
Adding an unusual delimiting character allows us to split apart the remaining columns.
3. Now, use Find-Replace to remove the [ and ] characters from columns A and B, replacing them with nothing. (Highlight these columns before starting find-replace so that you do not accidentally remove symbols throughout the whole sheet.)
Unfortunately, Excel, in its eternal quest to try to help us, turns these into dates formatted in a way we might not like: 9/19/2014. If you want these to go back to the way they were (2014-09-19), select the entire column and use the custom format dialogue to specify the date format as yyyy-mm-dd.
4. The strings in column F still have extra space at the beginning. We can strip the extra spaces from the front of each string value using the trim() function. Insert a new column to the left of F, and apply the trim() function, shown as follows:
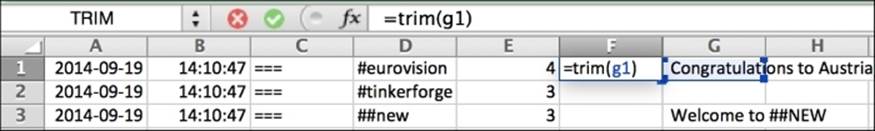
This is the result of applying the trim() function to strip out leading or trailing spaces.
5. We can also apply the clean() function to the trimmed text. This will remove any of the first 32 ASCII characters: all non-printing control characters that may have somehow made their way into these channel descriptions. You can apply clean() outside trim() functions like this:clean(trim(g1)).
6. Drag the corner of the F1 box down to apply clean(trim()) to the rest of the cells in column F.
7. Select column F, copy it, and use Paste Special Values Only in column F so that we can delete column G.
8. Delete column G. Voila, now you have perfectly cleaned data.
Splitting strings
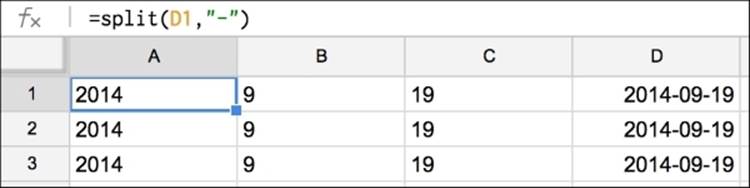
A lightweight version of the text to columns feature, available in Google Spreadsheets but not in Excel, is the split() function. This function just takes a string value and splits it into its component pieces. Be aware that you need to provide enough new columns for the newly split data to fit into. In the following example, we have used the same data as the previous example but created three new columns to hold the split values from D.
Concatenating strings
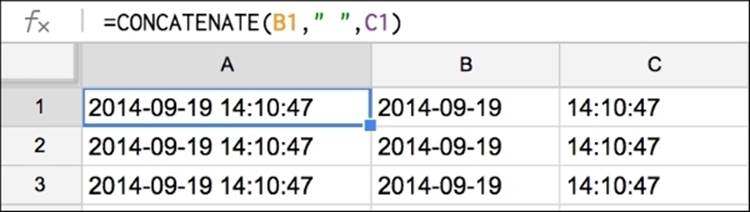
The concatenate() function takes a number of strings, either as cell references or as quoted strings, and attaches them together inside a new cell. In the following example, we use the concatenate() function to join the date and time strings into one. This function is available in both Excel and Google Spreadsheets, as shown in the following figure:
Conditional formatting to find unusual values
Both Excel and Google spreadsheets have conditional formatting features. Conditional formatting uses a set of rules to change the appearance (format) of a cell or cells depending on whether some criteria are met (condition). We can use this to find data that is too high, too low, missing, or otherwise strange. Once we have identified it, we can clean it.
Here is an example of how to use conditional formatting in Google Spreadsheets to find a row in our sample data that does not include # in the channel name and has an empty value for the number of chat participants:
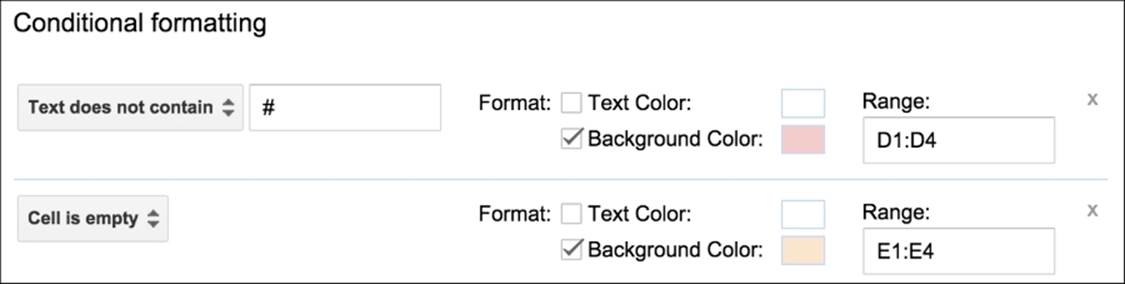
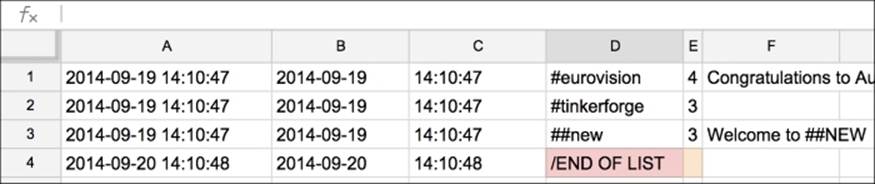
Here is the result after the background cell colors have been changed to locate cells in D that do not start with # and cells in E that are empty. Now these problem values can be found easily with a visual inspection.
Sorting to find unusual values
If there is too much data for a visual inspection, then we could try to employ sorting to find the troublesome data. In either Google Spreadsheets or Excel, select the columns you want to sort, which can be the entire sheet, and use the Sort option in the Data menu. This works fairly easily for most of the columns, especially if you are looking for data like cell D4.
But what happens if you try to sort by column E in order to find that missing value? Maybe we would like to put all the missing data together so that we can delete these rows of data. The value for E4 is empty. Remember from Chapter 2, Fundamentals – Formats, Types, and Encodings, that NULL (empty in Google Spreadsheets parlance) cannot be compared to any other value, so it remains at the bottom of the sorted list no matter whether you sort the values in column E from low to high or high to low.
Importing spreadsheet data into MySQL
Now that you have a lovely spreadsheet full of clean data, you might wish to store it in a database for the long term.
Creating CSV from a spreadsheet
Many database systems will accept data via an import routine built around CSV files. If you are using MySQL, there is a LOAD DATA IN FILE command that will slurp data right into the database from a delimited file, and you can even set your own delimiter. First, let's take a look at an example of the command, and then we can create the file in Excel according to the parameters we want.
From the MySQL command line, we can run:
load data local infile 'myFile.csv'
into table freenode_topics
fields terminated by ','
(dateOfTopic, channel, numUsers, message);
This, of course, assumes that a table has already been created. In this case, it is called freenode_topics, and it has four columns in it, which appear on the last line of this SQL query.
The CSV file referenced in this query, myFile.csv, will therefore need to have the columns in this order and separated by commas.
In Excel, a CSV can be created from the current sheet in a workbook by navigating to File | Save As and then choosing CSV (MS-DOS) from the list of format options. In Google Spreadsheets, you can accomplish the same thing by navigating to File | Downloads | CSV. In both cases, save the file to your local system and then launch the MySQL client and proceed through the command line shown previously.
Tip
If you do not like using the MySQL command-line client, CSV files can also be uploaded to a server using MySQL's own Workbench graphical client or using a tool like PhpMyAdmin. PhpMyAdmin does have a size limit on the upload file (currently, 2 MB).
Generating SQL using a spreadsheet
Another way to get data into a database seems strange at first, but it can be a real timesaver if you are unable—for whatever reason, maybe because of the wrong permissions or because of file size limits—to load it via the CSV discussed previously. In this method, we will build INSERTstatements inside the spreadsheet itself and then run these commands in the database.
If each column in the spreadsheet represents a column in the database, then we can simply add the structural components of a SQL INSERT command (quoted strings, parenthesis, commands, and line-terminating semicolons) around the columns in the spreadsheet and concatenate the result together into a giant string of INSERT commands.
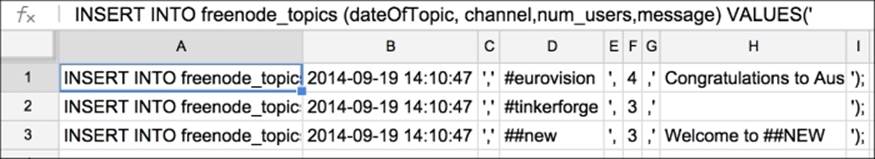
After using the concatenate(A1:I1) function to attach all the strings in columns A:I, we end up with INSERT statements that look like this:
INSERT INTO freenode_topics (dateOfTopic, channel, num_users, message) VALUES('2014-09-19 14:10:47', '#eurovision',4, 'Congratulations to Austria, winner of the Eurovision Song Contest 2014!');
These can be pasted into a user-friendly frontend, such as PhpMyAdmin or MySQL Workbench. Or, you can save this as a text file (using your text editor), one INSERT statement after the other. I called my file inserts.sql. This file can now be imported into the database using the command line and MySQL client, as follows:
$mysql -uusername -p -hhostname databasename < inserts.sql
Or, it can be imported using the source command in the MySQL command-line client like this:
$mysql -uusername -p -hhostname
[enter your password]
> use databasename;
> source inserts.sql
Either one of these will work to get the data into MySQL. If the script is small enough, you can also use one of the graphical clients, such as MySQL Workbench. Be careful of loading very large scripts into the graphical client, however, as the amount of memory on your client machine may not be sufficient to load hundreds of gigabytes of SQL. I prefer the second method (source) because it prints out a success message following each successful insert, so I know my commands are good.
If you are a little unclear about how you would go about creating a text file called inserts.sql, then the next section is for you. We are going to cover more than you ever thought you would want to know about text editors!
Text editor data cleaning
We learned in Chapter 2, Fundamentals – Formats, Types, and Encodings, that text editors are the preferred way of reading and creating text files. This sounds reasonable and makes perfect sense. What we did not really explain back then was that a text editor is sometimes also called a programmer's editor because it has many cool features that help folks such as programmers, as well as data cleaners, who must deal with text files all day long. We are going to take a tour of some of the most useful features now.
Tip
There are dozens of text editors available for every operating system. Some of them cost money, but many are available at no cost. For this chapter, I am going to use Text Wrangler, a no cost editor available for OSX (available here: http://www.barebones.com/products/textwrangler). The features shown in this chapter are widely available in most other editors, such as Sublime Editor, but you should check the documentation for whatever editor you have chosen if the location of a particular feature or tool is not obvious.
Text tweaking
Our text editor of choice has a number of useful functions built into it for text manipulation. The ones outlined here represent some of the most commonly used ones for data cleaning tasks. Keep in mind that you might run dozens of cleaning routines on a single text file in the course of cleaning it, so the tips we gave in Chapter 1, Why Do You Need Clean Data?, for how to clearly communicate the changes you made will really come in handy here.
Changing case is a very common request in data cleaning. Many times, we will inherit data that is all lowercase or all uppercase. The following image shows a dialogue within Text Wrangler to perform case changes on a selection of text. The keyboard shortcuts are shown to the right of each option.
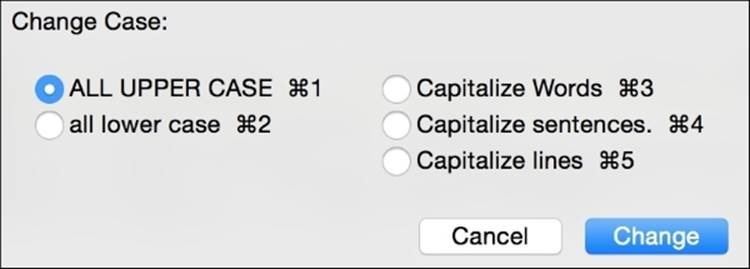
Options for case changes include uppercase and lowercase as well as capitalizing the first letter of each word, line, or the first word in a sentence.
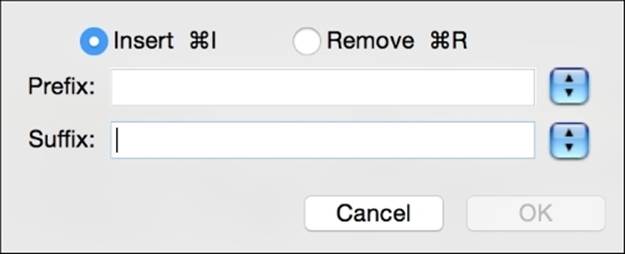
Adding or removing prefixes or suffixes on each line in a selection is another common task. I needed to do this for a large amount of text lines the other day when I was building a text classifier. I needed to suffix each line with a comma and the name of what class (positive or negative) the line exemplified. Here is the prefix and suffix dialogue in Text Wrangler. Note how you can either insert or remove, but not both, in the same maneuver. If you need to perform both of these tasks, perform one, and then perform the other.
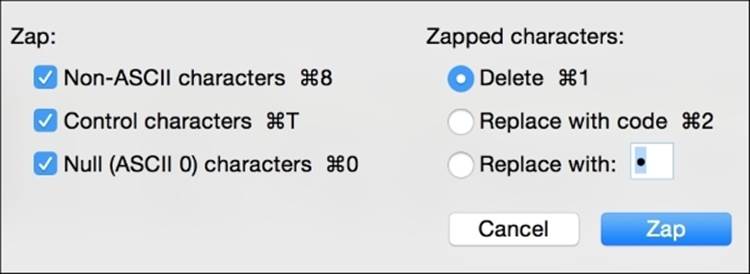
Zapping gremlins is another excellent task for your text editor. Both TextWrangler and Sublime Editor for Windows have this feature. In zapping gremlins, the editor can look for any characters that are outside of your desired character set, for example, control characters, NULL characters, and non-ASCII characters. It can either delete them or replace them with their character code. It could also replace the gremlins with any character that you specify. This makes them easier to find later.
The column mode
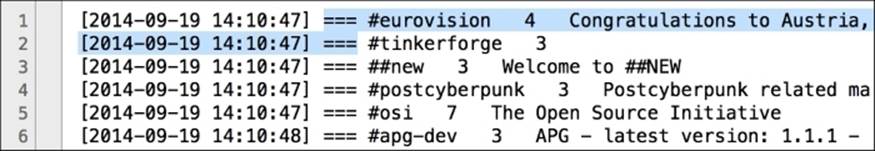
When a text editor is in column mode, it means that you can select text in columns and not just in rows. Here is an example of selection in a normal (non-column) mode:
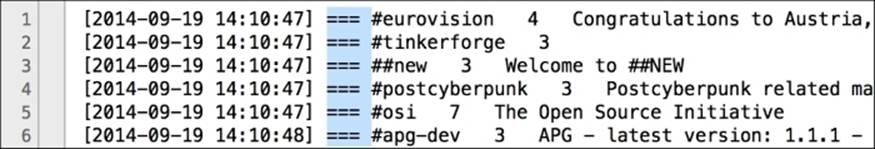
Here is an example of a selection in column mode. Hold down the Option key and select the text in columns. Once the text is selected, you can treat it just like you would treat any selected text: you can delete it, cut it or copy it onto the clipboard, or use any of the text tweaks we discussed in the preceding section as long as they work on a selection.
A few limitations of this feature include:
· Each character is one column, so characters should be displayed in a non-proportional, typewriter-style typeface.
· In Text Wrangler, the column mode only works when line wrapping is turned off. Turning off soft wrapping means your lines will extend to the right and not be wrapped.
· In Text Wrangler, the vertical height of the column you are drawing must be able to be drawn by you manually, so this is a technique for small amounts of data (hundreds or thousands of rows, but probably not hundreds of thousands of rows).
Heavy duty find and replace
Text editors really shine at manipulating text. It may feel strange to use a text editor in the column mode, as that seems like more of a natural task for a spreadsheet. Similarly, it may seem awkward to use a spreadsheet for Find-Replace after you see what a text editor can do.
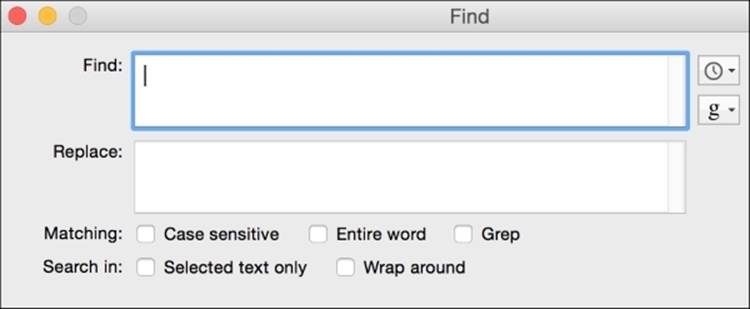
The main portion of the Find dialogue window in Text Wrangler is shown as follows. The provided features include options for case-sensitive searches, wrapping around, searching in subselections of text, and looking for the given text pattern inside either a word or just a portion of a word. You can also paste special characters, whitespace (including tabs and line terminators), emojis, and so on, into the textbox. The little drop-down boxes to the right of the Find box provide additional functionality. The top one with the clock icon on it holds a list of recent searches and replacements. The bottom one with the letter g on it holds a list of built-in search patterns that might be useful, and at the bottom of this menu is an option to add your own patterns to the list.
One of the most powerful find-replace features is enabled by the Grep checkbox. Checking this box allows us to use a regular expression pattern for our searches. In short, a regular expression (regex) is a pattern written in a special language, made up of symbols, and designed to match against some string text. A full treatment of regular expressions is beyond the scope of this book, but suffice it to say that they are enormously useful and we will be visiting them periodically when we need them to clean data.
Tip
The reason the checkbox in the Text Wrangler interface says Grep—and not RegEx or Match—is that there are several slight variations on the regular expression pattern-matching language. Text Wrangler is signaling to us that it is using the one from Grep, a program originally written for Unix and the most common variant.
Here, we will outline a few of the indispensible regular expression symbols that we will use time and again to clean data. For more complicated patterns, it is worth consulting a special book or one of the myriad web pages that show all kinds of exotic regular expression syntaxes:
|
Symbol |
What it does |
|
$ |
Matches the end of the line |
|
^ |
Matches the beginning of the line |
|
+ |
Matches one or more of the specified characters |
|
* |
Matches 0 or more of the specified characters |
|
\w |
Matches any word character (0-9, A-z). To match nonword characters, use \W |
|
\s |
Matches any whitespace character (tab, line feed, or carriage return). To match non-whitespace characters, use \S |
|
\t |
Matches a tab character |
|
\r |
Matches a carriage return. Use \n for line feed. |
|
\ |
This is the escape character. It matches the exact character that follows, not the regex pattern character. |
Here are a few examples of find-replace combinations so that we can learn how Text Wrangler works with regular expressions. Make sure the Grep box is checked. If nothing is shown in the replace column, it means that the Replace field should be left empty.
|
Find |
Replace |
What it does |
|
\r |
Finds a line feed (line terminator) and replaces it with nothing. Another way to phrase this is "make multiple lines into one line". |
|
|
^\w+ |
- |
Matches the beginning of the line, followed by at least a one-word character. Adds a - character to the front of the line. |
|
\\r$ |
\[end\] |
Looks for all lines that end with the actual \r characters (backslash followed by r) and replaces them with the actual characters [end]. Note that [ and ] are special regex characters as well, so they will need to be escaped to use them as actual characters. |
If regular expressions seem daunting, take heart. First, recall from the Text tweaking section earlier in this chapter that most text editors, Text Wrangler included, have many built-in search and replace features that are built on the most common regular expressions. So, you may find that you do not really have to write many regular expressions very often. Second, as regular expressions are so powerful and so useful, there are a lot of online resources that you can consult to learn how to build a complicated regex if you need it.
Two of my favorite resources for regex are Stack Overflow (http://stackoverflow.com) and regular-expresions.info (http://regular-expressions.info). There are also numerous regular expression testing websites available via a quick web search. These sites let you write and test the regular expressions on a sample text.
A word of caution
Be careful when using online regex testers, however, as they are usually designed to teach a particular flavor of regular expressions, such as for the regex parsers inside JavaScript, PHP, or Python. Some of the things you want to do may have the same regular expression syntax in your text editor as the one in these languages, or they may not. Depending on the complexity of what you are trying to do, it may be a better idea just to create a backup copy of your text data (or extract a small sample of the text in question into a new file) and experiment on it in your own text editor using its regular expression syntax.
Text sorting and processing duplicates
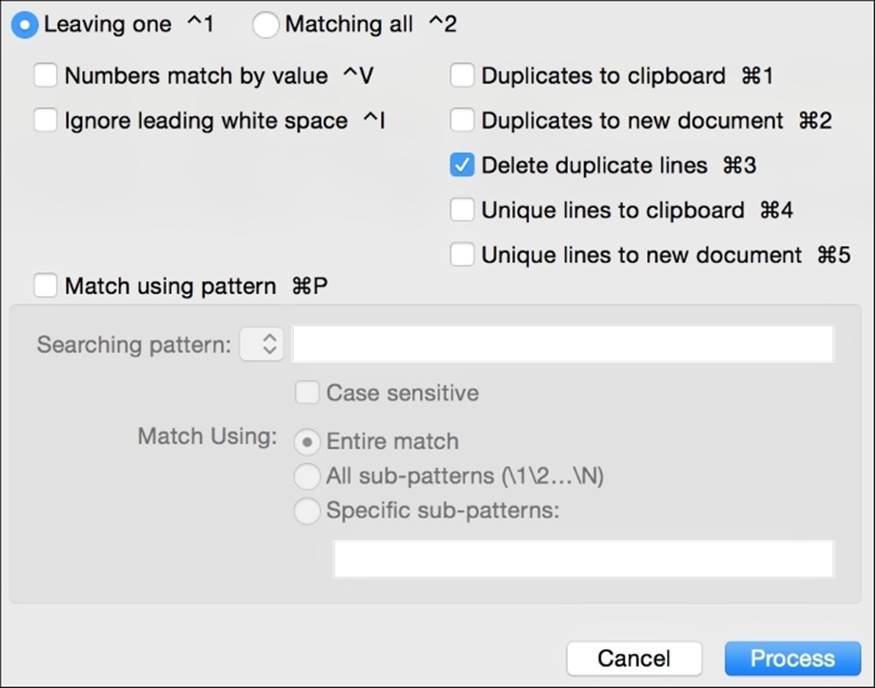
Once we have experimented with regex a little bit, we notice that our text editor will occasionally make these pattern-matching techniques available in other menu options, for example, in sorting and duplicate processing. Consider the following sorting dialogue to see how a regex can be applied to sorting multiple lines:
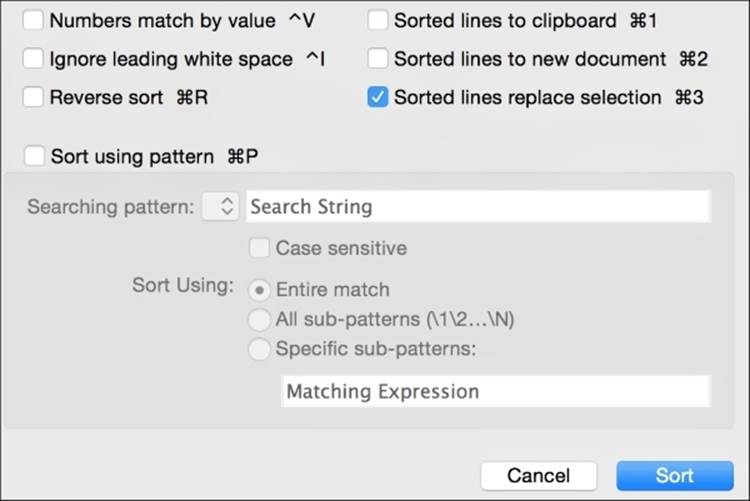
In this case, we can use the Sort using pattern checkbox to enter a regular expression pattern to sort by. The duplicate processing dialogue is similar. You can tell the editor whether to leave the original line or remove it. Interestingly, you can also remove the duplicates to another file or to the clipboard if you need to use them for something else, such as keeping a log of removed lines, perhaps.
Tip
In data cleaning, it is a good idea to at least consider saving the removed lines into their own file in case you ever need them again.
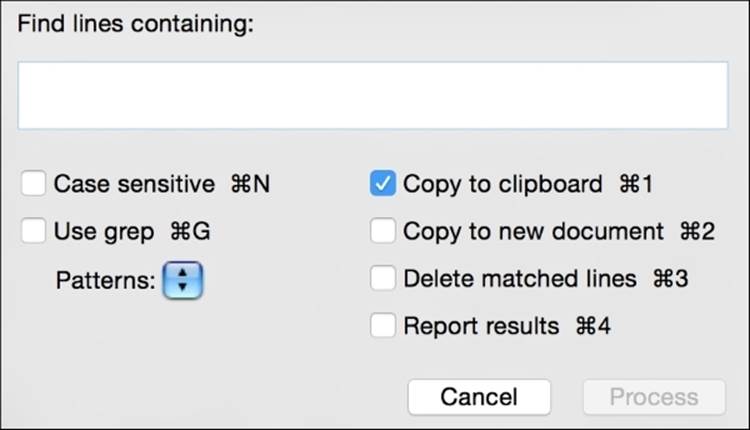
Process Lines Containing
One handy feature in Text Wrangler is called Process Lines Containing. It mixes searching (including the possibility of using a regular expression) with line-by-line processing, such as removing the affected lines to another file or to the clipboard, or deleting the matching lines.
An example project
In this example project, we will download a spreadsheet, use Excel or a text editor to clean it, and then run some simple analyses on it.
Step one – state the problem
This project is inspired by some data made available by the Chronicle of Higher Education, a publication about college and university news and happenings. In 2012, they created an interactive feature called "Who does your college think its peers are?". In this feature, users can enter the name of any US-based college or university into a form and see an interactive visualization showing which other universities call that target school a peer. (Peers are universities that are similar in some way.) The original data came from U.S. government reports, but the Chronicle has made the data underlying this visualization free for anyone to use.
For this example, we are interested in a complimentary question: When University X appears on a list, which other universities are on these lists? To answer this question, we will need to find all the other universities that are listed with University X, and then we will have to count how many times each of their names occurs.
Step two – data collection
In this step, we will see the procedure to collect data and then clean it in a step-by-step manner. The upcoming sections discuss the actions we need to take in order to collect proper data for our project.
Download the data
The data for this project can be downloaded from the original article at http://chronicle.com/article/Who-Does-Your-College-Think/134222/ or from the direct link to the spreadsheet at https://s3.amazonaws.com/03peers/selected_peers.csv.zip
The file is zipped, so use your unzip program of choice to unzip the file.
Get familiar with the data
The file inside the ZIP folder has a .csv extension, and it indeed is a CSV-delimited file with 1,686 rows in it, including a header row. The commas delimit two columns: the first column is the name of the university in question, and the second column is the list of all the universities that the original one listed as peers. These peers are themselves delimited by the pipe (|) character. Here is a sample row:
Harvard University,Yale University|Princeton University|Stanford University
In this case, the first column states that Harvard University is the target university, and the second column shows that Yale, Princeton, and Stanford have been listed by Harvard as its peers.
Step three – data cleaning
As the goal of this example is to look at one particular university and all the times it is listed as some other university's peer, our first goal is to clean out any row that does not have the target university in it. We will then transform the file into a single long list of individual universities. At this point, our data will be clean and we will be ready to go to the analysis and visualization steps.
Extracting relevant lines
Let's compare two methods for extracting relevant lines: one using a spreadsheet and one using a text editor with the techniques outlined in this chapter.
Using a spreadsheet
Open the file in a spreadsheet program, highlight any row that has Harvard written in it (or your target university of choice) using conditional formatting, and delete the rest of the rows.
Using a text editor
Open the file in a text editor and use Process Lines Containing to find all lines that have the Harvard University phrase (or whatever your university of choice is) included, and then copy them to a new file.
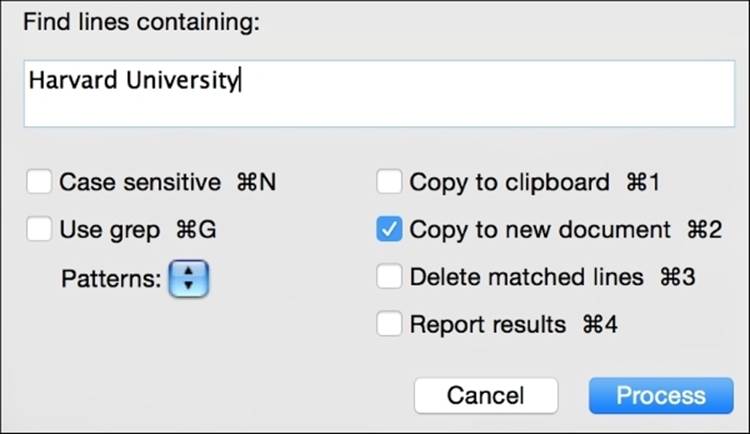
With either option, the result of this process is a new file with 26 lines in it, all of which include Harvard University somewhere in the line.
Transform the lines
Right now we have a file with 26 lines, each with multiple universities per line (wide data). We anticipate that we will probably be reading the file into Python at some point to perform a simple frequency count of universities. So, we decide that we want to change this to long data, with one university per line.
To transform the file so that there is one university per line, we will use a text editor and three instances of find and replace. First, we will find commas and replace them with /r (carriage return).
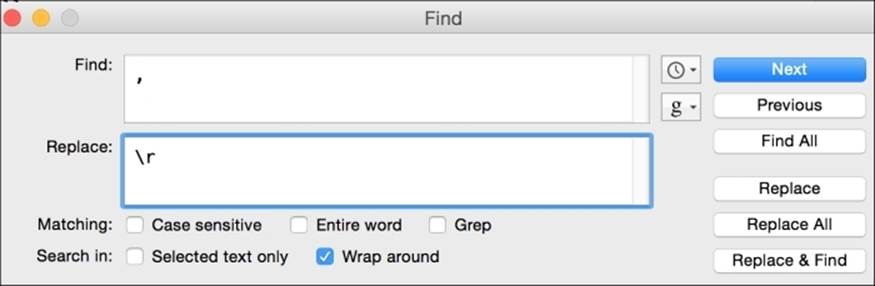
Next, find instances of the pipe character (|) and replace it with \r. At this point, the text file has 749 lines.
Finally, we need to remove all instances of Harvard University. (Remember, we are only interested in peers who are mentioned with Harvard, so we do not need Harvard itself in the count.) In Text Wrangler, we can put Harvard University\r in the Find box and leave the Replace box empty. This results in 26 lines deleted and a grand total of 723 lines in the file.
Step four – data analysis
As our main focus is data cleaning, we will not spend too much time on analysis or visualization, but here is a quick Python script to count how many times each of these peers are mentioned along with Harvard on some university's list:
from collections import Counter
with open('universities.txt') as infile:
counted = Counter(filter(None,[line.strip() for line in infile]))
sorted = counted.most_common()
for key,value in sorted:
print key, ",", value
The results show 232 unique universities and a count of how many times that university was mentioned. Here are the first few results. We can interpret these results as follows:
When Harvard is mentioned as a peer, Yale was also mentioned 26 times:
Yale University , 26
Princeton University , 25
Cornell University , 24
Stanford University , 23
Columbia University in the City of New York , 22
Brown University , 21
University of Pennsylvania , 21
At this point, you can take the list (or some portion of the longer list) and feed it into a bar graph or a word cloud or whatever type of visualization you think is persuasive or interesting. As the data is comma-delimited, you could even easily paste it into a spreadsheet program for further analysis. But at this point, we have answered our initial question about which peers are mentioned most, given a target university.
Summary
In this chapter, we learned some very practical tips for data cleaning using two easily accessible tools: text editors and spreadsheets. We outlined the available spreadsheet functions for splitting data, moving it around, finding and replacing parts, formatting it, and then putting it back together. Then, we learned how to get the most out of a simple text editor, including some of the built-in functions, and how to use find and replace and regular expressions most effectively.
In the next chapter, we will put together a variety of the techniques we have learned so far to perform some significant file conversions. Many of the techniques we will use will be based on what we have learned in the past two chapters about text editing, regular expressions, data types, and file formats, so get ready to solve some real-world data cleaning problems.
All materials on the site are licensed Creative Commons Attribution-Sharealike 3.0 Unported CC BY-SA 3.0 & GNU Free Documentation License (GFDL)
If you are the copyright holder of any material contained on our site and intend to remove it, please contact our site administrator for approval.
© 2016-2026 All site design rights belong to S.Y.A.