Better Business Decisions from Data: Statistical Analysis for Professional Success (2014)
Part IV. Comparisons
Chapter 12. Types of Error
How Wrong Can You Be?
Whenever a significance level is quoted, there is a chance that the stated result is incorrect. If the null hypothesis is rejected when, in fact, it is correct, the error is referred to as a Type I error. So, if our null hypothesis is that there is no significant difference between the mean marks from the boys’ results and the girls’ results in the same examination, we may decide that there is a difference, at the 5% level, say. If in fact there is no difference, and our result is simply due to the random effect embodied in our 1-in-20 chance of being wrong, then a Type I error has occurred.
Alternatively, our result may show no significant difference, and we would accept the null hypothesis. If we are wrong and there is in reality a difference, a Type II error has occurred.
A Type I error is the easiest to recognize because its probability is defined when the significance level of the result is stated. In the above example, if we conclude, in agreement with the null hypothesis, that there is no significant difference (at the 5% level) between the boys and girls, we have a 5% chance of making a Type I error. The error would be a false alarm in indicating a difference when none existed. The probability of a Type I error occurring is denoted by α (Greek letter alpha). A Type II error arises when no significant difference is indicated, albeit incorrectly, and is accepted and is therefore a missed detection. A false alarm and a missed detection are useful ways of thinking of the two kinds of error: the designations I and II do little to suggest which is which (Figure 12-1).
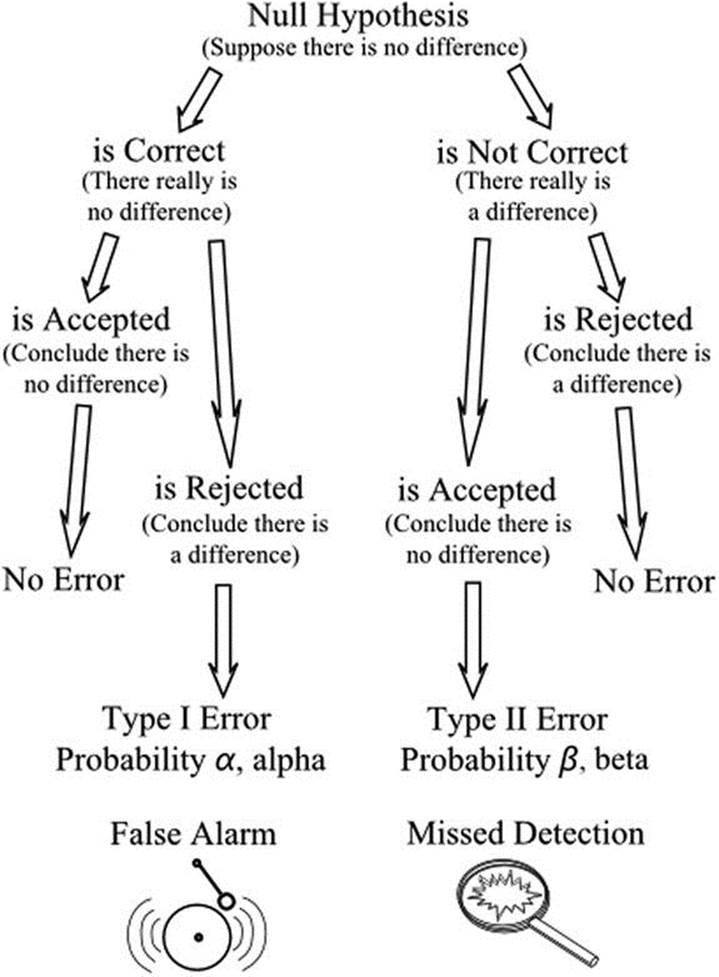
Figure 12-1. Type I and Type II errors, which arise when the null hypothesis is accepted though incorrect or when it is rejected though correct
An important purpose of hypothesis testing is to reject the null hypothesis when it is false. Thus the avoidance of a Type I error is important. A Type II error is generally less serious as it leaves the situation open for further investigation with improved resources. The power of a test is the probability of rejecting the null hypothesis when it is false—that is, it is equal to one minus the probability of a Type II error. The probability of a Type II error occurring is denoted by β (Greek letter beta), and the power of a test is therefore 1–β. The power dictates the probability of being able to find a difference if one really exists.
Note that we cannot calculate the probability of making a Type II error without additional information, because we have no knowledge of how far the true situation is from the situation stated in the null hypothesis. We have to set up an alternative hypothesis in a quantitative way. For example, for our class of students we could propose that the girls are 3% better than the boys on average, and test this as the alternative hypothesis.
If we reduce the chance of making a Type I error by testing at a higher significance level, say 1%, then we increase the chance of making a Type II error. There is a trade-off between the two. In situations of acceptance sampling involving a supplier and a customer, there is a conflict of interest. Suppose apples are being supplied, and a sample is examined. The null hypothesis is that the sample is not significantly different from the population from which it was drawn. If a Type I error occurs, it is to the supplier’s detriment, because the apples may be rejected when in fact they are satisfactory. If a Type II error occurs, the sample may indicate acceptance of the apples when in fact they are unsatisfactory. The customer is thereby disadvantaged. Reducing the probability of a Type I error increases the probability of a Type II error, and vice versa. However, by increasing the size of the sample, the probability of both types of error can be reduced. There is then a trade-off between the reduction of both errors and the cost of sampling.
A simple example will illustrate the two kinds of error. Suppose apples are obtained from a supplier whose apples are 10% bad. The customer accepts this level of quality in relation to the price paid. Keeping the numbers small to simplify the example, we assume that a batch of 10 apples is to be purchased. The customer decides to sample 3. If all 3 are satisfactory, the batch of 10 will be accepted. The null hypothesis is that the batch contains just one bad apple—i.e., 10%—in line with the expected proportion. The probability of all 3 in the sample being satisfactory is, by the multiplication rule, 9/10 x 8/9 x 7/8 = 0.7. So there is a probability of 0.7 of accepting the null hypothesis and accepting the batch of 10. Thus the probability of a Type I error—i.e., the probability of rejecting the batch when there is only one unsatisfactory apple in it—is 1– 0.7 = 0.3.
We cannot calculate the probability of a Type II error without more information. We would need to know or suppose, for example, that the batch of ten apples might contain two bad apples. The null hypothesis that there is just one bad apple in the batch is now false. The probability of all three apples in the sample being satisfactory is 8/10 x 7/9 x 6/8 = 0.47. Thus the probability of a Type II error—that is, the probability of the customer accepting the batch when the null hypothesis is false—is 0.47.
It is possible in practical situations to set up sampling arrangements to equalize the two types of error and thus equalize the supplier’s risk and the customer’s risk. In the above example, if the customer were to decide to sample 4 apples instead of 3, the probability of a Type I error would increase to 1–(9/10 x 8/9 x 7/8 x 6/7) = 0.4. The probability of a Type II error decreases to 8/10 x 7/9 x 6/8 x 5/7 = 0.33. Thus the risks are equalized somewhere between 3 and 4 apples being sampled with 4 apples being closer to the optimum.
REDUCING THE RISK
Hebdens was a large department store in the center of town, selling a wide selection of household goods. The store purchased a range of products from Plushcrocks, a manufacturer of ceramic goods such as plates, cups, saucers, and attractive, and very popular, ornaments. The goods were delivered to Hebdens in batches of 100. Five items from each batch were examined, and if all five items were free from damage or defects, the batch was accepted. This procedure was set up on an ad hoc basis at some time in the past.
In spite of this arrangement, Hebdens found themselves with a proportion of items that had to be scrapped or sold as seconds, and the number seemed to be rising, eating into the profits.
Roger Weyland, the quality control manager, decided to make a few calculations. It appeared to him that the percentage of unacceptable items had risen to over 5%, yet very few batches were ever rejected. At a defect rate of 5%, there would be, on average 5 defective items in every batch. The probability of the store accepting a batch when it contained as many as 6 defective items was 0.73 (73%, the customer’s risk)—yet the probability of rejecting a batch when it contained just 5 defective items was 0.23 (23%, the supplier’s risk). The arrangements were very much in favor of Plushcrocks, and Roger clearly needed to introduce a new procedure involving the examination of a larger sample of incoming goods.
Further calculations showed that if the number of items inspected was increased to 12, the risk of accepting the batch when it contained more than 5% defective items dropped to 48%, and the risk of rejecting the batch when it contained less than 5% defective items increased to 46%.
Roger took the matter up with Plushcrocks and, by demonstrating the equal risks for customer and supplier, he got agreement that 12 items would be inspected in the future and, unless all were defect-free, the batch would be rejected. The new procedure would not involve Hebdens in any appreciable increase in costs, but Plushcrocks would be faced with considerable additional work dealing with rejected batches. Roger realized that this was just the start. Armed with his calculations, he could continue to bring further pressure on Plushcrocks. Word went round that Plushcrocks had taken advice from a consultant statistician, with a view to improving their quality control arrangements!
All materials on the site are licensed Creative Commons Attribution-Sharealike 3.0 Unported CC BY-SA 3.0 & GNU Free Documentation License (GFDL)
If you are the copyright holder of any material contained on our site and intend to remove it, please contact our site administrator for approval.
© 2016-2026 All site design rights belong to S.Y.A.