Better Business Decisions from Data: Statistical Analysis for Professional Success (2014)
Part VI. Forecasts
Chapter 20. Control Charts
Navigating around the Factory
Quality control procedures are used in production processes to ensure that the products continue to meet the appropriate specifications. Usually, periodic sampling of the products is employed; and control charts, sometimes referred to as Shewhart charts, are used to record the results in order to anticipate the onset of problems in the production processes.
Two types of chart are in use, the choice depending on how the product is checked. If it is checked by a numerical measurement, the process is referred to as sampling by variable. If it is checked by observation of satisfactory or unsatisfactory features, the process is referred to as sampling by attribute.
Sampling by Variable
Most products that are produced to a specification have requirements for specific dimensions. Suppose, for example, a factory producing steel tubes with an internal diameter of 50 mm has an acceptable tolerance of ±1.0 mm. So tubes that are smaller in diameter than 49 mm or larger than 51 mm are defective and unacceptable. At the outset, measurements on large samples of tubes will have determined that the manufacturing procedures are producing tubes with a mean diameter of 50.2 mm, say, which is well within the tolerance. The samples will also have provided measures of the standard deviation, 0.25 mm, say. The difference between the mean and the maximum permitted size is 0.8 mm, which is 3.2 standard deviations. From tables of the normal distribution, we find that 3.2 standard deviations either side of the mean will include all but 1 in 1000 observations. The company may accept that a rejection rate of about 1 in 1000 is acceptable. Reducing the rejection rate would involve increased costs in ensuring that the manufacturing processes gave more consistent output. Of course, depending on the type and cost of the product, other companies may settle for very different rejection rates.
During production, samples will be taken periodically and the results recorded on the control chart. The samples will necessarily be small, perhaps consisting of five items. Figure 20-1(a) shows a typical layout of a control chart. On the vertical axis is a scale in mm, and the established mean value of 50.2 mm is shown as a horizontal line. Along the horizontal axis is a scale indicating the time or date of sampling. The mean value from each sample is plotted, and its relation to the target value of 50.2 mm can be readily appreciated.
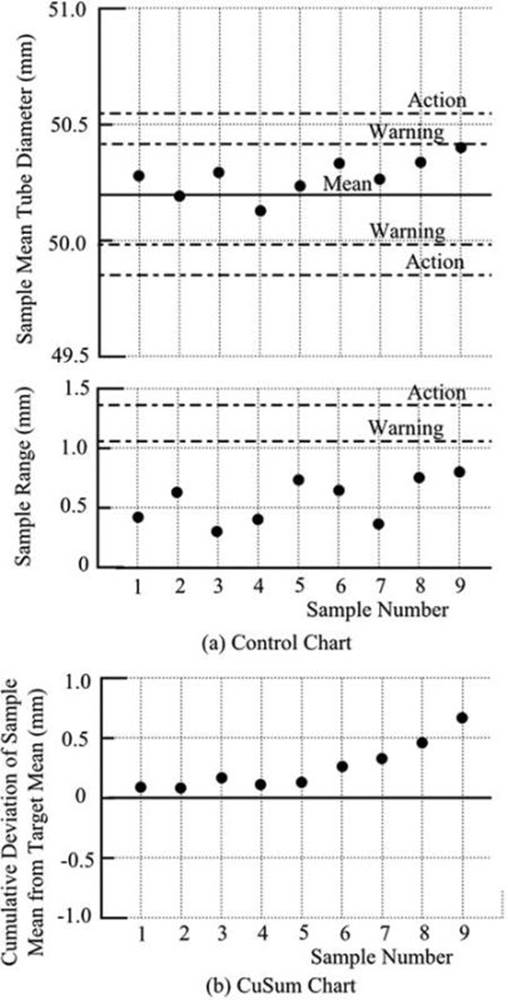
Figure 20-1. Control charts for sampling by variable
Either side of the 50.2 mm line are two more horizontal lines. The inner pair are the warning limits, and the outer pair are the action limits. If the sample means move toward one of the warning limits, the company will be forewarned of something amiss in the manufacturing processes and can instigate additional sampling or an investigation of the processes. Sample means reaching the action limits would indicate a serious problem. We shall shortly see how the warning and action limits are fixed.
Not only is it important to ensure that the mean value is being maintained, but it is also essential that the variability does not increase. In the lower part of the chart is a further set of horizontal lines to cope with variability. Again we have the target line, a warning line, and an action line. The target line could be set at the value of standard deviation, but because the calculation of standard deviation involves a degree of skill, it is common practice to use the range instead. The range from each sample can be easily recognized and plotted. The range of a series of values is related to the standard deviation, though it is a less precise measure of variability.
The warning limits are usually set so that there is about a 1 in 40 chance of the limit being reached on the assumption that the samples are still representative of the original products. The action limits are usually set so that the corresponding chance is about 1 in 1,000. The calculation of the limiting values is complicated by two factors. First, the samples are small, so the t-distribution is required rather than the normal distribution. Second, because the range is being used, a conversion has to be made from standard deviation to range, and the conversion factor varies with the number of items in the sample. To circumvent these difficulties, control-chart tables are published giving values of A and D for different sample sizes, which are used in the following expressions:
The tabulated values of A fix the limits such that six standard deviations of the sample mean, three each side of the mean, lie between the action limits, and four standard deviations, two each side of the mean, lie between the warning limits. The D values correspond appropriately.
In the example above, the expressions yield the following values, which are included in Figure 20-1(a):
The factor of 2.326 provides the conversion of the standard deviation of 0.25 to the value of the mean range, for a sample size of 5.
It is important to note that the tolerance plays no part in the setting up of the control chart. The tolerance, together with the mean and standard deviation from the initial large sample, determine the likely proportion of unacceptable items that will result, on the assumption that the production processes will not change in any way. The purpose of the control chart is to signal changes in the production processes that may, if not attended to, lead to an increase in unacceptable items. The control chart provides statistical control of the processes separately from decisions regarding the number of unacceptable items that can be tolerated.
An alternative form of chart, the cumulative sum or CuSum chart, is sometimes used. The difference between the sample mean and the target mean is accumulated, sample by sample, and plotted cumulatively, as shown in Figure 20-1(b). A change in gradient, either increasing or decreasing, indicates a departure from normal circumstances. An advantage of the chart is that small changes in mean show up more clearly than on a control chart.
Sampling by Attribute
Some products are either satisfactory or unsatisfactory and cannot be graded on a scale of defectiveness. Light bulbs, for example, either light up or refuse to. From what we have said previously, the situation will be recognized as a binomial one.
The periodic sampling must now involve larger samples than was the case with sampling by variable, discussed in the previous section. Clearly, a small sample would be likely to show no unacceptable items on a regular basis and would provide no useful information. Although the samples have to be larger, the checking of the items is likely to be much easier and quicker: checking a light bulb is more straightforward than measuring the diameter of a tube.
Suppose, staying with light bulbs, that the company accepts 1 defective light bulb in 100; and suppose that the periodic sampling involves 50 bulbs. The control chart, shown in Figure 20-2, records the number of defective bulbs in the sample.
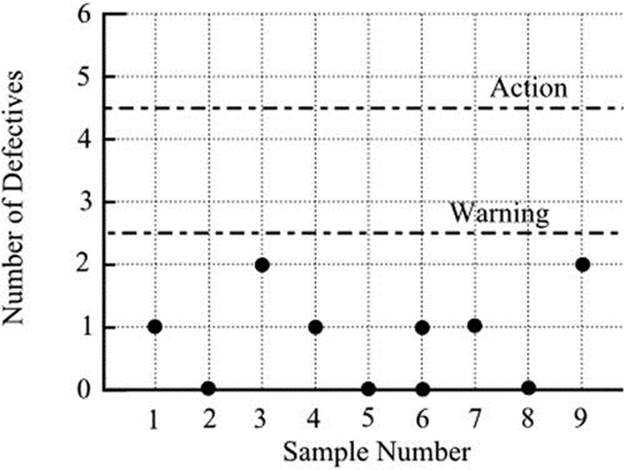
Figure 20-2. Control chart for sampling by attribute
On average, there will be 0.5 defective bulbs in each sample. We need to know the probability of there being 0, 1, 2, 3, … defective bulbs in a sample in order to set up a warning limit and an action limit. From tables of the binomial distribution, we obtain the following values for a sample size of 50 and an average level of defects of 1%.
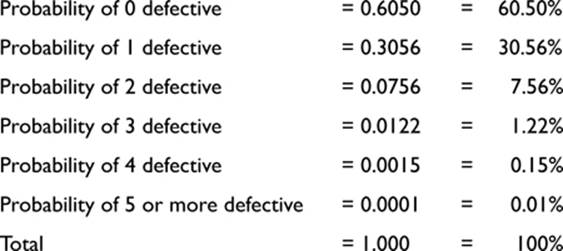
If the warning limit is set so that there is a 1 in 20 chance of the limit being reached, when there is in reality no change in the manufacturing processes, we require it to correspond to 5% probability. This arises between 2 and 3 defective bulbs, so the limit would be set between these values. Similarly, for the action limit, a chance of 1 in 1,000 corresponds to 0.1%, so the limit would be set between 4 and 5 defective bulbs. These limits are included in Figure 20-2.
All materials on the site are licensed Creative Commons Attribution-Sharealike 3.0 Unported CC BY-SA 3.0 & GNU Free Documentation License (GFDL)
If you are the copyright holder of any material contained on our site and intend to remove it, please contact our site administrator for approval.
© 2016-2026 All site design rights belong to S.Y.A.