Better Business Decisions from Data: Statistical Analysis for Professional Success (2014)
Part VI. Forecasts
Chapter 21. Reliability
Would You Trust That Bungee Cord?
Statistics plays an important part in reliability studies but represents only a part of the mathematical theory involved. Reliability of a component, machine, or system can be defined as the probability that it will perform its required function in the desired manner under the operating conditions when it is required to so perform. Reliability, R, is thus a probability with a value between 0 and 1, 0 representing immediate failure and 1 representing the (impossible) situation of never suffering failure. The probability of failure is 1 – R.
Basic Principles
Machines and systems consist of many components. Components themselves consist of assemblies of parts. Failure of a single part may lead to failure of a complete system, or perhaps not. A broken chain link causes failure of the length of chain, but failure of a single strand of wire in a wire rope does not lead to failure of the rope. Analyses can thus be seen to be complex because of the number of items involved and because of the ways that the items interact in the functioning of the assembly. Simple systems can be analyzed using the rules of combining probabilities, and by looking at these we can appreciate what is involved.
In the case of the wire rope, suppose the probability of failure of one strand within the required operating period is 0.001. There are three strands in the rope, and the rope does not fail until all three strands fail. We have here a parallel situation: the three strands are physically parallel to each other and the failure mode is referred to as parallel. For failure of the rope, we require failure of the first, the second, and the third strands. This is an “and” situation; and as we saw in Chapter 3, the probabilities have to be multiplied together, assuming of course that the failure of a strand is independent of the failure of other strands. Thus 0.001 × 0.001 × 0.001 = 0.000000001 is the probability of failure of the rope. It should be noted that these values are not realistic.
The chain links referred to above are physically in series, and we can represent the failure probabilities as a series. If the probability of failure of a link within the required operating period is 0.001, then, with three links, the chain fails if the first or the second or the third link fails. This is an “or” situation; and, again as we saw in Chapter 3, we need to add the probabilities. Thus the probability of failure of the chain (albeit only three links) is 0.003. The observant reader may have spotted that there is an error here. The three events are not mutually exclusive. We have not taken proper account of all the possibilities: two or all three links may fail. Furthermore, if we consider just one link failing, we have to include, by the “and” rule, the survival of the other two. With 3 links, there is a total of 8 scenarios, which are listed here together with the probability of each:
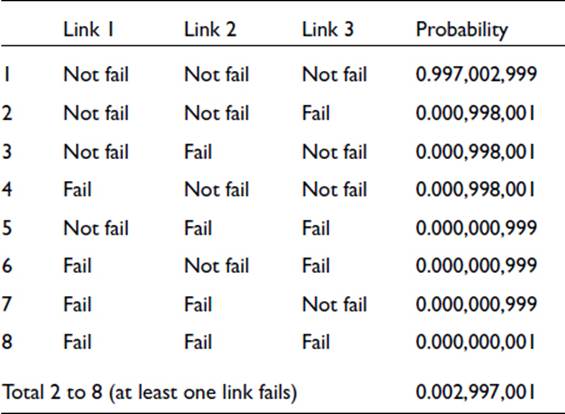
Two things are apparent from the tabled values. First, the probability of at least one link failing, shown by the total probability for scenarios 2 to 8, is extremely close to our originally proposed value of 0.003. This reflects the fact that when the probability of failure of a component is very small, the probability of two or more components failing in the same time period is even smaller—i.e., insignificant compared to the precision attached to the single-failure probability. In real situations, the failure probabilities are much smaller than in our simple example: a chain of several hundred links, with each link having a failure probability within the operational period as large as 0.001, would be quite useless. Thus, when the “or” rule is encountered in reliability situations, the individual probabilities can usually be added without loss of precision.
The second point of interest from the above values is that the probability of at least one link failing can be more easily obtained by calculating the probability of all three links failing and subtracting this value from unity.
With assemblies of many components, there will be groups of series items and groups of parallel items, and these groups may be combined in series or parallel fashion with other groups. Figure 21-1(a) shows a hypothetical example of a sprinkler system consisting of power and water supply, sensors, relays, valves, and the sprinkler head. The analysis can be undertaken by means of a fault tree, shown in Figure 21-1(b). The various items are connected to show the reliance of each item on the functioning of others. The connections are labeled according to whether the reliance is series or parallel: in other words, whether the reliance is “and” or “or.” Starting at the bottom of the tree, we would insert the individual failure probabilities for the components. We would work upward, multiplying at the AND gates and adding at the OR gates. The final failure probability would be subtracted from unity to give the reliability.
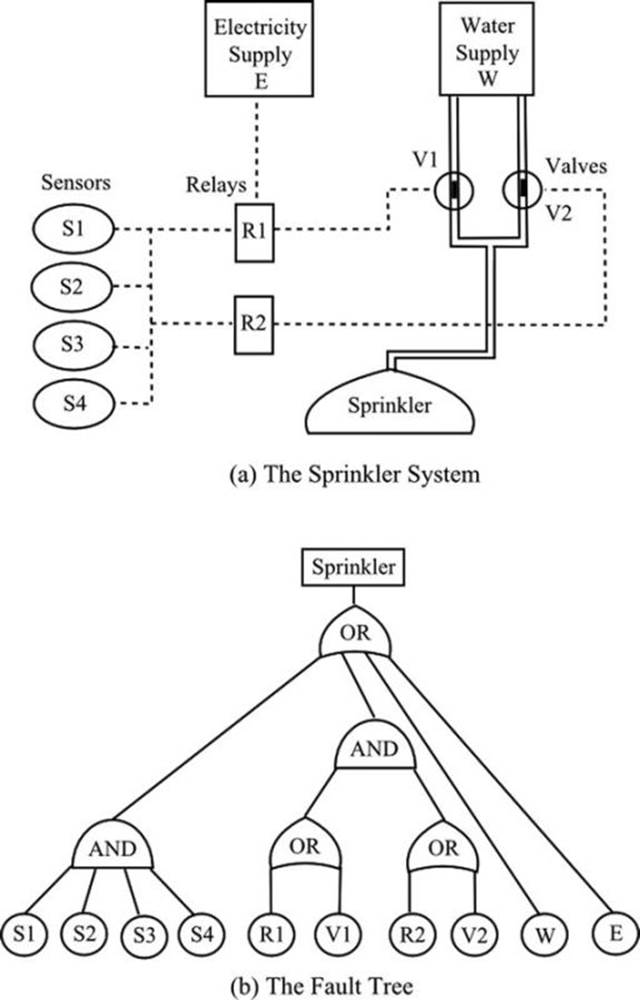
Figure 21-1. A hypothetical sprinkler system and its fault tree
Items may be combined in ways that are neither series nor parallel. Figure 21-2(a) shows a bell that is activated by two parallel paths; but the addition of Z, as in Figure 21-2(b), renders the system neither series nor parallel (Smith, 1976: 66). X or Z ensures the activation of x, and Z or Y ensures the activation of y. X, Z, and Y are not in parallel since X does not activate y and Y does not activate x. Compare the diagram with that in Figure 21-2(c), which shows X, Y, and Z in parallel and as a unit in series with the parallel arrangement of x and y.
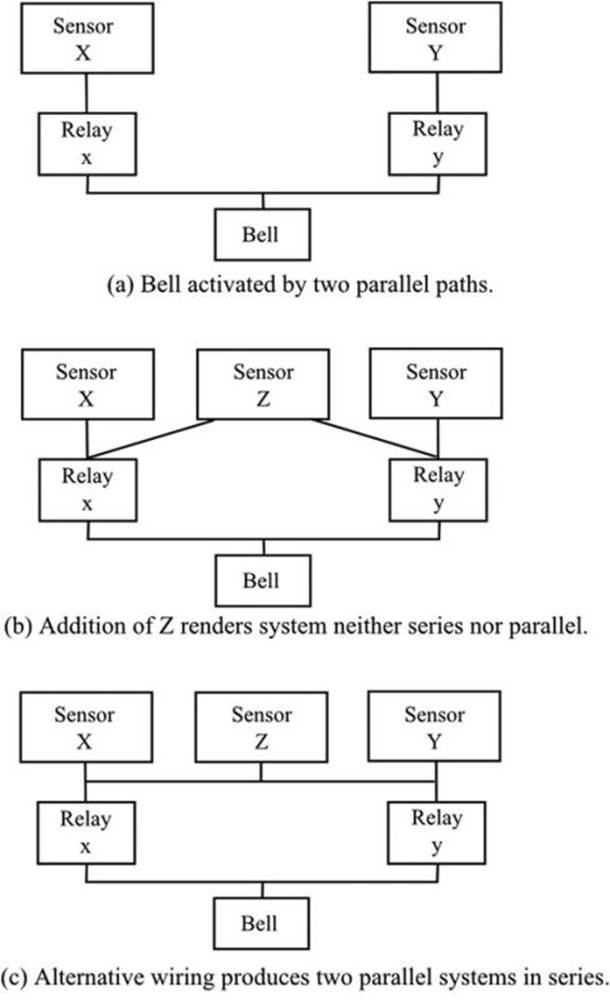
Figure 21-2. A diagram showing that some systems may be neither series nor parallel
Some such arrangements can be dealt with by conditional probabilities that you met in Chapter 3. In our example shown in Figure 21-2(b), consider first the condition that Z fails (probability Pz). Then we have in effect the arrangement shown in Figure 21-2(a), and we can calculate the failure probability (P1) in the normal way. Next, consider the condition that Z does not fail (probability 1 – Pz). X and Y are now irrelevant, and we need calculate only the failure probability (P2) of x and y in parallel. Bringing the two situations together, there is now an “or” situation: Z fails, or Z does not fail. The failure probability of the system is therefore
PzxP1 + (1–Pz)xP2
and the reliability is one minus this value.
Reliability Data
We discussed sampling at length in Chapter 4, and our main concern there was to ensure that the sample was representative of the population of interest. In reliability investigations this factor is still important, of course, but there is now an additional complication in that it is not easy to obtain the sample data. Some items, electronic components for example, are tested under service conditions for long periods until failure. A mean time to failure (MTTF) is obtained and can be used in predicting the reliability of assemblies. A general application of this approach has severe limitations. For many items, testing times would be long and expensive, and creating realistic service conditions would be difficult. When expected service lifetimes are very long, there simply is not the time available to test to failure. Accelerated testing, involving excessive forces, speeds, or environmental conditions, for example, must be used, though this means that the service conditions are not being reproduced exactly by the testing conditions. Testing times can be shortened by testing a number of items simultaneously and curtailing the tests when a percentage of the items has failed. Testing complete assemblies to failure is often a better option, but time and cost have to be considered.
When testing to failure is out of the question, historical evidence can be used. Items that have been employed for some time will generate data on time to failure. In novel, complex structures, it is likely that many of the components will have a history of usage in other applications that will give some guidance as to their expected reliability.
Distributions
Many different distributions are made use of in reliability analyses. The normal distribution may be appropriate for simple items failing in a well-defined manner; but as items and components become more complex, it is found more useful to assume that failure is a random event and that the probability of failure adopts a constant value. Thus the Poisson distribution, expressing the probability of a number of random events in a selected time period, and the associated exponential distribution, expressing the probability of specified time periods between random events, are used.
The Weibull distribution is often used. It was pointed out in Chapter 18 that this distribution has a deal of flexibility. It can describe a constant failure rate when failures are due to random events, and this is the likely situation during most of the lifetime of the assembly. There is generally a higher, but decreasing, failure rate when the assembly is new. This is the burn-in period, and the distribution can be used for this decreasing failure rate. Toward the end of the useful life (the wear-out period), the failure rate increases, and, again, the Weibull distribution can cope.
Practical Complications
In practice, most machines and equipment are not run until failure. Inspection and maintenance are carried out, and parts can be replaced or refurbished before failure occurs. Clearly this complicates calculations of reliability. The use of standby systems and the practice of derating equipment add to the complications.
It was mentioned above that failure is commonly assumed to be a random event except during the burn-in and wear-out periods. The burn-in period may be virtually eliminated by pre-service running and rectification, and the wear-out period may be virtually eliminated by maintenance.
ALARM BELLS
Luke Rogers was self-employed, running a small business in burglar alarms. He bought in components, designed systems for domestic and small business properties, and carried out the installation. He gave his customers a guarantee for two years, during which time he would respond rapidly to rectify faults and replace any required parts. To provide cover following this period, he sold maintenance contracts that were renewable each year.
He was having a problem with a large number of service calls to customers during the guarantee period. The fault was with a relay that was failing, often only a few months after installation. He had been somewhat foolish in purchasing a job lot of these relays very cheaply. The cost to him of a service call was considerable in terms of travel and time, whereas the cost of the replacement relay was, of course, negligible. A hidden but serious cost was the deterioration in his customer relations.
The solution seemed to be to scrap the stock of relays and purchase a batch of more expensive ones; but Luke’s daughter Louise, who was studying engineering at college, suggested that there might be a better option. She had some knowledge of statistics and knew about fault trees.
Using typical circuit diagrams of the installations and the data from the records of service calls, she produced an approximate fault tree. She could see that there were two relays in the circuit and they were effectively in series, so that if either failed, the system would shut down. The probability of either failing (an “or” situation) during the guarantee period, Louise calculated, was about 0.3. From this, she calculated that the probability of a single relay failing was 0.16.
Louise knew that components in parallel decreased the probability of failure (the “and” rule) and realized that if a pair of relays were wired together in parallel to replace the single relay, the probability of failure would decrease from 0.16 to 0.026 (i.e., 0.16 × 0.16). Replacing both single relays in the system in a similar way would give a probability of shutdown of the system of 0.052. The reduction of failure probability from 0.3 to 0.052, an 82% decrease, was impressive. Luke immediately introduced the doubling up of relays on all service calls, maintenance visits, and new installations until the poor-quality relays had all been disposed of.
It was noticed by her friends that Louise had a rather expensive new smart phone for Christmas that year!
All materials on the site are licensed Creative Commons Attribution-Sharealike 3.0 Unported CC BY-SA 3.0 & GNU Free Documentation License (GFDL)
If you are the copyright holder of any material contained on our site and intend to remove it, please contact our site administrator for approval.
© 2016-2026 All site design rights belong to S.Y.A.