Better Business Decisions from Data: Statistical Analysis for Professional Success (2014)
Part VI. Big Data
I am one of the unpraised, unrewarded millions without whom Statistics would be a bankrupt science. It is we who are born, who marry, who die, in constant ratios.
—Logan Pearsall Smith
In the previous chapters, we have been concerned with small and large samples, the dividing line usually taken to be at about 30 data items. Now we need to discuss very large samples—not just somewhat larger, but enormously larger. The transition to what has become known as big data has not only introduced new methods and procedures but also created a new way of thinking about statistics. It has rapidly advanced from relying on limited sampling to a situation in which all of us, knowingly or unknowingly, are involved in providing vast amounts of data.
Chapter 22. Data Mining
Twenty-First-Century Gold Rush
Data mining is a means of producing predictive information from large amounts of data. It is one of the fastest growing methods of forecasting in the business world and is exciting in the prospects it offers for the future.
The Growth of Data
Storage of large amounts of data is not new: libraries have existed since ancient times. More recently, companies have kept details of suppliers, customers, and staff. Records of business transactions, of purchases and sales, of expenses and profits, and so on, were stored initially in books and files. Later, electronic storage on databases gave considerable savings in effort and space. Such data have traditionally been used to provide information regarding the past and present positions of the company, but not as a tool for forecasting. This situation has changed as databases have become much larger and computers have provided faster processing and greater storage capacity. The often-quoted Moore’s Law says that computer capability doubles every two years or so. Without this phenomenal rate of growth, it would not have been possible to have the similar increases in the sizes of databases.
Databases have grown in two ways. If we visualize a database as essentially a two-dimensional table of data, the growth has been in the number of rows and the number of columns. Each row is an entry of new data, such as a new customer or a new sale or purchase. The numbers increase with time; and as storage becomes a decreasing problem, there is no pressure to eliminate older entries. The columns represent the variables: names, addresses, products, dates, etc. These have increased partly because, again, storage is no problem and partly because it has become easier to collect information. In retail activities, the scanning of barcodes on each item purchased allows the transaction to be recorded, along with other items in the same purchase, the time and date, and how the payment was made. If the purchase was paid for by the use of a store credit card, or if a loyalty card was presented, the customer’s personal details can be recorded. The Internet has provided an enormous amount of data. Each click of a button or link adds to the store. Much of the information in databases has been accumulated simply because it became easy to collect and store it, not because it was seen to be needed.
Not only have databases grown, but the bringing together of many databases has produced data warehouses. A large company will typically have many databases. These might be at different company sites or used for different purposes at the same site. By linking the databases together, vast amounts of information are potentially available. In terms of computer storage, there are data warehouses as large as several petabytes. One byte is about the storage space of one character of text: a petabyte represents the information in all the books stacked along a bookshelf about 6,000 miles long.
The realization that not only could a great quantity of information be retrieved from data warehouses, but that it could reveal relationships between the different variables, gave rise to data mining. The revealed relationships could potentially provide a means of predicting future trends and opportunities.
The growth in available data accelerates each year. It is said that 90 percent of the data we had in 2013 did not exist three years previously. Onsite data warehouses became inadequate for the amount of data that large companies were accumulating. Cloud computing, in which the storage is undertaken by an external provider, came to the rescue. Organizations provided online storage and analysis of data for customers by using large networks of servers.
This was the start of what has become known as big data. There is no precise definition of big data: it means you have more data than you can handle yourself. For an organization such as Amazon or Facebook, that would be hundreds of petabytes, but it could be very much smaller for a small business. Big data could also be said to be data that cannot be handled by conventional database technology, either because there is too much of it or because it is unstructured.
Mayer-Schönberger and Cukier (2013) start their comprehensive account of big data with a useful indication of the amount of data involved. Google processes more than 24 petabytes of data per day. Facebook gets 10 million new photographs uploaded every hour, and users click a Like button or leave a comment nearly 3 billion times a day. Users of YouTube upload an hour of video every second. The number of messages on Twitter exceeds 400 million a day. Some estimates suggest that in 2013, about five exabytes of data were created in the world every few minutes (FT Reporters, 2013). This quantity is equivalent to the books on a bookshelf 30 million miles long.
Big data is often described in terms of three features: the three Vs. In addition to volume, there are considerations of velocity and variability. Velocity refers to the speed at which the data can be collected, stored, and analyzed and the findings applied. The data is from past transactions, and the conclusions need to be applied quickly if they are to be used to predict future events. The variability of the data is a characteristic that presents difficulties in the manner of storage and in the subsequent analysis. Numerical data is easily dealt with by traditional methods; but unstructured data involving text recognition, translation, voice recognition, video clips, and music is less easy to handle. A fourth V is sometimes included, referring to veracity. Clearly, truth and reliability are vital if results of analyses are to be utilized.
Because the amount of data is very large, testing the revealed relationships can be extremely reliable. The relationships can be tested using blocks of data that have played no part in their development. Of course, when the relationships are used to predict future events, there is still extrapolation. Anything may change in the future. It is important, therefore, to repeatedly revise the relationships and to apply the results without delay. For this reason, it is often better to make use of a readily obtained prediction rather than delay in searching for a more sophisticated one. Indeed, techniques have advanced from analyzing historical data to providing real-time results.
Data Warehouses
Data warehouses are produced by bringing together many databases of the traditional type, and we can look briefly at these to see how the assembled data warehouses differ. The traditional databases are transactional in that they allow operatives to input new data either automatically—from barcodes, for example—or manually. Operatives can also edit or delete data. Information from the databases is obtained by inputting appropriate queries.
The databases are normalized. This means the data are stored in many separate tables in order to ensure that any datum is stored only once. For example, the same supplier could be involved in many purchases, and it would be unwise to record the supplier’s details repeatedly for each purchase. Errors could arise within the repeated entries, and a change of address would cause problems in updating. The result is that a separate table is used for supplier details. There are further stages involved in normalization to minimize anomalies and redundancies, and the final result is a multiplicity of tables linked in a fairly complicated network. The disadvantage of this kind of structure is that, when queries are required, the setting up and processing involved are relatively slow. The situation is acceptable when the database is not very large but becomes an increasing problem as the database grows.
The data from the databases are transferred to the data warehouse automatically and periodically. No data are added or altered piecemeal by operatives, so the normalized structure of the database can be largely abandoned. This allows a star structure of tables, as shown in Figure 22-1, which has fewer links between the tables. The central table, called the fact table, contains the numerical or descriptive data. The surrounding tables are allocated to the variables of interest, and each table links directly to the central fact table. The arrangement is designed to speed up the retrieval of information.
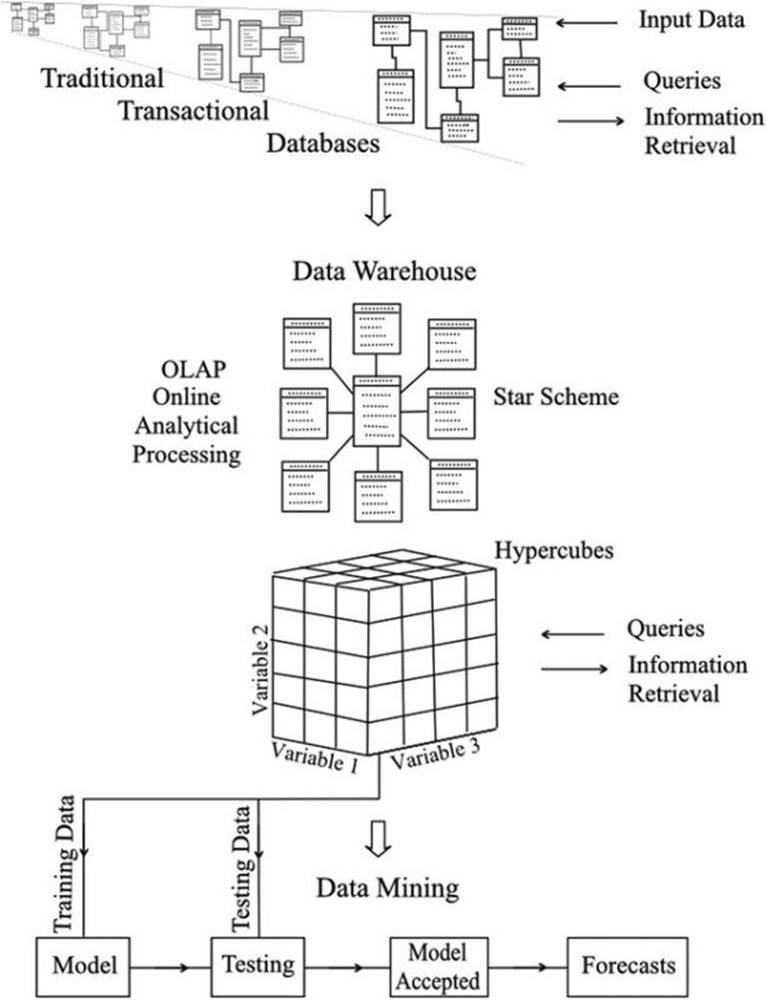
Figure 22-1. The development of data mining from traditional databases
In spite of these measures, the retrieval of information would not be acceptably fast without two further factors. One is the introduction of parallel processing of the data. A computer can do only one operation at once, though because it can do so very quickly, it may seem that it is multitasking. If the speed of processing is inadequate because of the vast number of steps to be performed, speed can be increased only by adding further computers or processors to work in parallel, simultaneously; and this is what has been done.
The second factor is the concept of cubes and hypercubes to allow automatic aggregation of data in readiness for retrieval. A diagram of a cube is included in Figure 22-1. Strictly speaking, it is a cuboid, as the sides are not of equal length; but the name cube has become the standard terminology. The three axes (sides) of the cube represent levels of three variables, and the cells of the cube contain the appropriate data. Summations can be carried out in the three directions at each level, and the aggregated values can be stored, ready for retrieval.
Thus, if we were interested in the sales of products in different outlets at different times, many of the totals we ask for would already be calculated and quickly obtained. We might want the number of an item sold in all outlets in 2011, say, and then request the total for a particular outlet in December 2011.
This example considers three variables only, but it is possible to set up hypercubes with many dimensions representing many variables. Unfortunately, it is not possible to draw them, even though it is no particular problem to define them mathematically as far as the computer is concerned.
In addition to aggregating totals, other readily calculated statistical indicators can be aggregated. Thus standard deviations and confidence limits can be made readily available, and also diagrammatic presentations of results, in the form of bar charts, for example.
Future Developments
The so-called Internet of Things is already with us to a limited degree, but its possible expansion is truly mind-boggling. Sensors can be attached to virtually anything to measure a range of properties and transmit data to a processing center. Details of any specified required action can then be transmitted to wherever the information is needed. Monitoring of engines and machinery in general has been around for some time, but current buzz is of domestic freezers that keep an inventory of their contents and signal when the stocks need replenishing. Flexible sensors fitted into clothing could detect when cleaning or replacement is required, or warn of a pickpocket or a lost bunch of keys. More important, and more feasible with present technology, is the proposal of benefits in health care by remotely monitoring patients in their own homes.
Two important advances that will eventually produce greater potential for big data are smaller devices for storage and processing, and faster processing.
The volume of space required to store or process a specified amount of data has decreased rapidly and currently halves every three years or so. Recent advances in nanotechnology are promoting research in manipulating units of storage at the atomic level. In 2012, IBM announced success in storing and retrieving 1 bit of data in the magnetic properties of just 12 atoms. Present technology requires about 1 million atoms per bit. In 2013, researchers from the University of Southampton, UK, demonstrated a laser method of achieving the storage of 360 terabytes of data on a small piece of fused quartz, a material that is exceptionally stable. Also in 2013, a team at Cambridge University stored 154 Shakespeare sonnets, a photograph, and a 26-second audio clip of Martin Luther King’s “I have a dream” speech on a speck of synthetic DNA.
As size is reduced, the problem of electrical circuits overheating increases. This is because although the electrical currents are small, they are very close together, and local temperatures can be high. The use of optical fibers holds the promise of smaller devices, as the passage of light pulses along the fiber does not generate appreciable heat. However, the production of optical computers is still some way in the future.
With regard to the speed of processing, parallel arrangement of computers is the only way of increasing it at present. A major breakthrough is expected in the future, though how far away it is no one can say, when the first practical quantum computers appear. Because of the quantum behavior of elementary subatomic particles such as electrons and photons, it is possible for them to be in two states at the same time. This allows, in principle, a computer circuit to be free from the limitation that each unit must be on or off, registering one bit. Instead, the unit can remain in both states, referred to as a qubit (“quantum bit”). Parallel processing is potentially possible with such an arrangement, and much research is pursuing the possibility. We await the results with interest!
STOCKING UP FOR STORMS
Walmart had big data before anyone had heard of big data, and not only had it, but was using it to improve its business operations in ways that many companies would rush to follow in subsequent years.
Back in September 2004, Hurricane Frances was moving across the Caribbean and heading for Florida’s east coast. Precautions were being taken. People moved to higher ground and prepared themselves as best they could.
Just three weeks earlier, Hurricane Charley had struck, and Walmart realized that in these difficult situations, shopping habits could be very different from usual. Executives could see that from the experience with Charley, it should be possible to predict demand and therefore supply goods in line with customers’ requirements.
Even then, Walmart had some 460 terabytes of data stored on its computers. The data came from 3,600 stores in which about 100 million customers shopped each week. Checkout scanners recorded sales item by item.
The available data relating to Hurricane Charley was mined, and the results revealed the products that were required in quantities greater than normal. Electric flashlights, of course, were evident, as we would have expected. However, the top-selling item was beer. The product that no one would have expected to be on the list was strawberry Pop-Tarts. The increase in sales of these, prior to the hurricane, was not marginal but was in fact seven times the normal rate.
As a result of the analysis, deliveries of the predicted desirables were made to the Walmart stores in the path of Hurricane Frances, and it was reported subsequently that most of the goods stocked specially for the incident sold quickly.
All materials on the site are licensed Creative Commons Attribution-Sharealike 3.0 Unported CC BY-SA 3.0 & GNU Free Documentation License (GFDL)
If you are the copyright holder of any material contained on our site and intend to remove it, please contact our site administrator for approval.
© 2016-2026 All site design rights belong to S.Y.A.