Data Science For Dummies (2016)
Part 3
Creating Data Visualizations That Clearly Communicate Meaning
Chapter 11
Web-Based Applications for Visualization Design
IN THIS CHAPTER
![]() Checking out online collaborative data visualization platforms
Checking out online collaborative data visualization platforms
![]() Evaluating your options for web-based spatial data analysis and mapping
Evaluating your options for web-based spatial data analysis and mapping
![]() Getting the scoop on some powerful, noncollaborative data visualization platforms
Getting the scoop on some powerful, noncollaborative data visualization platforms
![]() Digging into the best visualization platforms for creative infographic design
Digging into the best visualization platforms for creative infographic design
In recent years, the World Wide Web has seen an impressive rise in the number of easy-to-use online tools available for data visualization and infographic design. So you no longer need to purchase, download, install, and maintain proprietary software packages to help you do this type of work. Instead, you can choose from a seemingly limitless number of open-source, web-based solutions that are available to help you achieve practically any visualization goal you’re after. In this chapter, I bring you up to speed on the best options available to help you reach your specific goals.
Don’t worry if you’re not overly technical. With many of these web-based applications, you simply need to upload your data (often using a simple copy-and-paste operation), format it, and then quickly experiment with different chart-type offerings. Usually, the hardest part of this work involves finding answers to the following (quite agreeable) questions:
· Does my data look better in a bar chart or a line plot?
· Does my data look better in a map or a bubble chart?
· Should I go with something a bit more creative, like a text cloud or a heat map?
Get ready to be introduced to some of the web’s most popular and effective visualization tools. For each service, I give you a description of the platform, some examples of chart types offered by the application, and some links you can use to find and explore visualizations for yourself.
For sample data, I’ve used a dataset from the U.S. Census Bureau’s American Communities Survey (www.census.gov/programs-surveys/acs) that shows the number of people per state who, during the year 2011, changed addresses but remained within the same county. (Intriguingly, these nearby moves are three times more common in Nevada than in New Jersey.)
Designing Data Visualizations for Collaboration
Collaborative data visualization platforms are web-based platforms through which you can design data visualizations and then share those visualizations with other platform users to get their feedback on design or on the data insights conveyed.
Collaborative data visualization platforms have been described as the YouTube of data visualization, but actually, these platforms are far more interactive than YouTube. Collaborative data visualization platforms are like a version of YouTube that lets you instantly copy and edit every video using your own software tools and then republish the video through your own social channels.
Collaborative platforms are quite efficient and effective for working in teams. Instead of having to email versions back and forth, or (heaven forbid) learn a dedicated version-control system like GitHub, you and your teammates can use the platform’s sharing features to work on visualizations as a team.
Even if you don’t need or want to work with collaborators, collaborative platforms still have much to offer in the way of useful data analysis and visualization tools. These tools are often as powerful as (and sometimes even more powerful than) comparable desktop packages — just keep in mind that they often require users to publicly share their data and results so that others can view, modify, or use those results for their specific needs.
 Many sites offer freemium plans that allow you to keep your work private if you purchase a paid account.
Visualizing and collaborating with Plotly
The Plotly collaborative platform aims to accommodate the data collaboration needs of professionals and nonprofessionals alike. This powerful tool doesn’t stop at data visualization; it goes one step further by providing you with the tools you need to make sense of your data through advanced statistical analysis. Plotly even offers seamless integration with dedicated programming environments like Python, MATLAB, and R.
If you want a quick and easy way to create interesting and attractive data visualizations, Plotly offers a great solution. Although Plotly focuses on traditional data chart types, you can much more easily portray variables by size or color in Plotly than in most other web applications. If you work in one of the STEM fields, Plotly may be particularly well-suited for your needs. In addition to standard bubble plots, line charts, bar charts, and area graphs, Plotly offers histograms, 2-dimensional histograms, heat maps, scatter charts, boxplots, 3-dimensional scatter charts, 3-dimensional surface charts, and polar plots.
As far as collaborative functionality goes, Plotly provides you with features for social media sharing, user commenting, visualization modification and sharing, data sharing, and embed code usage so that you can embed and display your visualization directly on your website if you want.
 For all you techies out there, a cool collaborative feature of Plotly is its code-sharing feature. Each visualization hosted on Plotly offers you an option to see and copy the data visualization’s source code.
To use Plotly, you need to sign up for an account first. To do that, start by clicking the Sign-Up button in the upper-right corner of Plotly’s home page (at https://plot.ly). Luckily, the Plotly platform has a large user base and is in active development, with new features being added all the time. If you get stuck, you can find a lot of answers, either in its extensive online documentation (at http://help.plot.ly) or at the Plotly corner of the popular technical Q&A website Stack Overflow (http://stackoverflow.com/questions/tagged/plotly).
Figures 11-1 and 11-2 show two visualizations created with Plotly — a set of interactive boxplots that show the distribution of some variables from the mtcars dataset (a dataset that you can get from the GitHub repository for this book, https://github.com/BigDataGal/Data-Science-for-Dummies), and a 3D scatter plot that shows the ground-truth classification of observations in the iris dataset (also available from this book’s GitHub repository). (Note:You can also get these datasets, and tons of other ones, for free in the R datasets package, located on CRAN at https://stat.ethz.ch/R-manual/R-devel/library/datasets/html/00Index.html.) Lastly, to see all sorts of new visualizations as they’re published, check out Plotly’s Graphing News Feed (at https://plot.ly/feed).
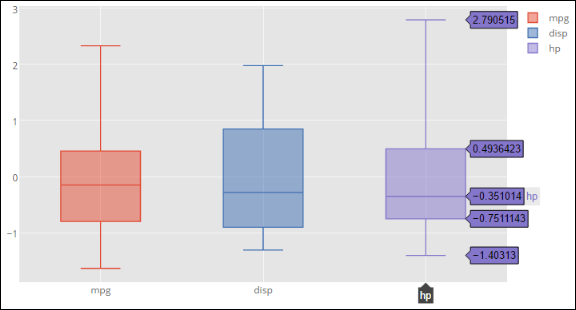
FIGURE 11-1: Interactive boxplots in Plotly.
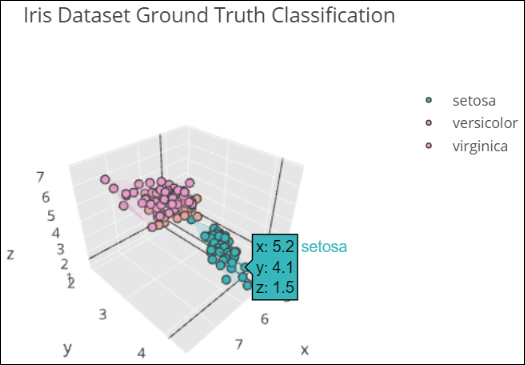
FIGURE 11-2: Three-dimensional scatterplot in Plotly.
Talking about Tableau Public
Tableau Public (www.tableausoftware.com/public) is a free desktop application that aims to be a complete package for chart-making. If its name sounds familiar, it may be because Tableau Public is the free version of the popular Tableau Desktop program. As part of the freeware limitation, the application doesn’t let you save files locally to your computer. All of your work must be uploaded to Tableau Public’s cloud server, unless you purchase the software.
Tableau Public creates three levels of document: the worksheet, the dashboard, and the story. In the worksheet, you can create individual charts from data you’ve imported from Access, Excel, or a text-format .csv file. You can then use Tableau to easily do things such as choose between different data graphic types or drag columns to different axes or subgroups.
 You have to deal with a bit of a learning curve when working with the flow of the application and its nomenclature — for example, dimensions are categorical data and measures are numeric data.
Tableau offers many different default chart types: bar charts, scatter plots, line charts, bubble charts, Gantt charts, and even geographical maps. Tableau Public can even look at the type of data you have and suggest types of charts that you can use to best represent it. For example, imagine that you have two dimensions and one measure. In this situation, a bar chart is a popular choice because you have two categories of data and only one numeric measure for those two categories. But if you have two dimensions and two measures, a scatter plot might be a good option because the scatter plot data graphic allows you to visualize two sets of numerical data for two categories of data.
You can use a Tableau dashboard to combine charts with text annotations or with other data charts. You can also use the dashboard to add interactive filters, such as check boxes or sliders, so that users can interact with your data to visualize only certain time series or categories. With a Tableau story, you can combine several dashboards into a sort of slide show presentation that shows a linear story revealed through your data.
And at last, you can use Tableau Public’s online gallery to collaborate and share all the worksheets, dashboards, and stories that you generate within the application. You can also embed them into websites that link back to the Tableau Public cloud server.
Visualizing Spatial Data with Online Geographic Tools
With the advent of online Geographic Information Systems (GIS, for short) like Google Maps, Open Street Map, and Bing Maps, geographic data visualization is no longer solely reserved for cartographers and GIS gurus. Web-based mapping applications have now made it possible for data enthusiasts from a wide range of backgrounds to quickly and easily analyze and map spatial data.
The purpose behind all web-based geographic applications is to visually present geographic data — quantitative and qualitative data that’s associated with particular locations. This area of data science intersects heavily with cartography and spatial statistics. You can learn more about GIS in Chapter 13.
Newbies often get confused about one important aspect of geographic data visualization: Geographic data is always presented as a point, a line, or a polygon area on a map.
If you need to define an area within particular boundaries, as would be the case with a county boundary, country border, sales district, or political focus area, use a polygon. Because polygons include boundary lines as well as the entire area that lies within those boundary lines, they’re the best way of representing areas on a map.
In web-based geographic data visualization, you’re likely to represent areas using either a categorical fill or a choropleth map. A categorical fill is a way to visually represent qualitative attributes of your spatial dataset. For example, when you’re looking at a map that shows an election outcome, states with a majority of Democrat votes are colored blue, and states with a majority of Republican votes are colored red. The categorical attribute is “Political Party,” and the fill color is determined by whether the value of that categorical attribute is “Republican” or “Democrat.” On the other hand, a choropleth is a map representation where spatial areas are filled with a particular hue or intensity of color to represent the comparative distribution of your data quantities across space.
If you want to represent your data as single markers plotted by latitude and longitude, you plot point data. The red, inverted droplet of Google Maps is a prime example of point data on a web-based mapping application. You can represent spatial data with line features as well. A line feature consists of a start node, an end node, and a connective line between them. Lines are commonly used to represent streets, highways, and rivers.
Lastly, you can also create heat maps from point data. To illustrate this concept, imagine that you want to show the density of coffee shops in Seattle. Rather than display thousands (and thousands) of markers on a map, it would be far more effective to aggregate your data into bands of color that correspond to coffee shop density per unit area. So, in this example, if you have 30 coffee shops in a 1-square-mile area, you cover this area in a hot red color on the map; but if you have only three coffee shops in 1 square mile, you cover that area of the map in a cool blue color.
The area and marker display type can change with the zoom level, depending on what web application you use and how it renders markers. For example, in a view of the entire Earth, New York City may appear as a marker; but if you zoom in to the state of New York, the city is represented as an area.
Web-based geographic data visualizations depend heavily on geocoding — the automatic association of data points with geographic points, based on the location information you provide. If you have a column of state names, or even street addresses, web applications generally can automap that data for you.
Web-based geographic applications can sometimes be quite finicky with their data standards. For geocoding functions to work effectively, you may need to reformat some data so that it better meets those standards. For example, a web-application that recognizes District of Columbia might not recognize Washington, D.C. Format your data accordingly. Because each application has its own requirements, you have to check those on an application-by-application basis.
Making pretty maps with OpenHeatMap
OpenHeatMap is a user-friendly service that allows you to upload and geocode spatial data. OpenHeatMap can automatically geocode spatial identifiers, requiring only minimal user oversight. It’s not as versatile as Google Fusion Tables or CartoDB, but it’s so easy to use that many people consider it their favorite web-based mapping application. A unique feature of OpenHeatMap is that it doesn’t offer user accounts. Anyone and everyone can upload data and use the service anonymously. To learn more, just go over and check out the OpenHeatMap home page (at www.openheatmap.com).
If your goal is to quickly create a choropleth or marker-based heat map, OpenHeatMap is the easiest solution on the Internet. “How easy?” you ask? Figure 11-3 shows a choropleth of the in-county moving dataset created in OpenHeatMap, which I managed to put together in a matter of seconds. Not bad, right?
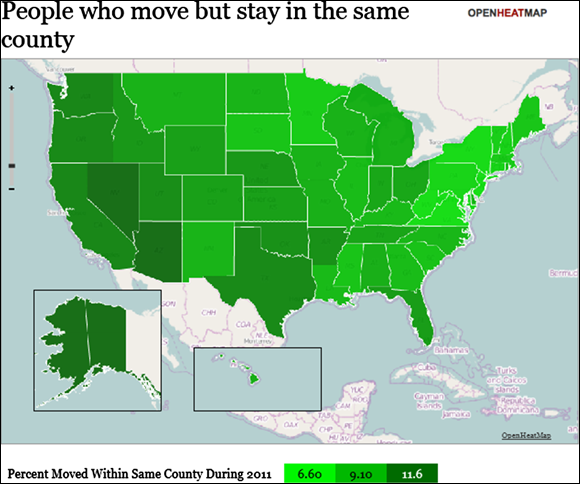
FIGURE 11-3: Choropleth map in OpenHeatMap.
Mapmaking and spatial data analytics with CartoDB
If you’re not a professional programmer or cartographer, CartoDB is about the most powerful online mapping solution that’s available. People in information services, software engineering, media and entertainment, and urban development industries often use CartoDB for digital visual communications.
By using CartoDB, you can create a heat map simply by uploading or linking to a list of spatial coordinates. Likewise, if you want to create a choropleth map to show values for quantitative attributes, simply upload or link to a set of spatial coordinates that includes attribute data.
CartoDB allows you to overlay markers and shapes on all sorts of interesting base maps. You can use it to make anything from simple outline maps of geographic regions to stylish, antiqued, magazine-style maps. You can even use it to generate street maps from satellite imagery. CartoDB’s geocoding functionality is so well implemented that you can drill down to a location using individual addresses, postal codes, or even IP addresses.
 To get going in CartoDB, you need to first set up a user account. You can do that via the CartoDB home page (at http://cartodb.com).
For more advanced users, CartoDB offers these options:
· Link to SQL databases.
· Customize Cascading Style Sheets (CSS).
· Incorporate other chart types in the form of superimposed graphs, outlines, and 3-dimensional surface plots.
Figure 11-4 shows CartoDB’s version of the sample choropleth map of the in-county moving dataset, and Figure 11-5 shows a bubble map of the same dataset. CartoDB is interactive: It allows you to click features to see attribute information and turn map layers on and off in the same map interface.
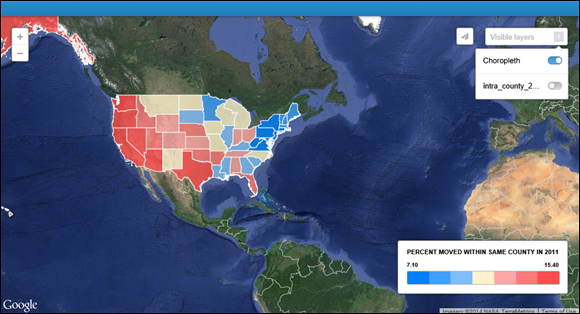
FIGURE 11-4: An interactive choropleth map in CartoDB.
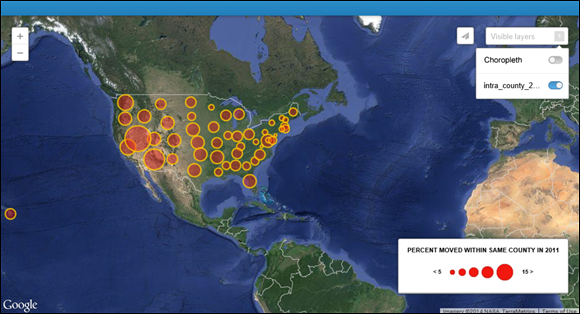
FIGURE 11-5: An interactive bubble map in CartoDB.
Map layers are spatial datasets that represent different features on a map. In shared areas, layers often overlap one another in the same spatial region. To better understand this concept, think again about a map that shows an election outcome. This type of map has a States layer and a Political Party layer. The States layer shows you the name and spatial boundary of the state. The Political Party layer, geographically overlaid on top of the States layer, tells you, state by state, how the majority of voters voted in the election. Although the layers overlap in physical location, both the states layer and the political party layer are based on separate, individual datasets. This is how layers work in mapping applications.
Visualizing with Open Source: Web-Based Data Visualization Platforms
The sole purpose of a noncollaborative, open-source, web-based data visualization platform is to help you quickly and easily create data visualizations without the need to invest tons of time and money learning how to code them up from scratch. These services do away with the need for specialized or bloated proprietary software packages and let you simply upload your data to get the results you need. Most of these platforms aim to help you create visualizations that you can subsequently use offsite. Some services don’t even provide you with any storage capacity, so you have to store your data and visualizations on a hard drive, on the cloud, or on another remote data storage device.
Making pretty data graphics with Google Fusion Tables
Google Fusion Tables is an extension of Google Drive — the service for storing and editing office-type documents in the cloud. Google Fusion Tables can create visual communications in a wide range of industries, from information publishing to civil and environmental engineering, sustainable development, and real estate. Even human resource management can use it.
Because Fusion Tables only runs off data that’s stored in Google Sheets — Google Drive’s spreadsheet application — you must have a Google account with Google Drive (at www.google.com/drive) and Google Fusion Tables (at https://support.google.com/fusiontables/answer/2571232) activated. To easily create data visualizations with Fusion Tables, simply link your Google Sheets to the Google Fusion Tables application and then let the application do all the work. You can use Google Fusion Tables to create pie charts, bar charts, line charts, scatter charts, timelines, and geographic maps. You can also automatically geotag columns with place names that associate your data with single geographic points. Data that’s queried from Google Fusion Tables can even be mapped as points on a Google Map.
You can also use Google Fusion Tables to plot polygon data on top of Google Maps, but this task is a bit more challenging because Google Maps doesn’t play well with polygon mapping.
For all the benefits it offers, Fusion Tables has one major drawback: It has a steep learning curve. If you’re truly committed to using the application, though, Google offers a free online code lab (at https://developers.google.com/fusiontables/docs/v1/getting_started) from which you can figure out Fusion Tables at your own pace. If you become a more advanced user of Fusion Tables, you can bolster Fusion Tables’ capabilities with a powerful API — an application-programmer interface that tells software applications how they should interact with one another.
Using iCharts for web-based data visualization
iCharts offers a web-based visual analytics platform that allows everyone to create, embed, and share interactive charts. The product provides cloud-based, fully interactive analytics that can be connected to live data using a variety of connectors, including an iCharts API, Google Sheets, Google Big Query, and NetSuite. iCharts’ visual analytics are fully embeddable and have built-in SEO optimization and social sharing features. You can use iCharts to visualize your data through a variety of built-in chart types, including bar charts, column charts, pie charts, line charts, and free-form charts.
In addition to the free offering targeted to individuals (such as bloggers), the company offers paid plans focused on the following scenarios:
· Visual content marketing: Media companies and publishers can create, publish, and share interactive visualizations that allow them to offer a richer experience to their audiences and expand their brand reach.
· Embedded visual analytics: Companies of any size can embed iCharts within their enterprise systems to quickly visualize their data in real-time, with no IT support or data extraction or aggregation.
To get started using iCharts, first create an account (at www.icharts.net). To see what iCharts can do, check out Figure 11-6, which shows an iCharts version of a bar chart.
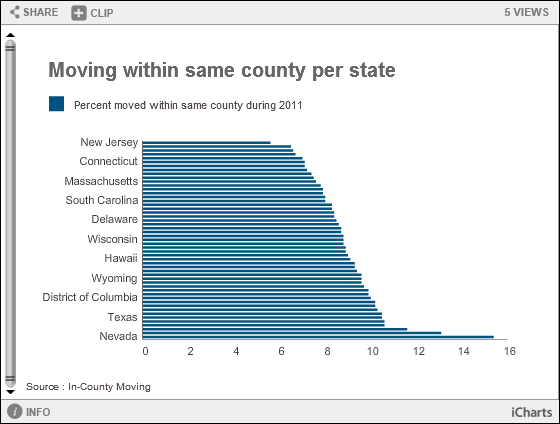
FIGURE 11-6: A bar chart in iCharts.
Using RAW for web-based data visualization
You can use the unique and unusual web application RAW to make artistic and creative visualizations from your dataset. RAW’s layout provides you with a simple drag-and-drop interface that you can use to make unique and interesting styles of data visualizations with just a few clicks of the mouse. If you want to get funky and cool with your data visualization, but you don’t have the time or money it takes to learn how to code this sort of thing for yourself, RAW is the perfect data visualization alternative.
Like I said, RAW is funky. It doesn’t even offer standard bar chart visualizations. It does, however, offer clustered force diagrams, Voronoi tessellations, Reingold-Tilford trees, and other, less-well-known chart types.
To use RAW, first go to the RAW home page (at http://raw.densitydesign.org) and then navigate to the USE IT NOW! button. You don’t even need to create an account to use the application — just copy and paste your raw data into the application and then choose the optimal chart types for that data. RAW makes it easy to choose between chart types by telling you the precise number of quantitative attributes, categorical attributes, and labels that are required to generate each plot.
This service wasn’t designed for novices, but its simple, straightforward interface makes it a fun, user-friendly application for playing with your data and figuring out how to generate unique chart types. Even if you don’t know a convex hull from a hexagonal bin, you can play around with settings, drag columns from place to place, and view how those changes affect the overall visualization. With enough practice, you may even end up using some of the visualization strategies that you learn from RAW in other contexts.
You can have fun getting cool and funky with visualization design, but always make sure that your visual result is easy to understand for the average viewer.
Figure 11-7 shows a circle packing diagram of the in-county moving dataset I created in RAW. (Note: This is just about the only type of visualization RAW offers that would work with such a simple dataset!)
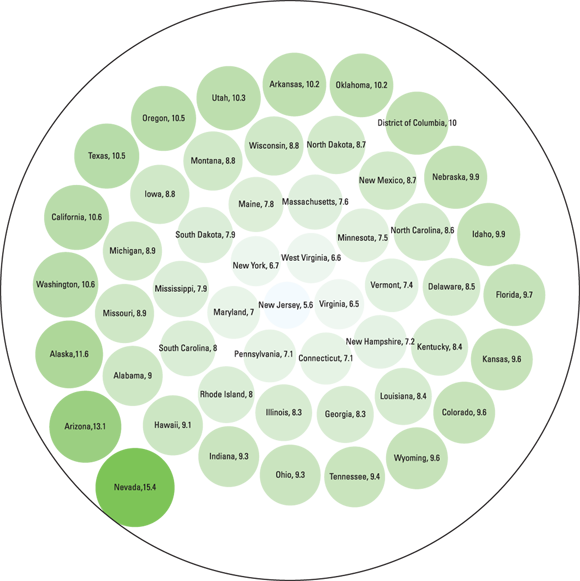
FIGURE 11-7: A circle packing diagram.
Knowing When to Stick with Infographics
Although the contextual difference between an infographic and a data visualization is often clear, even data visualization professionals can sometimes have a hard time distinguishing between the two. A good rule of thumb is that if the data graphics are primarily produced in an automated fashion using a data-graphing application, it’s a data visualization. But if you use a custom graphic-design tool, such as Photoshop or Illustrator, to produce the final product, it’s an infographic.
This categorization gets a bit more complicated, though. An infographic often incorporates one or more charts, making it more difficult to determine the manner in which the visualization was produced. Complicating the issue, online infographic design applications, such as Piktochart and Infogr.am, have dual functionality that allows for automated data graphing and customizable, artistic graphic design.
An even broader rule of thumb is that if the visualization looks artfully designed, it’s an infographic, but if it looks rather plain and analytical, it’s a data visualization.
Although infographics can be dynamic or static, when you’re designing a graphic for print, a slide for PowerPoint, or an image for social media syndication, just stick with static infographics. If you want to tell a story with your data or create data art, use an infographic.
You can easily and directly embed static graphics into a social media post. Social content that has an embedded graphic tends to get more attention and engagement than social content that is posted as text-only.
Applications used to create infographics provide many more creative alternatives than do traditional data visualization applications. In fact, this is as good a time as any to introduce you to a few of the better applications that are available for infographic design. Read on for all the details.
Making cool infographics with Infogr.am
Infogr.am is an online tool that you can use to make aesthetically appealing, vertically stacked card infographics — a visualization that’s composed of a series of cards, stacked vertically on top of one another, each with its own set of data graphics. Since the cards are stacked vertically, one on top of the other, the end infographic is often longer than it is wide.
Infogr.am offers a variety of trendy color schemes, design schemes, and chart types. With Infogr.am, you can import your own images to make an infographic that much more personalized. Infogr.am also provides you with sharing capabilities so that you can spread your infographic quickly and easily across social channels or via private email.
You can use Infogr.am to create stylish infographics that display bar charts, column charts, pie charts, line charts, area charts, scatter charts, bubble charts, pictorials, hierarchical charts, tables, progress displays, word clouds, tree maps, or even financial charts. To get started using Infogr.am, just head over to the home page (at https://infogr.am) and register for an account. Its freemium plan is robust enough to supply all your more basic infographic-making needs.
Figure 11-8 shows a bar chart of the (by now familiar) in-county moving dataset in Infogr.am.
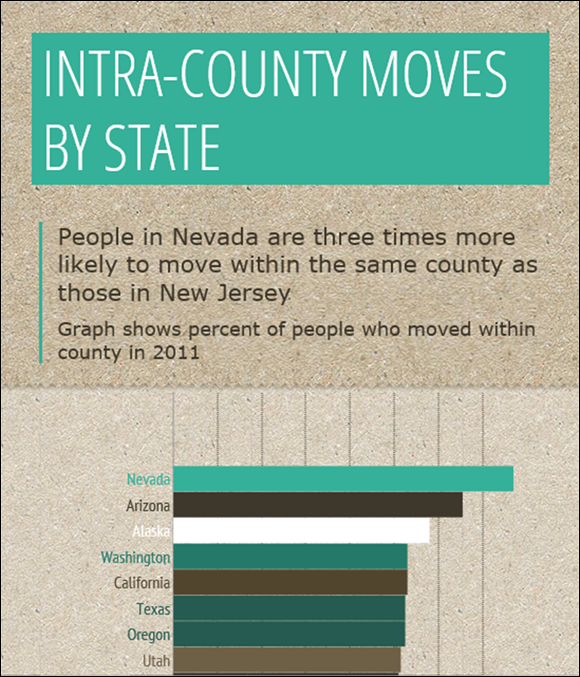
FIGURE 11-8: A bar chart in Infogr.am.
If you want to check out some great Infogr.am examples before you get started, you can view a live feed of featured infographics at Infogr.am’s Featured Infographics page (http://infogr.am/featured).
Making cool infographics with Piktochart
The Piktochart web application provides an easy-to-use interface that people like you and me can use to quickly create beautiful infographics. Piktochart offers a large selection of attractive templates, but be warned that only members who have paying accounts can access most of these templates. These templates are a great option if you want to save time and money on design but need to produce documents in an infographic format. Piktochart offers more creative flexibility than other comparable web applications, which makes Piktochart useful in a wide range of industries, from nonprofit grassroots to media and entertainment.
You can use Piktochart to make either static or dynamic infographics, and you can also link your infographics to Google Sheets for live updating. Piktochart offers the usual array of chart types, in addition to more infographic-oriented types, such as Venn diagrams, gauges, and matrixes.
If you use the free version of Piktochart to create your infographic, be warned that your infographic will be made available to the public. If you sign up for a paid account, however, you have the option of keeping your work private. You can register for Piktochart on the application’s home page at http://piktochart.com.
Using Piktochart, you can create infographics that display bar charts, triangle charts, line charts, area charts, scatter charts, pie charts, Venn diagrams, matrixes, pyramids, gauges, donuts, swatches, and icons. Figure 11-9 shows a Piktochart version of a bar chart of the in-county moving dataset example.
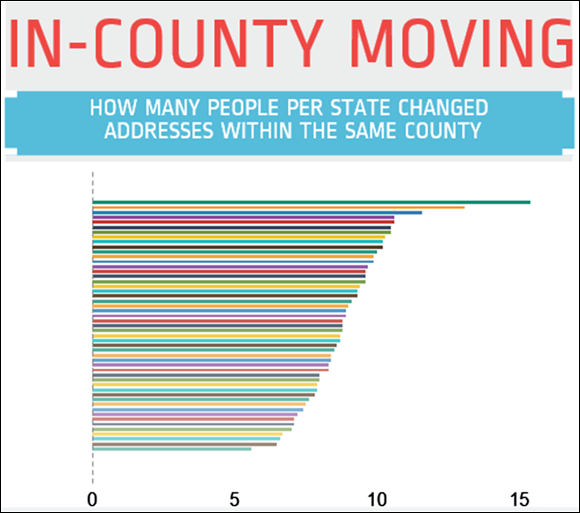
FIGURE 11-9: A bar chart in Piktochart.
All materials on the site are licensed Creative Commons Attribution-Sharealike 3.0 Unported CC BY-SA 3.0 & GNU Free Documentation License (GFDL)
If you are the copyright holder of any material contained on our site and intend to remove it, please contact our site administrator for approval.
© 2016-2026 All site design rights belong to S.Y.A.