Data Science For Dummies (2016)
Part 5
Applying Domain Expertise to Solve Real-World Problems Using Data Science
Chapter 21
Using Data Science to Describe and Predict Criminal Activity
IN THIS CHAPTER
![]() Talking about temporal data analysis
Talking about temporal data analysis
![]() Using standard GIS solutions
Using standard GIS solutions
![]() Seeing how advanced spatial statistics fit in
Seeing how advanced spatial statistics fit in
![]() Evaluating the limitations of the data science approach
Evaluating the limitations of the data science approach
In recent years, data science has been increasingly incorporated into criminological methodologies in a practice that’s been referred to as predictive policing. Predictive policing offers promising results, and law enforcement decision-makers have high hopes that they can use predictive intelligence to help them formulate more effective tactical strategies. Judges hope to use predictive insights for support when deciding when to grant bail to suspects. Police agencies want to use the technology for improved offender monitoring. Consequently, there’s a very high demand for crime analysts who are skilled at using data science to build descriptive and predictive information products to support the decisions of law enforcement officials.
To practice data science in criminal analysis, you need to be skilled in GIS, data visualization, coding, and basic math and statistics. If you want to go deeper into descriptive, predictive, or resource modeling, you need strong skills in spatial statistics. To practice as a data scientist in crime analysis, you also need a strong subject-matter expertise in the criminal justice field.
 Criminal data science practitioners aren’t replacements for crime analysts — rather, they enhance the work that crime analysts do. Crime analysts are responsible for analyzing and reporting crime data trends as they happen to keep law enforcement officials and public citizens aware so that they can take proactive measures to prevent future criminal activity. Crime analysts work with law enforcement officials to develop strategies and tactics to attack and reduce criminal activity. Data scientists in crime analysis, however, assume a more technical role in the data analysis. They use advanced math, statistics, and coding to uncover spatial and temporal trends hidden deep within crime datasets. Data scientists in crime analysis work to describe, predict, and model resources for the prevention of criminal activity.
Two distinct types of data analysis are relevant to criminology — temporal data analysis and spatial data analysis. Temporal data analysis involves the analysis of tabular datasets that contain temporally relevant but not geo-referenced data. Spatial data analysis involves analyzing geo-referenced datasets without regard to time. Spatial analysis can also involve analyzing tabular data that’s included within geo-referenced spatial datasets. It may even involve analyzing temporal data that pertains to the locations in question — which is known as spatio-temporal data analysis.
Temporal Analysis for Crime Prevention and Monitoring
The temporal analysis of crime data produces analytics that describe patterns in criminal activity based on time. You can analyze temporal crime data to develop prescriptive analytics, either through traditional crime analysis means or through a data science approach. Knowing how to produce prescriptive analytics from temporal crime data allows you to provide decision-support to law enforcement agencies that want to optimize their tactical crime fighting.
For purposes of this discussion, consider temporal data to be tabular data that’s earmarked with date/time entries for each record in the set. You use temporal data analysis to make inferences and draw correlations that you can use to monitor and predict what crimes are happening when and why. In crime analysis, an example of a temporal dataset would be a dataset that describes the counts of different types of crimes that have been committed, broken into count per day and recorded on a daily basis for an entire month.
To be successful at deriving simple, yet useful, insights from temporal crime data, you need only a basic skill level in data science. You should know how to draw fundamental statistical and mathematical inferences, how to spot and investigate outliers, how to analyze patterns in time series, and how to draw correlations or causations through regression techniques. When deriving insights from temporal crime data, you generally produce decision-support products in the form of tabular data reports and simple data visualizations — such as bar charts, line charts, and heat map charts.
Spatial Crime Prediction and Monitoring
Spatial data is tabular data that’s earmarked with spatial coordinate information for each record in the dataset. Many times, spatial datasets also have a field that indicates a date/time attribute for each of the records in the set — making it spatio-temporal data. If you want to create crime maps or uncover location-based trends in crime data, use spatial data analysis. You can also use spatial analysis methods to make location-based inferences that help you monitor and predict what crimes will occur where, when, and why. In the following sections, I show how you can use GIS technologies, data modeling, and advanced spatial statistics to build information products for the prediction and monitoring of criminal activity.
Crime mapping with GIS technology
One of the most common forms of data insight that’s used in law enforcement is the crime map. A crime map is a spatial map that visualizes where crimes have been committed during any given time interval. In olden days, you might have drawn this type of map out with pencil and paper, but nowadays you do the job using a GIS software, such as ArcGIS Desktop or QGIS.
Although crime mapping has become increasingly sophisticated while advances have been made in spatial technologies, the purpose has remained the same — to provide law enforcement decision makers and personnel with location information that describes on-the-ground criminal activities so that they can use that information to optimize their efforts in protecting public safety. GIS software can help you make crime maps that can be used as a descriptive analytic or as a source for simple inference-based predictions. (For much more about mapmaking and basic spatial analysis, check out Chapter 13.)
Going one step further with location-allocation analysis
Location allocation is a form of predictive spatial analytics that you can use for location optimization from complex spatial data models. For example, in law enforcement, location optimization can predict optimal locations for police stations so that dispatched officers can travel to an emergency in any part of the city within a 5-minute response-time window. To help your agency predict the best locations to position officers so that they can arrive immediately at any emergency in any part of town, use location-allocation analysis.
You can most easily do a location-allocation analysis by using the ArcGIS for Desktop Network Analyst add-on to carry out a maximum coverage analysis. (Check out ArcGIS for Desktop at www.esri.com/software/arcgis/arcgis-for-desktop.) In this form of analysis, you input data about existing facilities, demand points — points that represent places in the study area that exhibit a demand for law enforcement resources — and any spatial barriers that would block or severely impede law enforcement response times. The model outputs information about the optimal locations to place officers for the fastest, most well-distributed response times. Packages such as the Network Analyst add-on are easy to use, which is one of the feature benefits that might have you choose ArcGIS over open-source QGIS. Figure 21-1 shows map results that are derived from a location-allocation analysis.
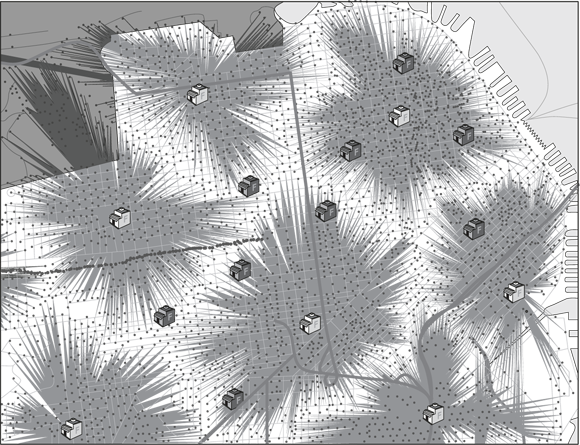
FIGURE 21-1: A map product derived from location-allocation analysis.
Analyzing complex spatial statistics to better understand crime
You can use your skills in GIS, mathematics, data modeling, and spatial statistics in many ways to build descriptive and predictive information products that support the decision making of law enforcement officials. Proprietary spatial-analysis software applications have greatly simplified this work by providing special add-on tools specifically designed for spatial analysis of crime data. In addition, free open-source applications such as the CrimeStat III program (www.nij.gov/topics/technology/maps/pages/crimestat.aspx) are available to help you carry out more advanced forms of statistical analysis. In the following sections, I introduce how you can use your data science skills to derive descriptive and predictive spatial data insights that help law enforcement agencies optimize their tactical response planning.
Delving into descriptive methods
You can incorporate descriptive spatial statistics into crime analysis in order to produce analytics you can then use to understand and monitor the location-based attributes of ongoing criminal activities. You can use descriptive spatial statistics to provide your law enforcement agency with up-to-date information on the location, intensity, and size of criminal activity hot spots, as well as to derive important information about the characteristics of local areas that are positioned between these hot spots.
This list includes types of approaches that are helpful when using spatial statistics for descriptive methods in crime analysis:
· Clustering: Use methods such as nearest neighbor algorithms (hierarchical and nonhierarchical) and the k-means algorithm to identify and analyze criminal hot spots, to describe the properties of inter-incident distances, or to describe spatial autocorrelation that exists between dense areas of criminal activity. To learn more about clustering methods, be sure to check out Chapter 6 of this book.
Spatial autocorrelation is a term that refers to the natural phenomenon that when things are closer to one another in physical location, they exhibit more average similarity than things that are far away from one another.
· Advanced spatial mathematics: You can use spatial mathematical metrics, such as the Euclidian metric or the Manhattan metric (otherwise known as the taxicab metric) to describe the distances between criminal incidents or sets of incidents. The Euclidean metric is a measure of the distance between points plotted on a Euclidean plane. The taxicab metric is a measure of the distance between points, where distance is calculated as the sum of the absolute value of the differences between two points’ Cartesian coordinates.
· Descriptive statistics: Use statistics to generate a description about the location distribution of criminal activities — including information on the directional mean and mean center of criminal incidents.
Building predictive spatial models for crime analysis
You can incorporate predictive statistical models into crime analysis methods to produce analytics that describe and predict where and what kinds of criminal activity are likely to occur.
Predictive spatial models can help you predict the behavior, location, or criminal activities of repeat offenders. You can also apply statistical methods to spatio-temporal data to ascertain causative or correlative variables relevant to crime and law enforcement.
The following list includes types of approaches that are helpful in spatial predictive modeling for crime analysis:
· Clustering: You can use kernel density estimation methods to quantify the spatial density of criminal activities and to generate comparative measures between the densities of criminal activity relative to the base population of the affected area.
Kernel density estimation (KDE) is a smoothing method that works by placing a kernel — or, a weighting function that is useful for quantifying density — on each data point in the dataset and then summing the kernels to generate a kernel density estimate for the overall region.
· Advanced spatial statistics: One example of this is to use regression analysis to establish how one or more independent crime variables directly cause, or correlate with, a dependent crime variable. Lastly, advanced spatial statistics are used to make behavioral predictions for repeat offenders and to predict future criminal activity based on historical records on criminal behavior and information about present conditions.
Modeling travel demand in criminal activity
Modeling the travel demand of criminal activity allows you to describe and predict the travel patterns of criminals so that law enforcement can use this information in tactical response planning. If you want to predict the most likely routes that criminals will take between the locations from where they start out and the locations where they actually commit the crimes, use crime travel modeling.
Travel demand modeling is the brainchild of civil engineers and was developed to facilitate improved transportation planning. Although you can use four different approaches in travel demand modeling — trip-based, integrated trip-based, tour-based, and activity schedule-based — the trip-based approach (see Figure 21-2) is most relevant to crime analysis.

FIGURE 21-2: A schematic that represents the travel demand model.
The trip-based approach is broken into the following four steps:
1. Trip generation.
Model the trip production (the quantity of crime trips that originate in a zone of origination — a spatial region, like a neighborhood or subdivision) and the trip attractions (the quantity of crime trips that end in the zone of destination — the spatial region where the criminal act is executed).
2. Trip distribution.
Incorporate a trip matrix — a matrix of rows and columns that covers a study area and depicts the patterns of trips across it— and a gravity model — a model that describes and predicts the locational flow of objects across space — to quantify the count of crime trips that occur between each zone of origination and each zone of destination.
3. Modal split.
A modal split is the portion of travelers that uses particular trip paths across a study area. For travel demand modeling, you’d generate a count of the number of trips for each zone-of-origination/zone-of-destination pair that occurs via each available route. The choice between routes can be modeled statistical or mathematical.
4. Network assignment.
Assign probability and predict the most likely routes that a criminal would take when traveling from a particular zone of origination to a particular zone of destination across the network of potential travel paths.
Probing the Problems with Data Science for Crime Analysis
Although data science for crime analysis has a promising future, it’s not without its limitations. The field is still young, and it has a long way to go before the bugs are worked out. Currently, the approach is subject to significant criticism for both legal and technical reasons.
Caving in on civil rights
The legal systems of western nations such as the United States are fundamentally structured around the basic notion that people have the right to life, liberty, and the pursuit of property. More specifically, the U.S. Constitution’s Fourth Amendment explicitly declares that people have a right “to be secure … against unreasonable searches and seizures, shall not be violated … but upon probable cause.” Because predictive policing methods have become more popular, a consternation has arisen among informed U.S. citizens. People are concerned that predictive policing represents an encroachment on their Fourth Amendment rights.
To see how this rights violation could occur, imagine that you’ve developed a predictive model that estimates a car theft will occur on the afternoon of January 15 at the corner of Apple Street and Winslow Boulevard. Because your predictions have proven accurate in the past, the agency dispatches Officer Bob to police the area at said time and day. While out policing the area, Officer Bob sees and recognizes Citizen Daniel. Officer Bob had arrested Citizen Daniel five years earlier for burglary charges. Officer Bob testified against Citizen Daniel and knows that he was subsequently convicted. Citizen Daniel is also a racial minority, and Officer Bob finds himself being suspicious on that basis alone (known as racial profiling, this is illegal, but it happens all the time).
Officer Bob, on said street corner, has a predictive report that says a theft crime is about to occur, and he’s in the presence of a man of a racial minority whom he knows has a history of committing theft crimes. Officer Bob decides that the predictive report, combined with what he knows about Citizen Daniel, is enough to justify probable cause, so he performs search-and-seizure on Daniel’s person.
The conundrum arises when one considers whether a predictive report combined with knowledge of past criminal activity is sufficient to support probable cause. Even if the predictive report were guaranteed to be accurate — which it’s not — couldn’t this decision to search Citizen Daniel just be mostly racial profiling on the part of Officer Bob? What if Officer Bob is just using the predictive report as a justification so that he can harass and degrade Citizen Daniel because Daniel is a minority and Officer Bob hates minorities? In that case, Officer Bob would certainly be violating Daniel’s Fourth Amendment rights. But because Officer Bob has the predictive policing report, who’s to say why Officer Bob acts in the way that he does? Maybe he acts in good faith — but maybe not.
Predictive policing practices open a gray area in which officers can abuse power and violate civil rights without being held liable. A significant portion of the U.S. population is against the use of predictive policing measures for this reason, but the approach has technical problems as well.
Taking on technical limitations
Data science for crime analysis is a special breed, and as such, it’s subject to certain problems that may not generally be an issue in other domains of application. In law enforcement, criminal perpetrators are acting according to their own intellects and free will. A brief analogy is the best way to describe the problem.
Imagine that you build a crime travel demand model. Based on the zone of origination, this model predicts that Criminal Carl will almost certainly travel on Ventura Avenue or Central Road when he goes to pick up his next shipment of drugs. In fact, the model predicts these same two routes for all drug criminals who depart from the same zone of origination as Criminal Carl.
Based on this prediction, the agency sets up two units, one on Ventura Avenue and one on Central Road, in the hope of catching Criminal Carl after the buy. Criminal Carl, of course, doesn’t know about all these plans. He and his buddy Steve travel Ventura Avenue, purchase their drugs, and then return back along the same route. It’s nighttime, so Steve isn’t so worried about wearing his seatbelt since he figures no one could see that anyway. As Criminal Carl and Steve make their way back, Officer Irene begins to tail them and look for a reason to pull them over; Steve’s seatbelt infraction is just cause. When Officer Irene talks to the men, she can tell they’re high, so she has probable cause to search the vehicle. Criminal Carl and Steve go to jail on drug charges, and when they’re released, they tell their criminal friends all the details about what happened.
The agency uses this model to catch six more drug offenders in rapid time, on either Ventura Avenue or Central Road. Each time they make an arrest, the offenders go out and tell their criminal associates the details of how they got caught. After six busts on these two roads within a relatively short period, local drug criminals begin to catch on to the fact that these roads are being watched. After word is out about this fact, no criminal will take these streets any more. The criminals change their patterns in random ways to avert police, thus making your predictive model obsolete.
This kind of common pattern makes it ineffective to use predictive models to reduce crime rates. After criminals deduce the factors that put them at risk, they avoid those factors and randomly assume a different approach so that they can perpetrate their crimes without being caught. Most of the time, agencies continually have to change their analysis strategies to try to keep up with the criminals, but the criminals are almost always one step ahead.
This is a more severe version of an issue that arises in many applications, whenever the underlying process is subject to change without notice. Models must always be kept up to date.
All materials on the site are licensed Creative Commons Attribution-Sharealike 3.0 Unported CC BY-SA 3.0 & GNU Free Documentation License (GFDL)
If you are the copyright holder of any material contained on our site and intend to remove it, please contact our site administrator for approval.
© 2016-2026 All site design rights belong to S.Y.A.