Data Science For Dummies (2016)
Part 2
Using Data Science to Extract Meaning from Your Data
Chapter 7
Modeling with Instances
IN THIS CHAPTER
![]() Overviewing instance-based learning
Overviewing instance-based learning
![]() Distinguishing classification from cluster methods
Distinguishing classification from cluster methods
![]() Working through average nearest neighbor algorithms
Working through average nearest neighbor algorithms
![]() Mastering the core features and characteristics of k-nearest neighbor algorithms
Mastering the core features and characteristics of k-nearest neighbor algorithms
![]() Seeing how nearest neighbor algorithms can be used in the retail sector
Seeing how nearest neighbor algorithms can be used in the retail sector
Data scientists use classification methods to help them build predictive models that they can then use to forecast the classification of future observations. Classification is a form of supervised machine learning: The classification algorithm learns from labeled data. Data labels make it easier for your models to make decisions based on the logic rules you’ve defined. Your plain-vanilla clustering algorithm, like the k-means method, can help you predict subgroups from within unlabeled datasets. But there’s more to life than plain vanilla. I think it’s about time to take things one step further, by exploring the instance-based family of machine learning algorithms.
Instance-based learning classifiers are supervised, lazy learners — they have no training phase, and they simply memorize training data, in-memory, to predict classifications for new data points. This type of classifier looks at instances — observations within a dataset — and, for each new observation, the classifier searches the training data for observations that are most similar, and then classifies the new observation based on its similarity to instances in the training set. Instance-based classifiers include
· k-nearest neighbor (kNN)
· Self-organizing maps
· Locally weighted learning
If you’re unsure about your dataset’s distribution, instance-based classifiers might be a good option, but first make sure that you know their limitations. These classifiers are not well-suited for
· Noisy data (data with unexplainable random variation)
· Datasets with unimportant or irrelevant features
· Datasets with missing values
To keep this chapter as simple as possible, I stick to explaining the k-nearest neighbor classification algorithm (known affectionately as kNN). The concepts involved in kNN are a bit tricky, though, so first I introduce you to the simpler average nearest neighbor methods before into the kNN approach.
Recognizing the Difference between Clustering and Classification
The purpose of both clustering and classification algorithms is to make sense of, and extract value from, large sets of structured and unstructured data. If you’re working with huge volumes of unstructured data, it only makes sense to try to partition the data into some sort of logical groupings before attempting to analyze it. Both clustering and classification methods allow you to take a sweeping glance of your data en masse and then form some logical structures based on what you find there, before going deeper into the nuts-and-bolts analysis.
Reintroducing clustering concepts
In their simplest form, clusters are sets of unlabeled data points that share similar attribute values, and clustering algorithms are the methods that group these data points into different clusters based on their similarities. You’ll see clustering algorithms used for disease classification in medical science, but you’ll also see them used for customer classification in marketing research and for environmental health risk assessment in environmental engineering.
Getting to know classification algorithms
You might have heard of classification and thought that it’s the same concept as clustering. Many people do, but this is not the case. In classification, your data is labeled, so before you analyze it, you already know the number of classes into which it should be grouped. You also already know what class you want assigned to each data point. In contrast, with clustering methods, your data is unlabeled, so you have no predefined concept of how many clusters are appropriate. You must rely on the clustering algorithms to sort and cluster the data in the most appropriate way.
With classification algorithms, you use what you know about an existing labeled dataset to generate a predictive model for classifying future observations. If your goal is to use your dataset and its known subsets to build a model for predicting the categorization of future observations, you’ll want to use classification algorithms. When implementing supervised classification, you already know your dataset’s labels — these labels are used to subset observations into classes. Classification helps you see how well your data fits into the dataset’s predefined classes so that you can then build a predictive model for classifying future observations.
Figure 7-1 illustrates how it looks to classify the World Bank’s Income and Education datasets according to the Continent feature.
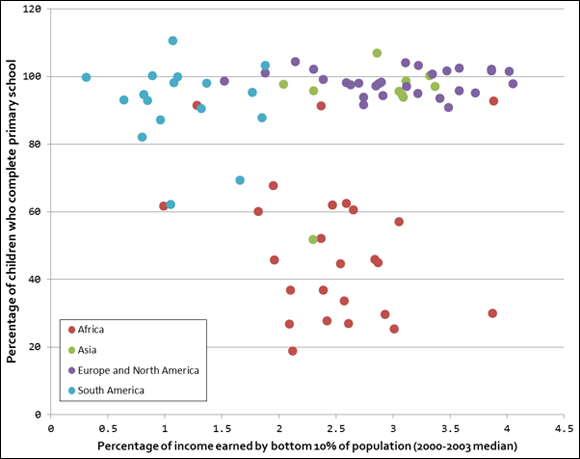
FIGURE 7-1: A classification of World Bank data, according to the Continent category.
In Figure 7-1, you can see that, in some cases, the subsets you might identify with a clustering technique do correspond to the Continents category, but in other cases, they don’t. For example, look at the lone Asian country in the middle of the African observations. That’s Bhutan. You could use the data in this dataset to build a model that would predict a continent class for incoming observations. But if you introduced a data point for a new country that showed statistics similar to those of Bhutan, the new country could be categorized as being part of either the Asian continent or the African continent, depending on how you define your model.
Now imagine a situation in which your original data doesn’t include Bhutan and you use the model to predict Bhutan’s continent as a new data point. In this scenario, the model would incorrectly predict that Bhutan is part of the African continent. This is an example of model overfitting — a situation in which a model is so tightly fit to its underlying dataset, as well as its noise or random error, that the model performs poorly as a predictor for new observations.
To avoid overfitting your models, divide your data into a training set and a test set. A typical ratio is to assign 70 percent of the data to the training set and the remaining 30 percent to the test set. Build your model with the training set, and then use the test set to evaluate the model by pretending that the test set observations are unknown. You can evaluate the accuracy of your model by comparing the classes assigned to the test set observations to the true classes of these observations.
Model overgeneralization can also be a problem. Overgeneralization is the opposite of overfitting: It happens when a data scientist tries to avoid misclassification due to overfitting by making a model extremely general. Models that are too general end up assigning every class a low degree of confidence. To illustrate model overgeneralization, consider again the World Bank Income and Education datasets. If the model used the presence of Bhutan to cast doubt on every new data point in its nearby vicinity, you end up with a wishy-washy model that treats all nearby points as African, but with a low probability. This model would be a poor predictive performer.
I can illustrate a good metaphor for overfitting and overgeneralization by using this well-known maxim: “If it walks like a duck and talks like a duck, then it’s a duck.” Overfitting would turn this statement into this: “It’s a duck if, and only if, it walks and quacks exactly in the ways that I have personally observed a duck to walk and quack. Since I’ve never observed the way an Australian spotted duck walks and quacks, an Australian spotted duck must not really be a duck at all.” In contrast, overgeneralization would say, “If it moves around on two legs and emits any high-pitched, nasal sound, it’s a duck. Therefore, Fran Fine, Fran Drescher’s character in the 1990s American sitcom The Nanny, must be a duck.”
 Be aware of the constant danger of overfitting and overgeneralization. Find a happy medium between the two.
When classifying data, keep these two points in mind:
· Model predictions are only as good as the model’s underlying data. In the World Bank data example, it could be the case that, if other factors such as life expectancy or energy use per capita were added to the model, its predictive strength might increase.
· Model predictions are only as good as the categorization of the underlying dataset. For example, what do you do with countries, like Russia, that span two continents? Do you distinguish North Africa from sub-Saharan Africa? Do you lump North America in with Europe because they tend to share similar features? Do you consider Central America to be part of North America or South America?
Making Sense of Data with Nearest Neighbor Analysis
At their core, nearest neighbor methods work by taking an observation’s attribute value and then locating another observation whose attribute value is numerically nearest to it. Because the nearest neighbor technique is a classification method, you can use it to perform tasks as scientifically oriented as deducing the molecular structure of a vital human protein or uncovering key biological evolutionary relationships or as business-driven as designing recommendation engines for e-commerce sites or building predictive models for consumer transactions. The applications are limitless.
A good analogy for the nearest neighbor concept is illustrated in GPS technology. Imagine that you’re in desperate need of a Starbucks iced latte, but you have no idea where the nearest store is located. What to do? One easy solution is simply to ask your smartphone where the nearest one is located.
When you do that, the system looks for businesses named Starbucks within a reasonable proximity of your current location. After generating a results listing, the system reports back to you with the address of the Starbucks coffeehouse closest to your current location — the one that is your nearest neighbor, in other words.
As the term nearest neighbor implies, the primary purpose of a nearest neighbor analysis is to examine your dataset and find the observation that’s quantitatively most similar to your observation. Note that similarity comparisons can be based on any quantitative attribute, whether that is distance, age, income, weight, or any other factor that can describe the observation you’re investigating. The simplest comparative attribute is distance.
In my Starbucks analogy, the x, y, z coordinates of the store reported to you by your smartphone are the most similar to the x, y, z coordinates of your current location. In other words, its location is closest in actual physical distance. The quantitative attribute being compared is distance, your current location is the observation, and the reported Starbucks coffeehouse is the most similar observation.
Modern nearest neighbor analyses are almost always performed using computational algorithms. The nearest neighbor algorithm is known as a single-link algorithm — an algorithm that merges clusters if the clusters share between them at least one connective edge (a shared boundary line, in other words). In the following sections, you can learn the basics of the average nearest neighbor algorithm and the k-nearest neighbor algorithm.
Classifying Data with Average Nearest Neighbor Algorithms
Average nearest neighbor algorithms are basic yet powerful classification algorithms. They’re useful for finding and classifying observations that are most similar on average. Average nearest neighbor algorithms are used in pattern recognition, in chemical and biological structural analysis, and in spatial data modeling. They’re most often used in biology, chemistry, engineering, and geosciences.
In this section, you can find out how to use average nearest neighbor algorithms to compare multiple attributes between observations and, subsequently, identify which of your observations are most similar. You can also find out how to use average nearest neighbor algorithms to identify significant patterns in your dataset.
The purpose of using an average nearest neighbor algorithm is to classify observations based on the average of the arithmetic distances between them. If your goal is to identify and group observations by average similarity, the average nearest neighbor algorithm is a great way to do that.
With respect to nearest neighbor classifiers, a dataset is composed of observations, each which has an x- and y-variable. An x-variable represents the input value, or feature, and the y-variable represents the data label, or target variable. To keep all these terms straight, consider the following example.
Suppose that your friendly neighborhood business analyst, Business Analyst Stu, is using average nearest neighbor algorithms to perform a classification analysis of datasets in his organization’s database. He’s comparing employees based on the following four features:
· Age
· Number of children
· Annual income
· Seniority
In his dataset, however (shown in Table 7-1), each employee in Stu’s organization is represented by a 5-dimensional tuple — or a set of five features.
· Employee Mike: (34, 1, 120000, 9, 0)
· Employee Liz: (42, 0, 90000, 5, 0)
· Employee Jin: (22, 0, 60000, 2, 0)
· Employee Mary: (53, 3, 180000, 30, 1)
Using the variables Age, Number of Children, Annual Income, and Seniority as predictive features, Business Analyst Stu calculates the average arithmetic differences between each of the employees. Figure 7-2 shows the calculated distances between each of the employees.
TABLE 7-1 Business Analyst Stu’s Employee Data
|
Employee Name |
Age |
Number of Children |
Annual Income |
Seniority |
Eligible to Retire |
|
Mike |
34 |
1 |
$120,000 |
9 |
0 |
|
Liz |
42 |
0 |
$90,000 |
5 |
0 |
|
Jin |
22 |
0 |
$60,000 |
2 |
0 |
|
Mary |
53 |
3 |
$180,000 |
30 |
1 |
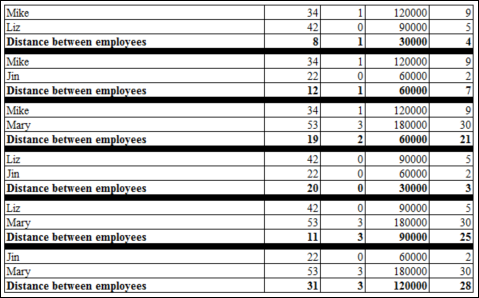
FIGURE 7-2: The distances between the employees’ tuples.
After Business Analyst Stu has this arithmetic measure of distance between the employees, he finds the average nearest neighbor by taking an average of these separation distances. Figure 7-3 shows that average similarity.
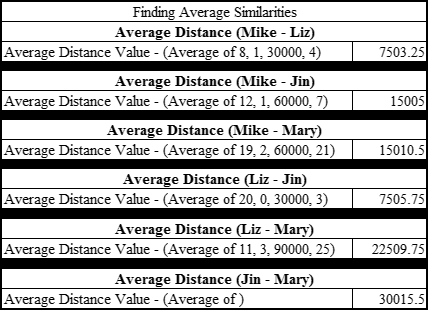
FIGURE 7-3: Finding the average similarity between employees.
Stu then groups the employees by the average separation distance between them. Because the average separation distance values between Mike, Liz, and Jin are the smallest, they’re grouped into class 0. Mary’s average separation distances are quite unlike the others, so she is put into her own class — class 1.
But does this make sense? Well, you’re working with a labeled dataset and you can see that the attribute Eligible to Retire assumes only one of two possible values. So, yes. If the algorithm predicts two classifications within the data, that’s a reasonable prediction. Furthermore, if Stu gets new incoming data points that are unlabeled with respect to a person’s eligibility to retire, he could probably use this algorithm to predict for that eligibility, based on the other four features.
Classifying with K-Nearest Neighbor Algorithms
k-nearest neighbor is a supervised machine learning classifier that uses the observations it memorizes from within a test dataset to predict classifications for new, unlabeled observations. kNN makes its predictions based on similarity — the more similar the training observations are to the new, incoming observations, the more likely it is that the classifier will assign them both the same class. kNN works best if your dataset is
· Low on noise
· Free of outliers
· Labeled
· Composed only of relevant selected features
· Composed of distinguishable groups
 If you’re working with a large dataset, you may want to avoid using kNN, because it will probably take way too long to make predictions from larger datasets.
In the larger context of machine learning, kNN is known as a lazy machine learning algorithm — in other words, it has little to no training phase. It simply memorizes training data and then uses that information as the basis on which to classify new observations. The goal of the kNN is to estimate the class of the query point P based on the classes of its k-nearest neighbors. In this way, kNN works in ways quite similar to how the human brain works.
The kNN algorithm is a generalization of the nearest neighbor algorithm. Rather than consider the nearest neighbor, you consider k numbers of nearest neighbors from within a dataset that contains n number of data points — kdefines how many nearest neighbors will have an influence on the classification process. In kNN, the classifier classifies the query point P per the classification labels found in a majority of k-nearest points surrounding the query point.
kNN is a good classification method for you to use if you know little about the distribution of your dataset. What’s more, if you do have a solid idea about your dataset’s distribution and feature selection criteria — criteria for identifying and removing noise in the dataset — you can leverage this information to create significant enhancements in the algorithm’s performance.
kNN is among the simplest and most easy-to-implement classification methods, yet it yields competitive results when compared to some of the more sophisticated machine learning methods. Probably because of its simplicity and the competitive results it provides, the kNN algorithm has been ranked among the top ten most influential data mining algorithms by the academic research community.
Understanding how the k-nearest neighbor algorithm works
To use kNN, you simply need to pick a query point — usually called P — in the sample dataset and then compute the k-nearest neighbors to this point. The query point P is classified with a label that’s the same as the label of most k-nearest points that surround it. (Figure 7-4 gives a bird’s-eye view of the process.)
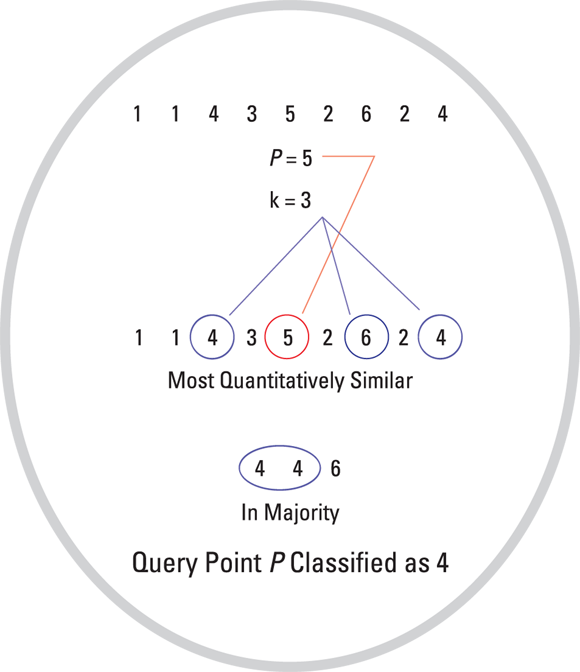
FIGURE 7-4: How kNN works.
K-nearest neighbors are quantified by either distance or similarity based on another quantitative attribute.
Consider the following example: A dataset is given by [1, 1, 4, 3, 5, 2, 6, 2, 4], and point P is equal to 5. Figure 7-4 shows how kNN would be applied to this dataset.
Now, if you were to specify that k is equal to 3, there are, based on distance, three nearest neighbors to the point 5. Those neighbors are 4, 4, and 6. So, based on the kNN algorithm, query point P will be classified as 4 because 4 is the majority number in the k number of points nearest to it. Similarly, kNN continues defining other query points using the same majority principle.
When using kNN, it’s crucial to choose a k value that minimizes noise — unexplainable random variation, in other words. At the same time, you must choose a k value that includes sufficient data points in the selection process. If the data points aren’t uniformly distributed, it’s generally harder to predetermine a good k value. Be careful to select an optimum k value for each dataset you’re analyzing.
 Large k values tend to produce less noise and more boundary smoothing — clearer definition and less overlap — between classes than small k values do.
Knowing when to use the k-nearest neighbor algorithm
kNN is particularly useful for multi-label learning — supervised learning where the algorithm is applied so that it automatically learns from (detects patterns in) multiple sets of instances. Each of these sets could potentially have several classes of their own. With multi-label learning, the algorithm learns to predict multiple class labels for each new instance it encounters.
The problem with kNN is that it takes a lot longer than other classification methods to classify a sample. Nearest neighbor classifier performance depends on calculating the distance function and on the value of the neighborhood parameter k. You can try to speed things up by specifying optimal values for k and n.
Exploring common applications of k-nearest neighbor algorithms
kNN is often used for internet database management purposes. In this capacity, kNN is useful for website categorization, web page ranking, and other user dynamics across the web.
kNN classification techniques are also quite beneficial in customer relationship management (CRM), a set of processes that ensure a business sustains improved relationships with its clients while simultaneously experiencing increased business revenues. Most CRMs get tremendous benefit from using kNN to data-mine customer information to find patterns that are useful in boosting customer retention.
The method is so versatile that even if you’re a small-business owner or a marketing department manager, you can easily use kNN to boost your own marketing return on investment. Simply use kNN to analyze your customer data for purchasing patterns, and then use those findings to customize marketing initiatives so that they’re more exactly targeted for your customer base.
Solving Real-World Problems with Nearest Neighbor Algorithms
Nearest neighbor methods are used extensively to understand and create value from patterns in retail business data. In the following sections, I present two powerful cases where kNN and average-NN algorithms are being used to simplify management and security in daily retail operations.
Seeing k-nearest neighbor algorithms in action
K-nearest neighbor techniques for pattern recognition are often used for theft prevention in the modern retail business. Of course, you’re accustomed to seeing CCTV cameras around almost every store you visit, but most people have no idea how the data gathered from these devices is being used.
You might imagine that someone in the back room, monitoring these cameras for suspicious activity, and perhaps that is how things were done in the past. But now a modern surveillance system is intelligent enough to analyze and interpret video data on its own, without the need for human assistance. The modern systems can now use k-nearest neighbor for visual pattern recognition to scan and detect hidden packages in the bottom bin of a shopping cart at checkout. If an object is detected that is an exact match for an object listed in the database, the price of the spotted product could even automatically be added to the customer’s bill. Though this automated billing practice is not used extensively now, the technology has been developed and is available for use.
K-nearest neighbor is also used in retail to detect patterns in credit card usage. Many new transaction-scrutinizing software applications use kNN algorithms to analyze register data and spot unusual patterns that indicate suspicious activity. For example, if register data indicates that a lot of customer information is being entered manually rather than through automated scanning and swiping, this could indicate that the employee who’s using that register is in fact stealing a customer’s personal information. Or, if register data indicates that a particular good is being returned or exchanged multiple times, this could indicate that employees are misusing the return policy or trying to make money from making fake returns.
Seeing average nearest neighbor algorithms in action
Average nearest neighbor algorithm classification and point pattern detection can be used in grocery retail to identify key patterns in customer purchasing behavior, and subsequently increase sales and customer satisfaction by anticipating customer behavior. Consider the following story:
As with other grocery stores, buyer behavior at (the fictional) Waldorf Food Co-op tends to follow fixed patterns. Managers have even commented on the odd fact that members of a particular age group tend to visit the store during the same particular time window, and they even tend to buy the same types of products. One day, Manager Mike got extremely proactive and decided to hire a data scientist to analyze his customer data and provide exact details about these odd trends he’d been noticing. When Data Scientist Dan got in there, he quickly uncovered a pattern among working middle-aged male adults — they tended to visit the grocery store only during the weekends or at the end of the day on weekdays, and if they came into the store on a Thursday, they almost always bought beer.
Armed with these facts, Manager Mike quickly used this information to maximize beer sales on Thursday evenings by offering discounts, bundles, and specials. Not only was the store owner happy with the increased revenues, but Waldorf Food Co-op’s male customers were also happy, because they got more of what they wanted, when they wanted it.
All materials on the site are licensed Creative Commons Attribution-Sharealike 3.0 Unported CC BY-SA 3.0 & GNU Free Documentation License (GFDL)
If you are the copyright holder of any material contained on our site and intend to remove it, please contact our site administrator for approval.
© 2016-2026 All site design rights belong to S.Y.A.