ElasticSearch Cookbook, Second Edition (2015)
Chapter 9. Cluster and Node Monitoring
In this chapter we will cover:
· Controlling cluster health via the API
· Controlling cluster state via the API
· Getting cluster node information via the API
· Getting node statistics via the API
· Managing repositories
· Executing a snapshot
· Restoring a snapshot
· Installing and using BigDesk
· Installing and using ElasticSearch Head
· Installing and using SemaText SPM
· Installing and using Marvel
Introduction
In the ElasticSearch ecosystem, it can be immensely useful to monitor nodes and clusters to manage and improve their performance and state. There are several issues that might arise at the cluster level, such as the following:
· Node overheads: Some nodes might have too many shards allocated and become bottlenecks for the entire cluster
· Node shutdown: This can happen due to many reasons—for example, full disks, hardware failures, and power problems
· Shard relocation: Problems or corruptions related to shard relocation, due to which some shards are unable to get an online status
· Very large shards: If a shard is too big, the index performance decreases due to the Lucene massive segments merging
· Empty indices and shards: They waste memory and resources but, because every shard has a lot of active thread, if there is a huge number of unused indices and shards, general cluster performance is degraded
Detecting malfunction or bad performances can be done via the API or via some front-end plugins that can be activated in ElasticSearch.
Some of the plugins introduced in this chapter allow readers to have a working web dashboard on their ElasticSearch data, monitor cluster health, back up/restore their data, and allow testing queries before implementing them in the code.
Controlling cluster health via the API
In the Understanding clusters, replication, and sharding recipe in Chapter 1, Getting Started, we discussed the ElasticSearch cluster and how to manage red and yellow states.
ElasticSearch provides a convenient way to manage cluster state, which is one of the first things to check in case of problems.
Getting ready
You need a working ElasticSearch cluster.
How to do it...
To control cluster health, we will perform the following steps:
1. To view cluster health, the HTTP method is GET and the curl command is:
curl -XGET 'http://localhost:9200/_cluster/health?pretty'
2. The result will be:
3. {
4. "cluster_name" : "elasticsearch",
5. "status" : "green",
6. "timed_out" : false,
7. "number_of_nodes" : 2,
8. "number_of_data_nodes" : 2,
9. "active_primary_shards" : 5,
10. "active_shards" : 10,
11. "relocating_shards" : 0,
12. "initializing_shards" : 0,
13. "unassigned_shards" : 0
}
How it works...
Every ElasticSearch node keeps the cluster status. The status can be of three types:
· green: This means everything is ok.
· yellow: This means that some nodes or shards are missing, but they don't compromise the cluster functionality. Mainly, some replicas are missing (a node is down or there aren't enough nodes for replicas), but there is at least one copy of each active shard. It also indicates that read and write functions are working.
· red: This indicates that some primary shards are missing. You cannot write to the indices whose status is red; results might either not be complete or only partial results might be returned. Generally, you need to restart the node that is down and possibly create some replicas.
Tip
The yellow/red state could be transient if some nodes are in recovery mode. In this case, just wait until recovery completes.
However, cluster health has a lot of more information:
· cluster_name: This is the name of the cluster.
· timeout: This is a Boolean value indicating whether the REST API hits the timeout set in the call.
· number_of_nodes: This indicates the number of nodes that are in the cluster.
· number_of_data_nodes: This shows the number of nodes that can store data. For different types of nodes, refer to the Setting up different node types recipe in Chapter 2, Downloading and Setting Up.
· active_primary_shards: This shows the number of active primary shards. The primary shards are the masters for writing operations.
· active_shards: This shows the number of active shards. These shards can be used for searching.
· relocating_shards: This shows the number of shards that are relocating—that is, migrating from one node to another. This is mainly due to cluster node balancing.
· initializing_shards: This shows the number of shards that are in the initializing state. The initializing process is done at shard startup. It's a transient state before becoming active and it's made up of several steps. The most important ones are as follows:
· Copy shard data, if it's a replica of another one
· Check Lucene indices
· Process transaction log as needed
· unassigned_shards: This shows the number of shards that are not assigned to a node mainly due to having set a replica number larger than the number of nodes. During startup, shards that are not initialized already or in the process of initializing will be counted here.
Installed plugins can play an important role in shard initialization. If you use a mapping type provided by a native plugin and you remove the plugin (or the plugin cannot be initialized due to API changes), the shard initialization will fail. These issues can easily be detected by reading the ElasticSearch log file.
Tip
While upgrading your cluster to a new ElasticSearch release, ensure that you upgrade your mapping plugins or that they can work with the new ElasticSearch release; otherwise your shards will fail to initialize, thus giving a red status to your cluster.
There's more…
This API call is very useful; it's possible to execute it against one or more indices to obtain their health in the cluster. This approach allows the isolation of indices with problems. The API call to execute this is as follows:
curl -XGET 'http://localhost:9200/_cluster/health/index1,index2,indexN'
The previous calls also have additional request parameters to control the health of the cluster. These parameters are as follows:
· level: This controls the level of the health information returned. This parameter accepts only cluster, index, and shards.
· timeout (by default, 30s): This is the waiting time of a wait_for_* parameter.
· wait_for_status: This waits for the server to provide the status (green, yellow, or red) until timeout.
· wait_for_relocating_shards (0 by default): This allows the server to wait to reach the provided number of relocating shards or the timeout period.
· wait_for_nodes: This waits until the defined number of nodes is available in the cluster. The value for this parameter can also be an expression such as >N, >=N, <N, <=N, ge(N), gt(N), le(N), or lt(N).
See also
· The Understanding clusters, replication, and sharding recipe in Chapter 1, Getting Started
· The Setting up different node types recipe in Chapter 2, Downloading and Setting Up
Controlling cluster state via the API
The previous recipe returns information only about the health of the cluster. If you need more details about your cluster, you need to query its state.
Getting ready
You need a working ElasticSearch cluster.
How to do it...
To check the cluster state, we will perform the steps given as follows:
1. To view the cluster state, the HTTP method is GET and the curl command is:
curl -XGET 'http://localhost:9200/_cluster/state'
2. The result will contain the following data sections:
· General cluster information:
· {
· "cluster_name" : "es-cookbook",
· "version" : 13,
· "master_node" : "R3Gwu0a6Q9GTHPQ6cg95ZA",
· "blocks" : { },
· Node address information:
· "nodes" : {
· "R3Gwu0a6Q9GTHPQ6cg95ZA" : {
· "name" : "Man-Ape",
· "transport_address" : "inet[/192.168.1.13:9300]",
· "attributes" : { }
· },
· "68PBx8g5TZKRxTMii9_EFw" : {
· "name" : "Azazel",
· "transport_address" : "inet[/192.168.1.13:9301]",
· "attributes" : { }
· }
},
· Cluster metadata information (templates, indices with mappings, and alias):
· "metadata" : {
· "templates" : { },
· "indices" : {
· "test-index" : {
· "state" : "open",
· "settings" : {
· "index" : {
· "number_of_shards" : "5",
· "number_of_replicas" : "1",
· "version" : {
· "created" : "1030199"
· },
· "uuid" : "psw_W6YXQNy60_KbfD10_Q"
· }
· },
· "mappings" : {…truncated…}
· },
· "aliases" : [ "my-cool-alias" ]
· }
· }
},
· Routing tables to find the shards:
· "routing_table" : {
· "indices" : {
· "test-index" : {
· "shards" : {
· "2" : [ {
· "state" : "STARTED",
· "primary" : true,
· "node" : "68PBx8g5TZKRxTMii9_EFw",
· "relocating_node" : null,
· "shard" : 2,
· "index" : "test-index"
· ….truncated…
· }
· }
· }
· }
},
· Routing nodes:
· "routing_nodes" : {
· "unassigned" : [ ],
· "nodes" : {
· "68PBx8g5TZKRxTMii9_EFw" : [ {
· "state" : "STARTED",
· "primary" : true,
· "node" : "68PBx8g5TZKRxTMii9_EFw",
· "relocating_node" : null,
· "shard" : 2,
· "index" : "test-index"
· …truncated… ]
· }
· },
· "allocations" : [ ]
}
How it works...
The cluster state contains information about the whole cluster; it's normal that its output is very large.
The call output contains common fields, as follows:
· cluster_name: This is the name of the cluster.
· master_node: This is the identifier of the master node. The master node is the primary node for cluster management.
The call output also contains several sections such as the following:
· blocks: This section shows the active blocks in a cluster.
· nodes: This shows the list of nodes in the cluster. For every node we have the following:
· id: This is the hash used to identify the node in ElasticSearch (for example, pyGyXwh1ScqmnDw5etNS0w)
· name: This is the name of the node
· transport_address: This is the IP address and the port number used to connect to this node
· attributes: These are additional node attributes
· metadata: This is the definition of the indices; they relate to the mappings.
· routing_table: These are the index/shard routing tables that are used to select the primary and secondary shards as well as their nodes.
· routing_nodes: This is the routing for the nodes.
The metadata section is the most used one because it contains all the information related to the indices and their mappings. This is a convenient way to gather all the indices mappings in one go; otherwise you need to call the get mapping for every type.
The metadata section is composed of several sections that are as follows:
· templates: These are templates that control the dynamic mapping for created indices
· indices: These are the indices that exist in the cluster
The indices subsection returns a full representation of all the metadata descriptions for every index. It contains the following:
· state (open/closed): This returns whether an index is open (that is, it can be searched and it can index data) or closed. See the Opening/closing an index recipe in Chapter 4, Basic Operations).
· settings: These are the index settings. They include the following:
· index.number_of_replicas: This indicates the number of replicas of an index; it can be changed with an update index settings call
· index.number_of_shards: This indicates the number of shards in an index; this value cannot be changed in an index
· index.version.created: This denotes the index version
· mappings: These are defined in the index. This section is similar to getting a mapping response. See the Getting a mapping recipe in Chapter 4, Basic Operations.
· alias: This is a list of index aliases that allow you to aggregate indices with a single name or to define alternative names for an index.
The routing records for indices and shards have similar fields. They are as follows:
· state (UNASSIGNED, INITIALITING, STARTED, RELOCATING): This shows the state of the shard or an index
· primary (true/false): This shows whether the shard or node is primary
· node: This shows the ID of the node
· relocating_node: This field, if validated, shows the node ID in which the shard is relocated
· shard: This shows the number of the shard
· index: This shows the name of the index in which the shard is contained
There's more...
The cluster state call returns a lot of information; it's possible to filter out the different section parts. The parameters are as follows:
· filter_blocks (true/false): This is used to filter out the blocks section of the response
· filter_nodes (true/false): This is used to filter out the node section of the response
· filter_metadata (true/false): This is used to filter out the metadata section of the response
· filter_routing_table (true/false): This is used to filter out the routing_table section of the response
· filter_indices: This is a list of index names to be include in the metadata
· filter_index_templates (true/false): This is used to filter out the templates section of the index metadata response
See also
· The Understanding clusters, replication, and sharding recipe in Chapter 1, Getting Started
· The Opening/closing an index recipe in Chapter 4, Basic Operations
· The Getting a mapping recipe in Chapter 4, Basic Operations
Getting cluster node information via the API
The earlier recipes allow us to return information to a cluster level; ElasticSearch provides calls to gather information at a node level.
Getting ready
You need a working ElasticSearch cluster.
How to do it...
To get information on nodes, we will perform the following steps:
1. To retrieve node information, the HTTP method is GET and the curl command is:
2. curl -XGET 'http://localhost:9200/_nodes?all=true'
3. curl -XGET 'http://localhost:9200/_nodes/<nodeId1>,<nodeId2>?all=true'
4. The result will be as follows:
5. {
6. "cluster_name" : "es-cookbook",
7. "nodes" : {
8. "R3Gwu0a6Q9GTHPQ6cg95ZA" : {
9. "name" : "Man-Ape",
10. "transport_address" : "inet[/192.168.1.13:9300]",
11. "host" : "Albertos-MacBook-Pro-2.local",
12. "ip" : "192.168.1.13",
13. "version" : "1.3.1",
14. "build" : "2de6dc5",
15. "thrift_address" : "/192.168.1.13:9500",
16. "http_address" : "inet[/192.168.1.13:9200]",
17. "settings" : {
18. "name" : "Man-Ape",
19. "path" : {…truncated… },
20. "foreground" : "yes"
21. },
22. "os" : {
23. "refresh_interval_in_millis" : 1000,
24. "available_processors" : 8,
25. "cpu" : {
26. "vendor" : "Intel",
27. "model" : "MacBookPro10,1",
28. "mhz" : 2700,
29. "total_cores" : 8,
30. "total_sockets" : 8,
31. "cores_per_socket" : 16,
32. "cache_size_in_bytes" : 256
33. },
34. "mem" : {
35. "total_in_bytes" : 17179869184
36. },
37. "swap" : {
38. "total_in_bytes" : 6442450944
39. }
40. },
41. "process" : {
42. "refresh_interval_in_millis" : 1000,
43. "id" : 71849,
44. "max_file_descriptors" : 10240,
45. "mlockall" : false
46. },
47. "jvm" : {
48. "pid" : 71849,
49. "version" : "1.8.0_05",
50. "vm_name" : "Java HotSpot(TM) 64-Bit Server VM",
51. "vm_version" : "25.5-b02",
52. "vm_vendor" : "Oracle Corporation",
53. "start_time_in_millis" : 1406963548972,
54. "mem" : {
55. "heap_init_in_bytes" : 268435456,
56. "heap_max_in_bytes" : 1037959168,
57. "non_heap_init_in_bytes" : 2555904,
58. "non_heap_max_in_bytes" : 0,
59. "direct_max_in_bytes" : 1037959168
60. },
61. "gc_collectors" : [ "ParNew", "ConcurrentMarkSweep" ],
62. "memory_pools" : [ "Code Cache", "Metaspace", "Compressed Class Space", "Par Eden Space", "Par Survivor Space", "CMS Old Gen" ]
63. },
64. "thread_pool" : {
65. "percolate" : {
66. "type" : "fixed",
67. "min" : 8,
68. "max" : 8,
69. "queue_size" : "1k"
70. … truncated…
71. },
72. "network" : {
73. "refresh_interval_in_millis" : 5000,
74. "primary_interface" : {
75. "address" : "192.168.1.13",
76. "name" : "en0",
77. "mac_address" : "28:CF:E9:17:61:AB"
78. }
79. },
80. "transport" : {
81. "bound_address" : "inet[/0:0:0:0:0:0:0:0:9300]",
82. "publish_address" : "inet[/192.168.1.13:9300]"
83. },
84. "http" : {
85. "bound_address" : "inet[/0:0:0:0:0:0:0:0:9200]",
86. "publish_address" : "inet[/192.168.1.13:9200]",
87. "max_content_length_in_bytes" : 104857600
88. },
89. "plugins" : [ {
90. "name" : "lang-javascript",
91. "version" : "2.3.0",
92. "description" : "JavaScript plugin allowing to add javascript scripting support",
93. "jvm" : true,
94. "site" : false
95. }, … truncated… ]
96. }
97. }
}
How it works...
The node information call provides an overview of the node's configuration; it covers a lot of information. The most important sections are the following:
· hostname: This is the name of the host.
· http: This section gives information about HTTP configuration, such as the following:
· bound_address: This is the address bound by ElasticSearch.
· max_content_lenght (100 mb by default): This is the maximum size of any HTTP content that ElasticSearch receives. HTTP payloads bigger than this size are rejected.
Tip
The default 100 MB HTTP limit can be changed in the elasticsearch.yml configuration file. It can lead to malfunction due to big payloads (often in conjunction with the attachment mapper plugin), so it's important to keep the limit in mind while conducting bulk actions or working with an attachment.
· publish_address: This is the address used to publish the ElasticSearch node.
· http_address: This is the address exposed to use HTTP REST API. When creating HTTP clients, this section can be used to implement an auto-discovery functionality.
· jvm: This section contains information about the node JVM: version, vendor, name, pid, and memory (heap and non heap).
Tip
It's highly recommended that you run all the nodes on the same JVM version and type.
· Network: This section contains information about the network interfaces used by the node—such as address, MAC address, and name.
· Osos: This section provides operating system information about the node that is running ElasticSearch—for example, processor information, memory, and swap.
· plugins: This section provides a list of every plugin installed in the node; this information includes the following:
· name: This is the plugin name
· description: This is the plugin description
· version: This is the plugin version
Tip
All the nodes must have the same plugin version. A difference in the plugin version in a node leads to unexpected failures.
· jvm: This shows whether the plugin is a JAR type
· site: This shows whether the plugin is a site type
· process: This section contains information about the currently running ElasticSearch processes and includes the following:
· id: This is the ID of the process
· max_file_descriptors: This denotes the max file descriptor number
· settings: This section contains information about the current cluster and the path of the ElasticSearch node. The most important fields are the following:
· cluster_name: This is the name of the cluster
· name: This is the name of the node
· path.*: This is the configured path of an ElasticSearch instance
· thread_pool: This section contains information about the several types of thread pools running in a node.
· thrift_address: This is the address of the Thrift protocol (it is available only if the Thrift plugin is installed).
· transport: This section contains information about the transport protocol, used for intracluster communication or by the native client to communicate with a cluster. The response format is similar to the HTTP type; it consists of the following:
· bound_address: If a specific IP is not set, then it is set in the configuration file
· publish_address: This is the address used to publish the native transport protocol
· transport_address: This is the address of the transport protocol.
· version: This is the current ElasticSearch version.
There's more…
The API call allows for the filtering of the section that must be returned. In our example, we have set the all=true parameters to return all the sections. Otherwise, we can select one or more of the following sections:
· http
· jvm
· network
· os
· process
· plugins
· settings
· thread_pool
· transport
For example, if you need only the os and plugins information, the call will be as follows:
curl -XGET 'http://localhost:9200/_nodes/os,plugins'
See also
· The Using the native protocol, Using the HTTP protocol, and Using the Thrift protocol recipes in Chapter 1, Getting Started
· The Setting up networking recipe in Chapter 2, Downloading and Setting Up
Getting node statistics via the API
The node statistics call API is used to collect real-time data of your node, such as memory usage, threads usage, the number of indexes, and searches.
Getting ready
You need a working ElasticSearch cluster.
How to do it...
To get nodes statistics, we will perform the following steps:
1. To retrieve the node statistics, the HTTP method is GET and the curl command is:
2. curl -XGET 'http://localhost:9200/_nodes/stats?all=true'
3. curl -XGET 'http://localhost:9200/_nodes/<nodeId1>,<nodeId2>/stats?all=true'
4. The result will be a long list of all the node statistics. The result is composed of the following:
· A header describing the cluster name and the nodes section:
· {
· "cluster_name" : "es-cookbook",
· "nodes" : {
· "R3Gwu0a6Q9GTHPQ6cg95ZA" : {
· "timestamp" : 1406986967655,
· "name" : "Man-Ape",
· "transport_address" : "inet[/192.168.1.13:9300]",
· "host" : "Albertos-MacBook-Pro-2.local",
"ip" : [ "inet[/192.168.1.13:9300]", "NONE" ],
· Statistics related to indices:
· "indices" : {
· "docs" : {
· "count" : 1000,
· "deleted" : 0
· },
· "store" : {
· "size_in_bytes" : 1075946,
· "throttle_time_in_millis" : 0
· },
· … truncated …
},
· Statistics related to the operating system:
· "os" : {
· "timestamp" : 1406986967732,
· "uptime_in_millis" : 521977,
· "load_average" : [ 1.86767578125, 2.47509765625, 2.654296875 ],
· "cpu" : {
· "sys" : 3,
· "user" : 6,
· "idle" : 90,
· "usage" : 9,
· "stolen" : 0
· } …truncated …
},
· Statistics related to the current ElasticSearch process:
· "process" : {
· "timestamp" : 1406986967734,
· "open_file_descriptors" : 335,
· "cpu" : {
· "percent" : 0,
· "sys_in_millis" : 39191,
· "user_in_millis" : 56729,
· "total_in_millis" : 95920
· },
· "mem" : {
· "resident_in_bytes" : 28397568,
· "share_in_bytes" : -1,
· "total_virtual_in_bytes" : 5241270272
· }
},
· Statistics related to the current JVM:
· "jvm" : {
· "timestamp" : 1406986967735,
· "uptime_in_millis" : 23418803,
· "mem" : {
· "heap_used_in_bytes" : 127469232,
· "heap_used_percent" : 12,
· "heap_committed_in_bytes" : 387448832,
· "heap_max_in_bytes" : 1037959168,
· "non_heap_used_in_bytes" : 71069104,
· "non_heap_committed_in_bytes" : 72007680,
· … truncated …
· }
· },… truncated …
},
· Statistics related to the thread pools:
· "thread_pool" : {
· "percolate" : {
· "threads" : 0,
· "queue" : 0,
· "active" : 0,
· "rejected" : 0,
· "largest" : 0,
· "completed" : 0
· },…truncated….
},
· Statistics related to networking:
· "network" : {
· "tcp" : {
· "active_opens" : 99763,
· "passive_opens" : 6171,
· "curr_estab" : 141,
· "in_segs" : 33811027,
· "out_segs" : 82198446,
· "retrans_segs" : 29297,
· "estab_resets" : 2588,
· "attempt_fails" : 12666,
· "in_errs" : 3083,
· "out_rsts" : -1
· }
},
· Node filesystem statistics:
· "fs" : {
· "timestamp" : 1406986967741,
· "total" : {
· "total_in_bytes" : 499418030080,
· "free_in_bytes" : 80559509504,
· "available_in_bytes" : 80297365504,
· "disk_reads" : 14903973,
· "disk_writes" : 6280386,
· "disk_io_op" : 21184359,
· "disk_read_size_in_bytes" : 334106572288,
· "disk_write_size_in_bytes" : 287922098688,
· "disk_io_size_in_bytes" : 622028670976
· } …truncated…]
},
· Statistics related to communications between nodes:
· "transport" : {
· "server_open" : 13,
· "rx_count" : 5742,
· "rx_size_in_bytes" : 934442,
· "tx_count" : 5743,
· "tx_size_in_bytes" : 1093207
},
· Statistics related to HTTP connections:
· "http" : {
· "current_open" : 1,
· "total_opened" : 1019
},
· Statistics related to field data caches:
· "fielddata_breaker" : {
· "maximum_size_in_bytes" : 622775500,
· "maximum_size" : "593.9mb",
· "estimated_size_in_bytes" : 0,
· "estimated_size" : "0b",
· "overhead" : 1.03,
· "tripped" : 0
· }
· }
· }
}
How it works...
Every ElasticSearch node, during execution, collects statistics about several aspects of node management. These statistics are accessible via the statistics API call.
In the following recipes, we will see some examples of monitoring applications that use this information to provide real-time statistics of a node or a cluster.
The main statistics collected by this API are as follows:
· fs: This section contains statistics about the filesystem, such as the free space on devices, mount points, reads, and writes.
· http: This gives the number of current open sockets and their maximum number.
· indices: This contains statistics of several indexing aspects such as:
· Usage of fields and caches
· Statistics about operations such as GET, indexing, flush, merges, refresh, and warmer
· jvm: This section provides statistics about buffer, pools, garbage collector (creation/destruction of objects and their memory management), memory (used memory, heap, pools), threads, and uptime.
· network: This section provides statistics about the TCP traffic, such as open connections, closed connections, and data I/O.
· os: This section collects statistics about the operating system such as:
· CPU usage
· Node load
· Memory and swap
· System uptime
· process: This section contains statistics of the CPU resource used by ElasticSearch, memory, and open file descriptors.
Tip
It's very important to monitor the open file descriptors because, if you run out of them, the indices can get corrupted.
· thread_pool: This section monitors all the thread pools available in ElasticSearch. It's important in the case of low performance, for example, to control whether there are pools that have an excessive overhead. Some of them can be configured to a new max limit value.
· transport: This section contains statistics about the transport layer, mainly about the bytes read and transmitted.
There's more…
The response is large, and it's possible to limit this by requesting only needed content. To do this, you need to pass a call query parameter to the API, specifying the following desired sections:
· fs
· http
· indices
· jvm
· network
· os
· thread_pool
· transport
For example, to only request os and http statistics, the call is:
curl -XGET 'http://localhost:9200/_nodes/stats?os,http'
See also
· The Using the native protocol, Using the HTTP protocol, and Using the Thrift protocol recipes in Chapter 1, Getting Started
· The Setting up networking recipe in Chapter 2, Downloading and Setting Up
Managing repositories
ElasticSearch provides a built-in system to quickly snapshot and restore your data. When working with live data, it's difficult to have a backup because of the large number of concurrency problems.
An ElasticSearch snapshot allows us to create snapshots of individual indices (or aliases), or an entire cluster, in a remote repository.
Before starting to execute a snapshot, a repository must be created.
Getting ready
You need a working ElasticSearch cluster.
How to do it...
To manage a repository, we will perform the following steps:
1. To create a repository called my_backup, the HTTP method is PUT and the curl command is:
2. curl -XPUT 'http://localhost:9200/_snapshot/my_backup' -d '{
3. "type": "fs",
4. "settings": {
5. "location": "/tmp/my_backup",
6. "compress": true
7. }
8. }'
The result will be:
{"acknowledged":true}
If you check on your filesystem, the directory /tmp/my_backup is created.
9. To retrieve the repository information, the HTTP method is GET and the curl command is:
10.curl -XGET 'http://localhost:9200/_snapshot/my_backup'
The result will be:
{
"my_backup" : {
"type" : "fs",
"settings" : {
"compress" : "true",
"location" : "/tmp/my_backup"
}
}
}
11. To delete a repository, the HTTP method is DELETE and the curl command is:
12.curl -XDELETE 'http://localhost:9200/_snapshot/my_backup'
The result will be:
{"acknowledged":true}
How it works...
Before you start snapshotting the data, you must create a repository. The parameters that can be used to create a repository are as follows:
· type (generally, fs): This is used to define the type of the shared filesystem repository
· settings: These are the options required to set up the shared filesystem repository
If you use the fs type, the settings are as follows:
· location: This is the location on the filesystem to store the snapshots.
· compress (by default, true): This turns on compression on snapshot files. Compression is applied only to metadata files (index mapping and settings); data files are not compressed.
· chunk_size (by default, disabled): This defines the chunk size of the files during snapshotting. The chunk size can be specified in bytes or by using the size value notation (for example 1 g, 10 m, 5 k).
· verify (by default, true): This flag enables verification of the repository on creation.
· max_restore_bytes_per_sec (by default, 20mb): This allows us to control the throttle per node restore rate.
· max_snapshot_bytes_per_sec (by default, 20mb): This allows us to control the throttle per node snapshot rate.
Tip
It is possible to return all the defined repositories by executing a GET method without giving the repository name:
curl -XGET 'http://localhost:9200/_snapshot'
There's more…
The most common type for a repository backend is the fs (filesystem) type, but there are other official repository backends such as the following:
· AWS Cloud (https://github.com/elasticsearch/elasticsearch-cloud-aws) for S3 repositories
· HDFS (https://github.com/elasticsearch/elasticsearch-hadoop/tree/master/repository-hdfs) for Hadoop environments
· Azure Cloud (https://github.com/elasticsearch/elasticsearch-cloud-azure) for Azure storage repositories
When a repository is created, it is immediately verified on all data nodes to be sure that it's functional.
ElasticSearch provides a manual way to verify the node status of the repository. It is useful to check the status of cloud repository storages. The command to manually verify a repository is as follows:
curl -XPOST 'http://localhost:9200/_snapshot/my_backup/_verify'
See also
· The official ElasticSearch documentation at: http://www.elasticsearch.org/guide/en/elasticsearch/reference/current/modules-snapshots.html
Executing a snapshot
In the previous recipe, we defined a repository. Now you can create snapshots of indices. For every repository, it's possible to define multiple snapshots.
Getting ready
You need a working ElasticSearch cluster and the repository created in the previous recipe.
How to do it...
To manage a snapshot, we will perform the following:
· To create a snapshot called snap_1 for the indices test and test1, the HTTP method is PUT and the curl command is:
· curl -XPUT "localhost:9200/_snapshot/my_backup/snap_1?wait_for_completion=true" -d '{
· "indices": " test-index,test-2",
· "ignore_unavailable": "true",
· "include_global_state": false
· }'
The result will be as follows:
{
"snapshot" : {
"snapshot" : "snap_1",
"indices" : [ "test-index" ],
"state" : "SUCCESS",
"start_time" : "2014-11-13T21:40:45.406Z",
"start_time_in_millis" : 1415914845406,
"end_time" : "2014-11-13T21:40:46.692Z",
"end_time_in_millis" : 1415914846692,
"duration_in_millis" : 1286,
"failures" : [ ],
"shards" : {
"total" : 5,
"failed" : 0,
"successful" : 5
}
}
}
If you check on your filesystem, the directory /tmp/my_backup is populated with some files /folders such as index (a directory that contains your data), metadata-snap_1, and snapshot-snap_1. The following are the commands to retrieve and delete a snapshot:
1. To retrieve information about a snapshot, the HTTP method is GET and the curl command is:
2. curl -XGET 'http://localhost:9200/_snapshot/my_backup/snap_1?pretty'
The result will be similar to creating a snapshot.
3. To delete a snapshot, the HTTP method is DELETE and the curl command is:
4. curl -XDELETE 'http://localhost:9200/_snapshot/my_backup/snap_1'
The result will be as follows:
{"acknowledged":true}
How it works...
The minimum configuration required to create a snapshot is the name of the repository and the name of the snapshot (for example, snap_1). If no other parameters are given, the snapshot command will dump all of the cluster data.
To control the snapshot process, some parameters are available:
· indices (a comma-delimited list of indices; wildcards are accepted): This controls the indices that must be dumped.
· ignore_unavailable (by default, false): This prevents the snapshot from failing if some indices are missing.
· include_global_state (by default, true; available values are true/false/partial): This allows us to store the global state in the snapshot. If a primary shard is not available, the snapshot will fail.
The query argument wait_for_completion, also used in the example, allows us to stop the snapshot from ending before returning the call. This is very useful if you want to automate your snapshot script to sequentially backup indices.
If the wait_for_completion is not set, then, in order to check the snapshot status, a user must monitor it via the snapshot GET call.
Snapshots are incremental, so only changed files are copied between two snapshots of the same index. This approach reduces both time and disk usage during snapshots.
ElasticSearch takes care of everything during a snapshot; this includes preventing data from being written on the files that are in the process of snapshotting and managing the cluster events (shard relocating, failures, and so on).
Tip
To retrieve all the available snapshots for a repository, the command is as follows:
curl -XGET 'http://localhost:9200/_snapshot/my_backup/_all'
There's more…
The snapshot process can be monitored via the _status end point that provides a complete overview of the snapshot status.
For the current example, the snapshot _status API call will be as follows:
curl -XGET "localhost:9200/_snapshot/my_backup/snap_1/_status?pretty"
The result is very long and composed of the following sections:
· Information about the snapshot:
· {
· "snapshots" : [ {
· "snapshot" : "snap_1",
· "repository" : "my_backup",
"state" : "SUCCESS",
· Global shard statistics:
· "shards_stats" : {
· "initializing" : 0,
· "started" : 0,
· "finalizing" : 0,
· "done" : 5,
· "failed" : 0,
· "total" : 5
},
· Snapshot global statistics:
· "stats" : {
· "number_of_files" : 125,
· "processed_files" : 125,
· "total_size_in_bytes" : 1497330,
· "processed_size_in_bytes" : 1497330,
· "start_time_in_millis" : 1415914845427,
· "time_in_millis" : 1254
},
· A drill-down of snapshot index statistics:
· "indices" : {
· "test-index" : {
· "shards_stats" : {
· "initializing" : 0,
· "started" : 0,
· "finalizing" : 0,
· "done" : 5,
· "failed" : 0,
· "total" : 5
· },
· "stats" : {
· "number_of_files" : 125,
· "processed_files" : 125,
· "total_size_in_bytes" : 1497330,
· "processed_size_in_bytes" : 1497330,
· "start_time_in_millis" : 1415914845427,
· "time_in_millis" : 1254
},
· Statistics per index per shard:
· "shards" : {
· "0" : {
· "stage" : "DONE",
· "stats" : {
· "number_of_files" : 25,
· "processed_files" : 25,
· "total_size_in_bytes" : 304773,
· "processed_size_in_bytes" : 304773,
· "start_time_in_millis" : 1415914845427,
· "time_in_millis" : 813
· }
},… truncated…
Restoring a snapshot
After you have taken snapshots of your data, they can be restored. The restoration process is often very fast; the indexed data is copied on the nodes and then activated.
Getting ready
You need a working ElasticSearch cluster and the snapshot created in the previous recipe.
How to do it...
To restore a snapshot, we will perform the following step:
· To restore a snapshot called snap_1 for the index test and test2, the HTTP method is PUT, and the curl command is:
· curl -XPOST "localhost:9200/_snapshot/my_backup/snap_1/_restore?pretty" -d '{
· "indices": "test-index,test-2",
· "ignore_unavailable": "true",
· "include_global_state": false,
· "rename_pattern": "test-(.+)",
· "rename_replacement": "copy_$1"
· }'
The result will be as follows:
{
"accepted" : true
}
The restoration is finished when the cluster state turns from red to yellow or green.
How it works...
The restoration process is very fast. It is internally composed of the following steps:
· The data is copied on the primary shard of the restored index. During this step the cluster is in the red state.
· The primary shards are recovered. During this step the cluster status turns from red to yellow/green.
· If a replica is set, the primary shards are copied into other nodes.
It's possible to control the restore process via parameters such as the following:
· indices (a comma-delimited list of indices; wildcards are accepted): This controls the indices that must be restored. If not defined, all indices in the snapshot are restored.
· ignore_unavailable (by default, false): This prevents the restore from failing if some indices are missing.
· include_global_state (by default, true; the available values are true/false): This allows us to restore the global state from the snapshot.
· rename_pattern and rename_replacement: The rename_pattern is a pattern that must be matched; the rename_replacement parameter uses the regular expression, replacement, to define a new index name.
· partial (by default, false). If it is set to true, it allows us to restore indices with missing shards.
Installing and using BigDesk
BigDesk is a wonderful web app developed by Lukáš Vlček, installable as an ElasticSearch plugin that allows us to monitor and analyze real-time cluster status.
With this application, it's possible to monitor both clusters and nodes in which ElasticSearch is running.
It's a modern HTML5 application and only requires a modern browser.
Getting ready
You need a working ElasticSearch cluster.
How to do it...
To install the BigDesk plugin, we will perform the following steps:
1. BigDesk plugin is a site plugin type, a plugin composed only of HTML, CSS, images, and JavaScript. It can be installed using the following command:
2. bin/plugin -install lukas-vlcek/bigdesk
3. Check in your config/elasticsearch.yml configuration file whether JSONP is active (by default it is disabled for security reasons):
http.jsonp.enable: true
4. After a node restart, if everything is alright it should appear in the site's list.
5. [INFO ][node] [Cassidy, Theresa] version[0.90.3], pid[37214], build[5c38d60/2013-08-06T13:18:31Z]
6. [INFO ][node] [Cassidy, Theresa] initializing ...
7. [INFO ][plugins] [Cassidy, Theresa] loaded [], sites [bigdesk]
8. [INFO ][node] [Cassidy, Theresa] initialized
[INFO ][node] [Cassidy, Theresa] starting …
9. Now look at the interface; you need to navigate to it with your browser by using the following URL:
http://es_address:9200/_plugin/bigdesk/
If you don't see the cluster statistics, put your node address on the left and click on connect.
How it works...
When the browser points to the plugin address, the web interface for BigDesk is loaded.
It's composed of three main blocks:
· The BigDesk Endpoint settings bar: This lets a user set the server address, the refresh time, the history size, and the connect/disconnect button
· The node or cluster view: This lets the user choose either monitoring nodes or the cluster data view
· The main view: This contains the data and graphics related to the node status
The node view is the main and the most important one, because it allows us to monitor all node aspects.
The following is the node view; as the page is very long, it has been split into three parts:
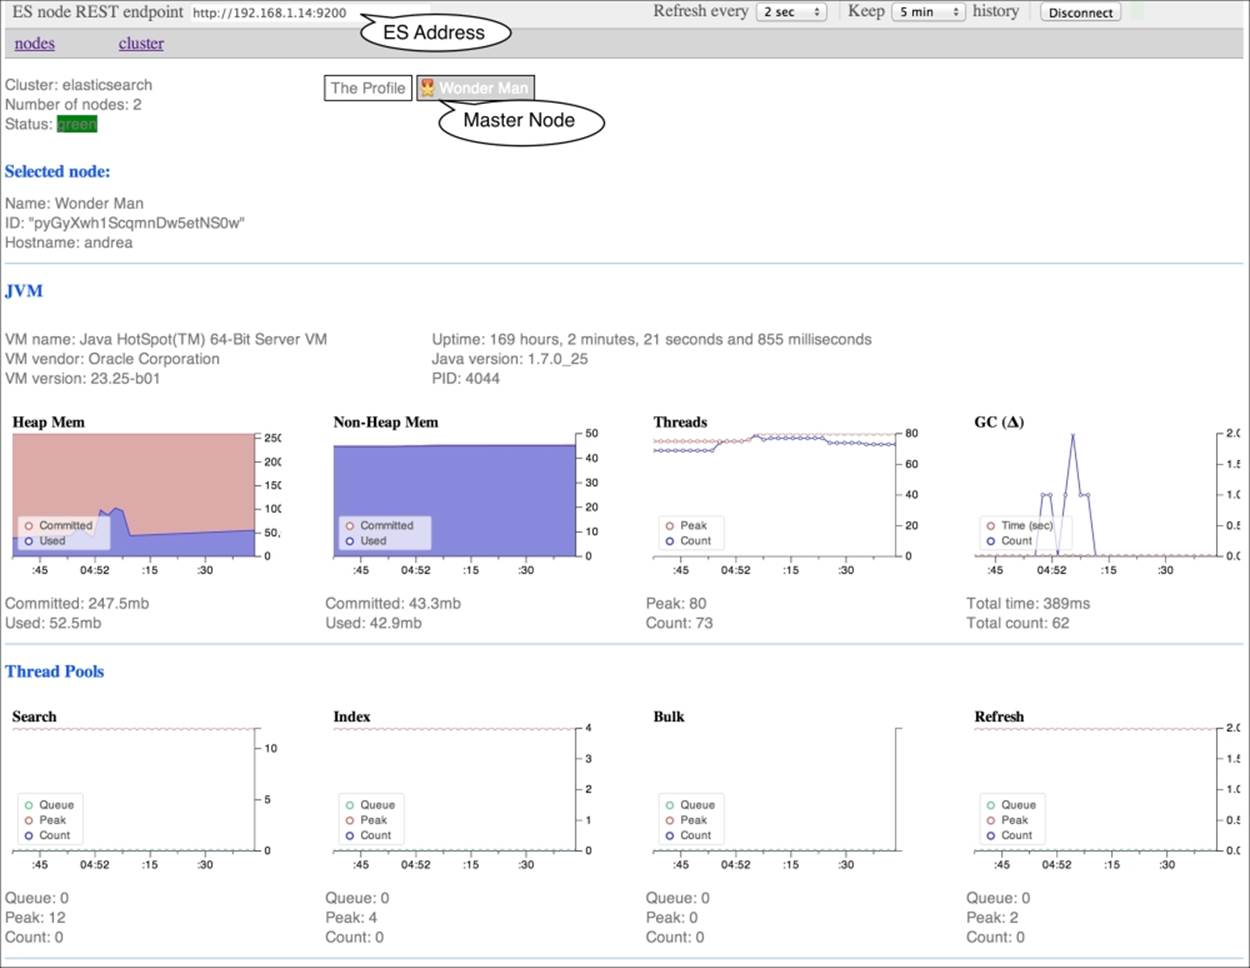
In this first part of the view, we can look at the following information:
· The names of nodes: The master node name is marked with a medal. Clicking on a node name switches the interface to monitor node statistics.
· JVM information, composed of:
· The information about the JVM itself: This gives you the JVM name, vendor, version, and uptime.
· The heap memory used: This must be monitored. If a JVM is out of heap memory, it is usually because of a core dump; it then shuts itself down because it is no longer able to allocate objects.
· Non-heap memory: This is other used memory, and not the actual heap memory.
· Threads: A JVM is not able to use a high number of threads. If the number of threads is too high, the application freezes or exists with some errors.
· Garbage collector: This allows monitoring of how often the objects are created and destructed, and the memory released.
· The thread pool section: This is where you can monitor the following objects:
· Search threads: These are the number of threads used in a search
· Index threads: These are the number of threads used in indexing
· Bulk threads: These are the number of threads used in bulk actions
· Refresh threads: These are the number of threads used to refresh the Lucene index; they allow us to update searches to work on new indexed data
The following screenshot shows you the fragmented information of a node:
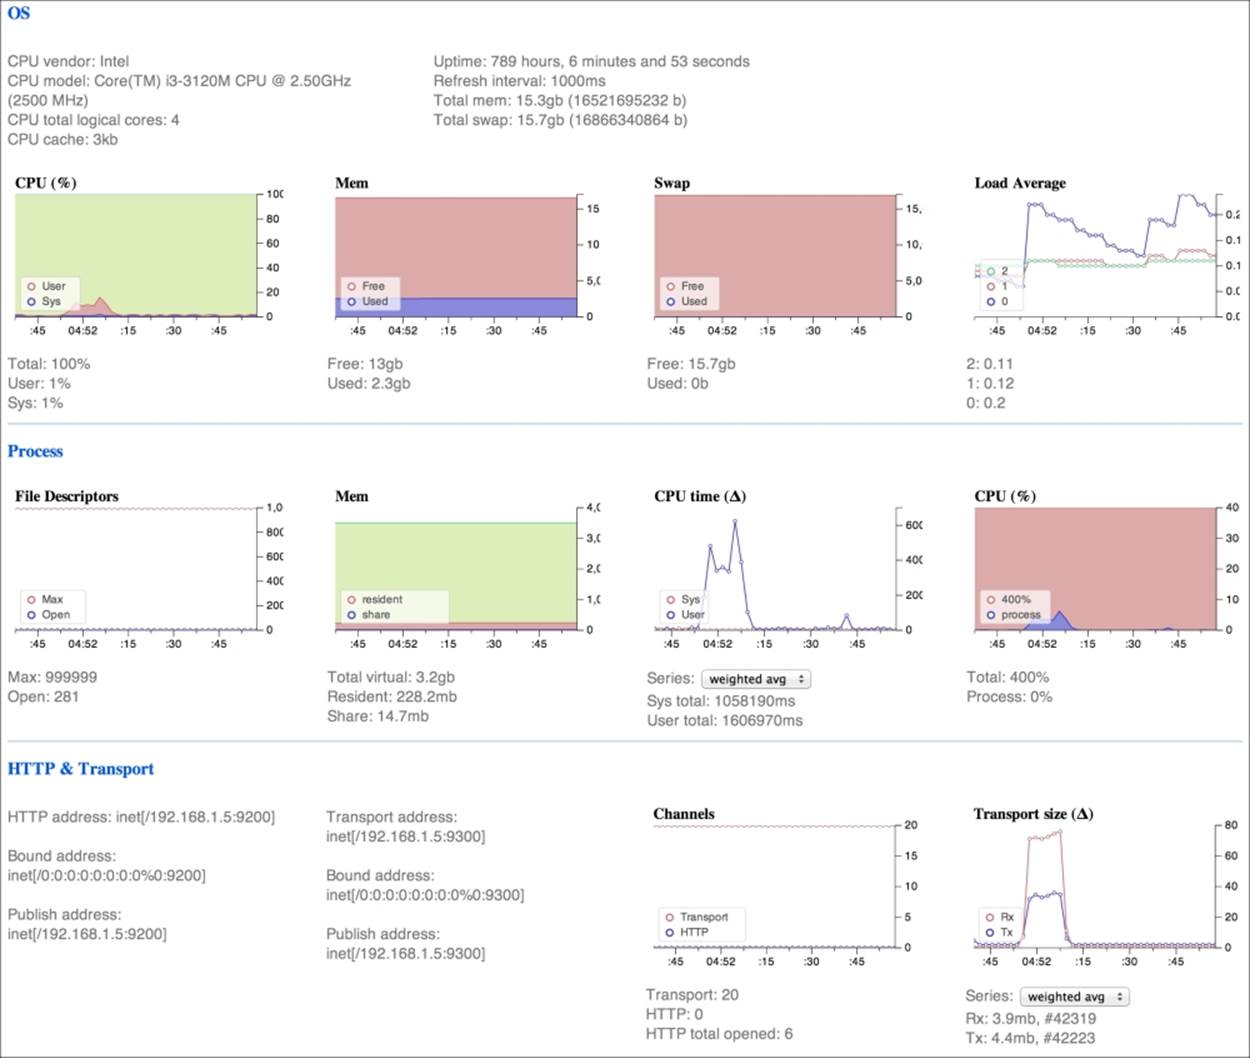
In the earlier screenshot, we see the following information:
· Operating system information:
· Type of CPU hardware, uptime, memory: These show you a detailed inspection on the CPU type, the system uptime, and the memory available.
· Real-time CPU usage: These show you the amount of CPU time utilized by a node in real time.
· Real-time memory usage: If your node uses all the memory, you need to increase the memory or add a new cluster node to balance the load.
· Real-time swap usage: If you are using swap memory, your server needs more of the main memory. Using swap memory can make the system unresponsive.
· Real-time load (average): This shows you the amount of load on the server. If all the values are near 1.0, your server is on high load. In such cases, try to put a new node in the cluster to reduce the work load.
· The process block has information about the ElasticSearch process, such as the following:
· File Description: These are the number of open files in the process. When ElasticSearch is out of files, Lucene indices might be corrupted and you might lose your data.
· Memory used by the ElasticSearch process.
· The CPUs resource used by the ElasticSearch process.
· The HTTP & Transport layer information block contains the following:
· IP and Port address: This gives information about the IP and port addresses of several protocols.
· Channels monitor: This allows you to control the number of HTTP connections. If the number of HTTP connections is too high because of a bad client configuration, the connections could then be dropped and your applications might have unexpected errors due to lack of connection.
· Transport size: This allows you to monitor the bytes received and sent by ElasticSearch.
The following screenshot shows you the third fragment view:
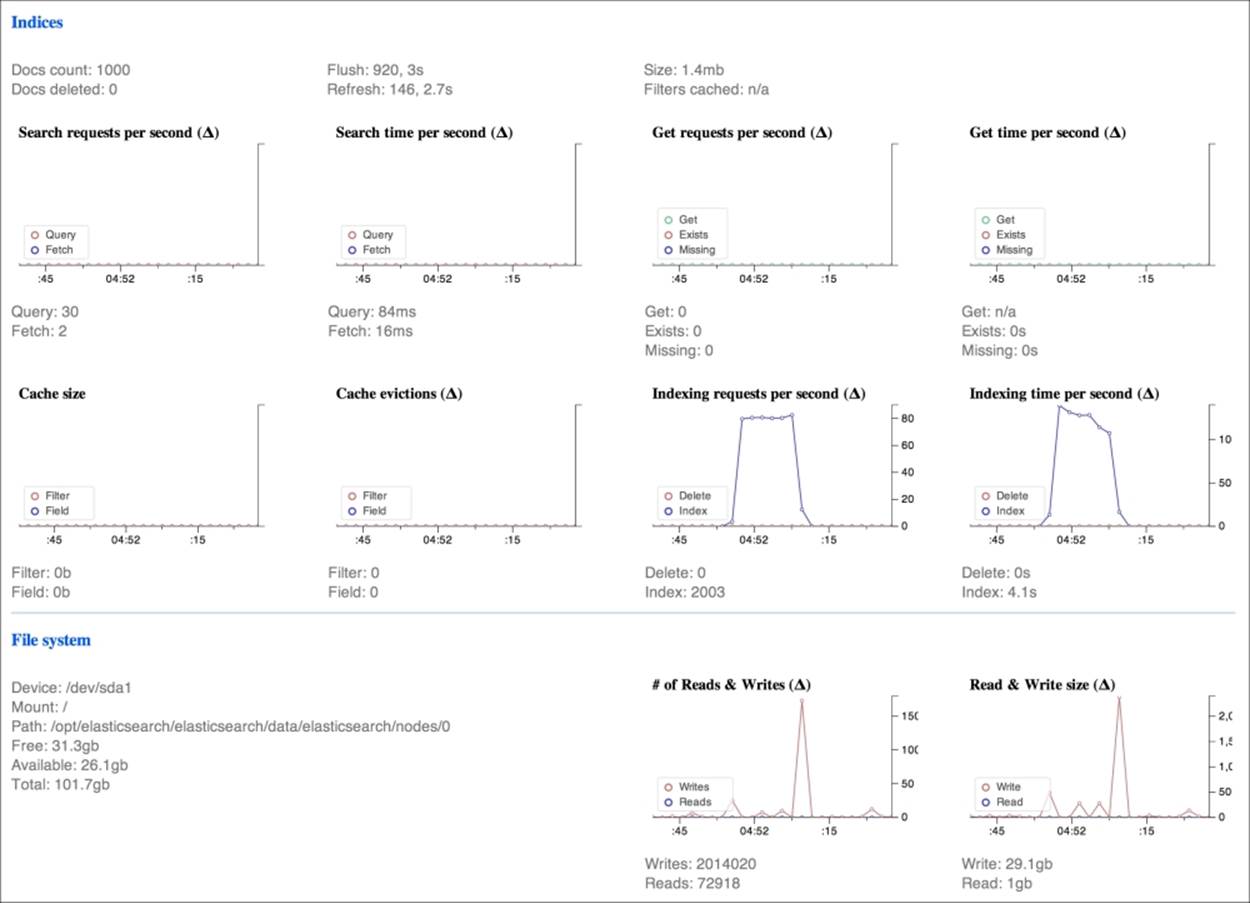
In the screenshot, there are two blocks related to the following:
· Index/search performances with details about the following:
· Present and deleted documents
· Flush and refresh of indices
· Search time per second
· GET time per second
· Cached filters
· Cache size and hits
· Index requests and indexing time in seconds
· Disk I/O in which the main parameters to consider are as follows:
· Free space on the disk.
· Read and write sizes. If these values hit the maximum disk I/O operation for many seconds, you need to add more nodes to balance the I/O load.
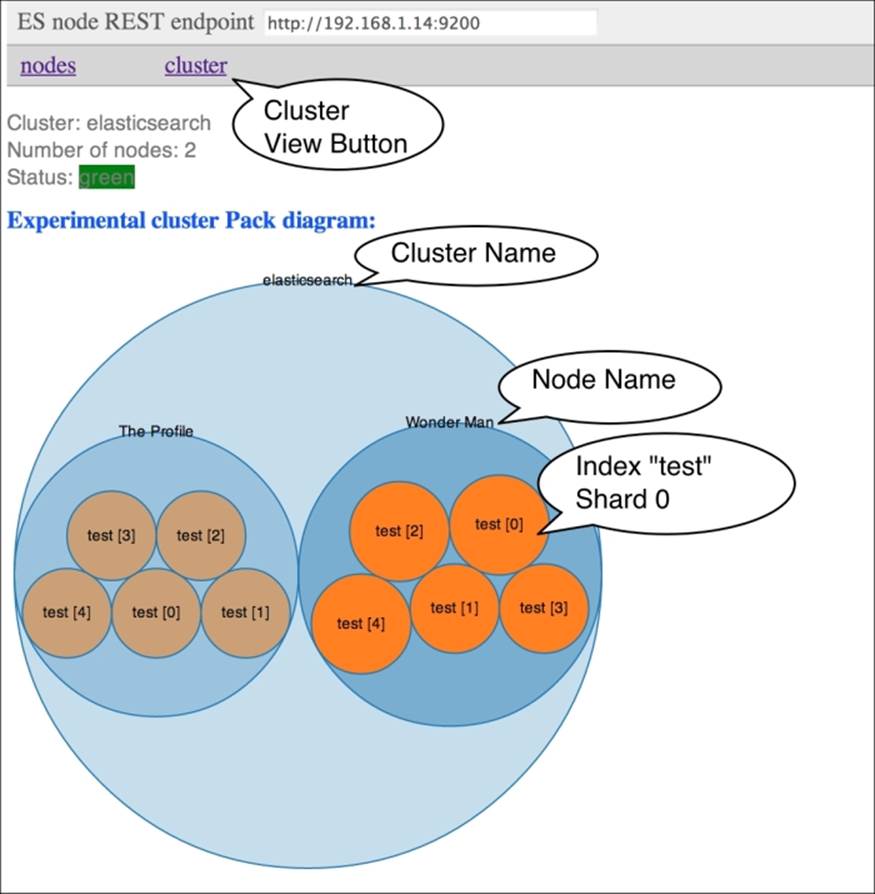
There's more…
BigDesk makes it possible to understand how your cluster is working and to monitor measures that might reduce the performance of your ElasticSearch cluster. BigDesk also provides a cluster view, experimental, that can help you to graphically understand which of the available shards is the largest and which ones use the most disk space.
Installing and using ElasticSearch Head
The previous plugin allows us to monitor all cluster/node statistics. ElasticSearch Head by Ben Birch mainly focuses on data management of your cluster. It allows you to manage your data and the shards of your cluster via a nice web interface; using it is way faster than using the curl command.
Getting ready
You need a working ElasticSearch cluster and a modern HTML5 browser.
How to do it...
To install the Head plugin, we will perform the following steps:
1. The ElasticSearch Head plugin is a type of site plugin; it is composed only of HTML, CSS, images, and JavaScript. It can be installed by using the following command:
2. bin/plugin -install mobz/elasticsearch-head
3. After a node restart, if everything goes well, it should appear in the sites list, as follows:
4. [INFO ][node] [Cassidy, Theresa] version[0.90.3], pid[37214], build[5c38d60/2013-08-08T12:28:31Z]
5. [INFO ][node] [Cassidy, Theresa] initializing ...
6. [INFO ][plugins] [Cassidy, Theresa] loaded [], sites [head]
7. [INFO ][node] [Cassidy, Theresa] initialized
[INFO ][node] [Cassidy, Theresa] starting …
8. Now, to use the web interface, you need to navigate with your browser to the following address:
http://es_address:9200/_plugin/head/
If you don't see the cluster statistics, put your node address to the left and click on the connect button.
How it works...
ElasticSearch Head has a multiple-tab interface. Every tab has a special purpose; some of them are as follows:
· Overview: This tab shows the topology of your cluster and allows you to perform indexing and node-level operations
· Indices: This tab allows you to analyze index statistics
· Browser: This tab allows you to navigate through your data by index, type, or a simple field match
· Structured Query: This tab allows you to build queries via a customizable query builder
· Any Request: This tab allows you to execute custom requests
The following screenshot shows an example of the tabbed ElasticSearch Head web interface:
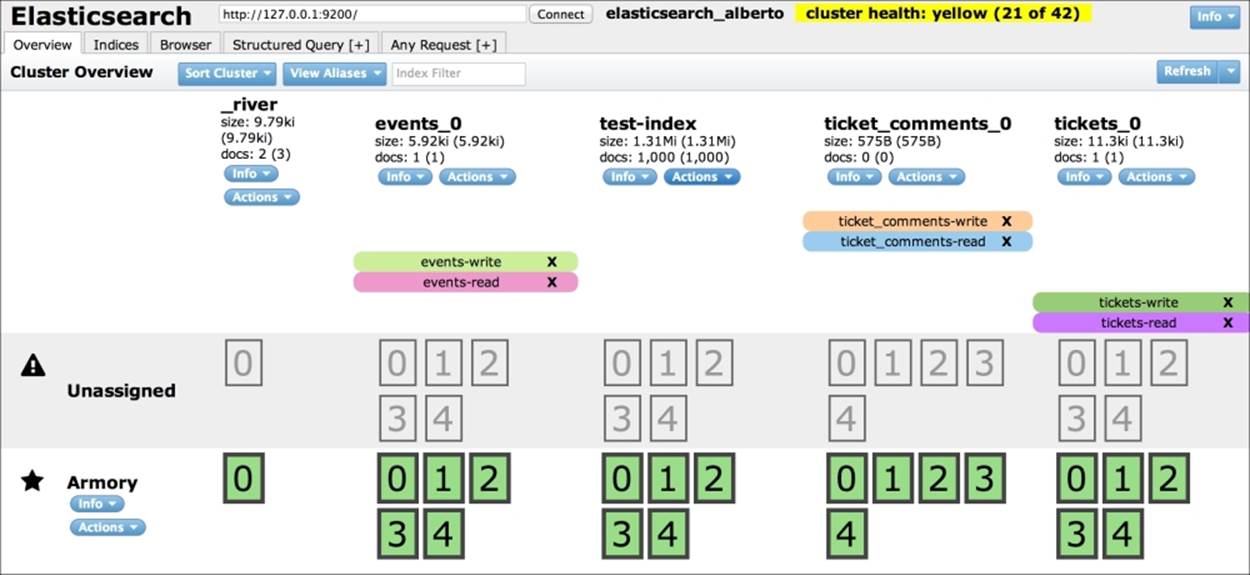
Outside the tabbed content, after connecting to a cluster, a lot of information and actions are available, such as the following:
· Cluster name and status (the information in the screenshot highlighted in yellow)
· Information about the cluster (the drop-down button on the left-hand side of the screenshot) allows you to view the following information:
· The ElasticSearch server version
· Status of indices
· Node statistics
· Cluster nodes
· Installed plugins
· Cluster status
· Cluster health
· Templates
The Overview tab allows you to execute a lot of cluster/node/index operations. It's a grid layout with nodes to the left and indices in columns. In the index columns, the shards distribution shows the location of the shards; you can know whether the shard is a primary or a secondary shard by clicking on it.
Under the node name, there are two buttons:
· Info: This button allows you to get information about the running node.
· Actions: This button allows you to execute commands on the node such as shutting it down.
The following details are under the index name:
· The index size gives you information about the size it occupies on the hard drive. The numbers in the parentheses give you its size, including replicas.
· This section gives you information about the number of documents that are in the index. In parentheses, it shows the exact number of records, including deleted records.
Note
Deleted documents are purged based on index merging policies or after an optimize command.
· The Info button collects status and metadata information.
· The Actions button collects several operations that can be executed on an index, which are listed as follows:
· New Alias: This adds an alias to the current index
· Refresh: This calls the refresh API
· Flush: This calls the flush API
· Gateway Snapshot: This allows you to dump index content on a gateway
· Test Analyzer: This allows you to view an analyzer-produced token
· Open/Close: This allows you to open or close an index
· Delete: This allows you to drop an index and delete all the mappings and their data
Under the Indices tab, the defined aliases are shown as follows.
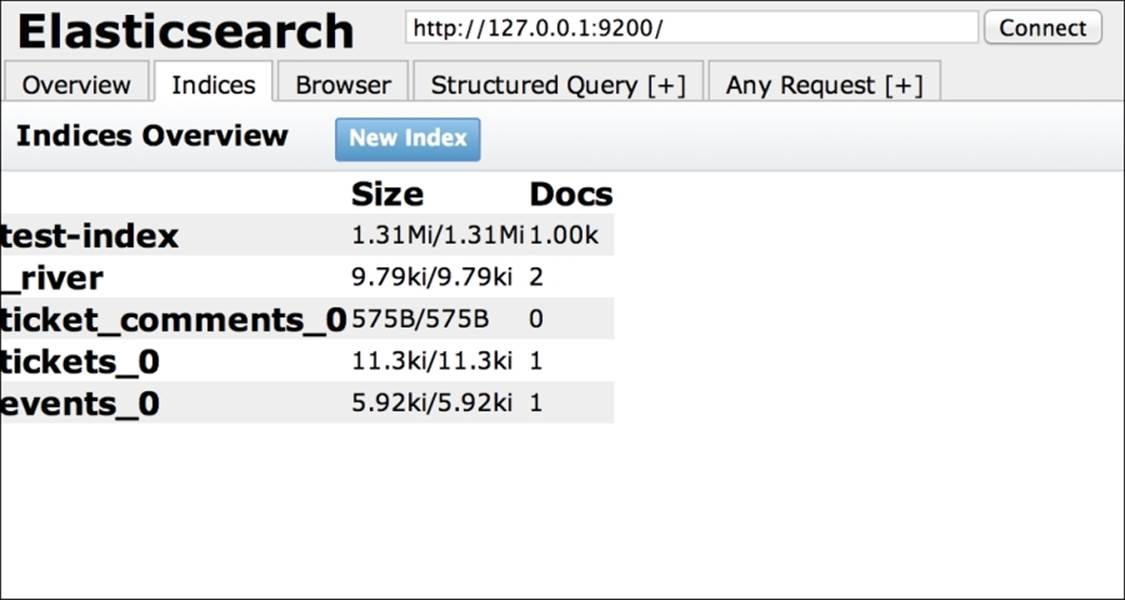
The Indices tab is very handy for having a quick look at the space occupied by the indices. From this view, you can detect empty indices or those that are too large.
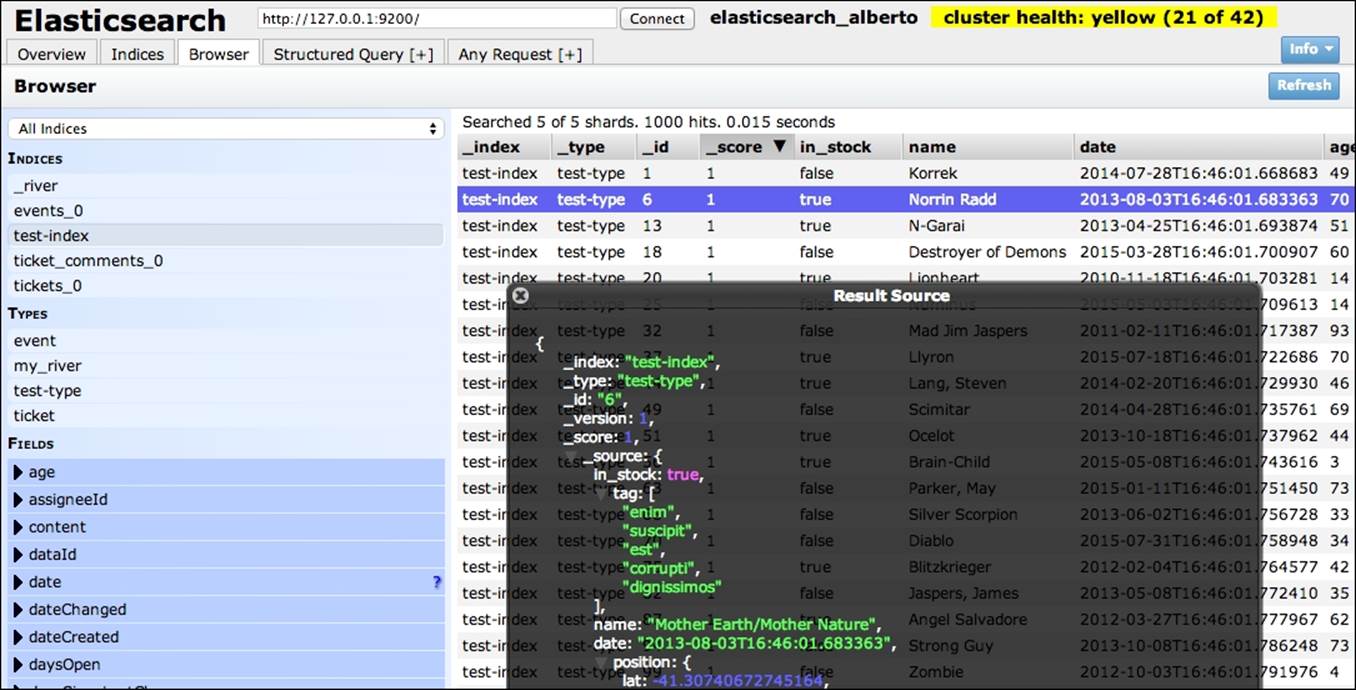
The Browser tab is useful for the analysis of data in your cluster. On the left-hand side, you can filter your choice by indices and types. If some data is indexed, you can also put values in the fields and the documents can use these values.
The results are represented in a table but, if you click on a result, you can see the original JSON record (if the source was stored at the time of indexing ). These views are very useful for analyzing the records available in your index and to check whether the record was correctly saved.
The following screenshot shows the Any Request[+] tab:
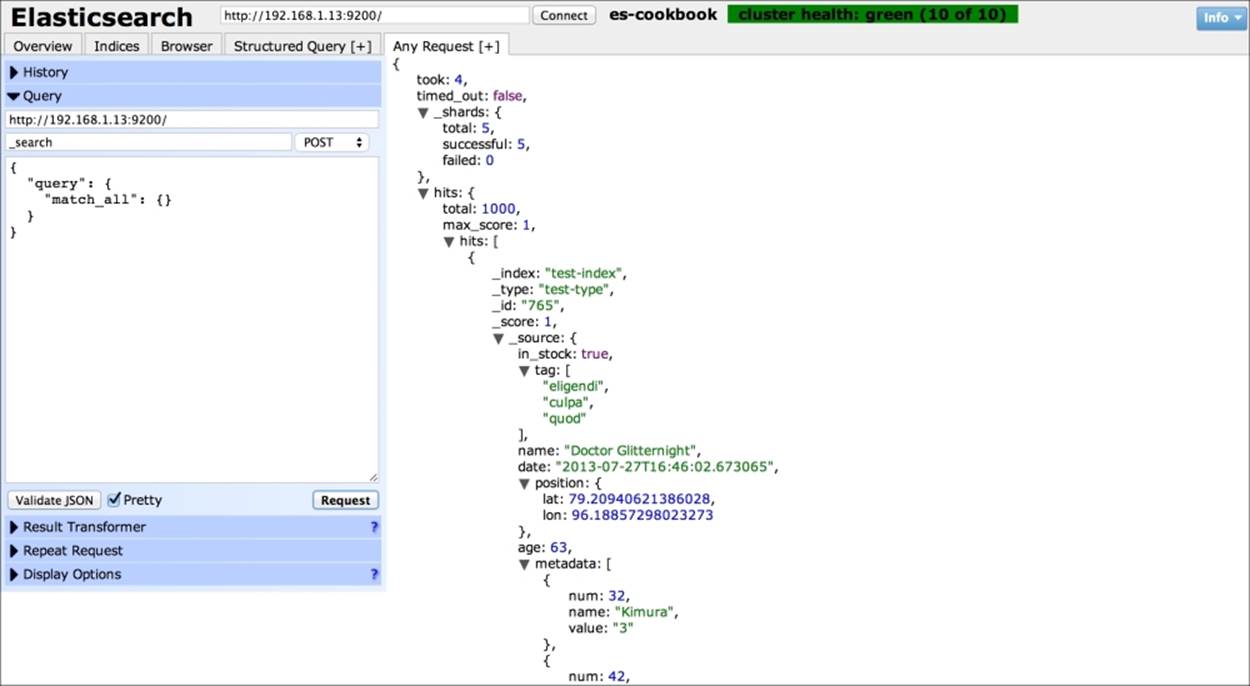
The Any Request[+] tab allows you to execute a custom query. On the left-hand side, the following options exist:
· The history of executed commands
· The query to be executed is composed of the following:
· URL
· Rest entry point
· REST method (GET, POST, PUT, DELETE)
· The body to be sent
· The Validate button, to check whether the body is a valid JSON code
· Pretty check to pretty-print the JSON code
· The Request button to execute the query
· Result Transform allows you to define the JavaScript code to postprocess the results
· Repeat Request allows you to execute the requests as per the scheduled time
· Display Options provide the following:
· Show Raw JSON (default): This is the JSON as returned by ElasticSearch
· Graph Results: These show a graph of results (the results must be in a list)
· Show Search Results Table: This shows the results similar to a table in a browser tab
There's more…
The Head plugin allows the monitoring of shard distribution and data manipulation via a simple web interface. Many actions can be taken via a web interface without the need to execute curl shell commands.
There are other good ElasticSearch GUIs, similar to Head, that are available mainly on GitHub. The most famous ones are the following:
· Elastic HQ (http://www.elastichq.org/): Elastic HQ gives you complete control over your ElasticSearch clusters, nodes, indexes, and mappings. This sleek, intuitive UI gives you all the power of the ElasticSearch Admin API, without having to tangle with REST and large cumbersome JSON requests and responses.
· Sense (https://chrome.google.com/webstore/detail/sense-beta/lhjgkmllcaadmopgmanpapmpjgmfcfig?hl=en): This is a Chrome plugin that allows only JSON manipulation and query execution, but it doesn't have monitoring capabilities.
· Marvel (http://www.elasticsearch.org/overview/marvel/): This will be discussed at the end of the chapter.
The choice of GUI tool depends on user preferences and requirements.
Installing and using SemaText SPM
The previous plugins allow real-time monitoring and analysis of your cluster status; if you need to monitor your cluster for a long time, you need tools that will collect your logs and perform analysis on them.
Sematext offers a paid service that allows remote collection and processing of your ElasticSearch activities.
Getting ready
You need a working ElasticSearch cluster and a modern HTML5 browser.
How to do it...
To install the SemaText SPM plugin, we will perform the following steps:
1. To use the SPM monitor, you need to register an account at the Sematext website (https://apps.sematext.com/users-web/register.do) for a trial period. For every account, an application key is generated; this key is required to download and install the client application.
2. The SPM monitor is composed of a client application, which must be installed on your server, and a web frontend managed by Sematext Cloud.
SemaText provides native installers for the following:
· Centos
· Amazon Linux
· RedHat
· Suse
· Debian
· Ubuntu
· Binaries for other Intel Linux 64
3. For common Linux distributions, the installation process is very simple; it is enough to add a binary repository and use the standard tool to install the application (yum install, rpm -i, apt-get install, and so on).
How it works...
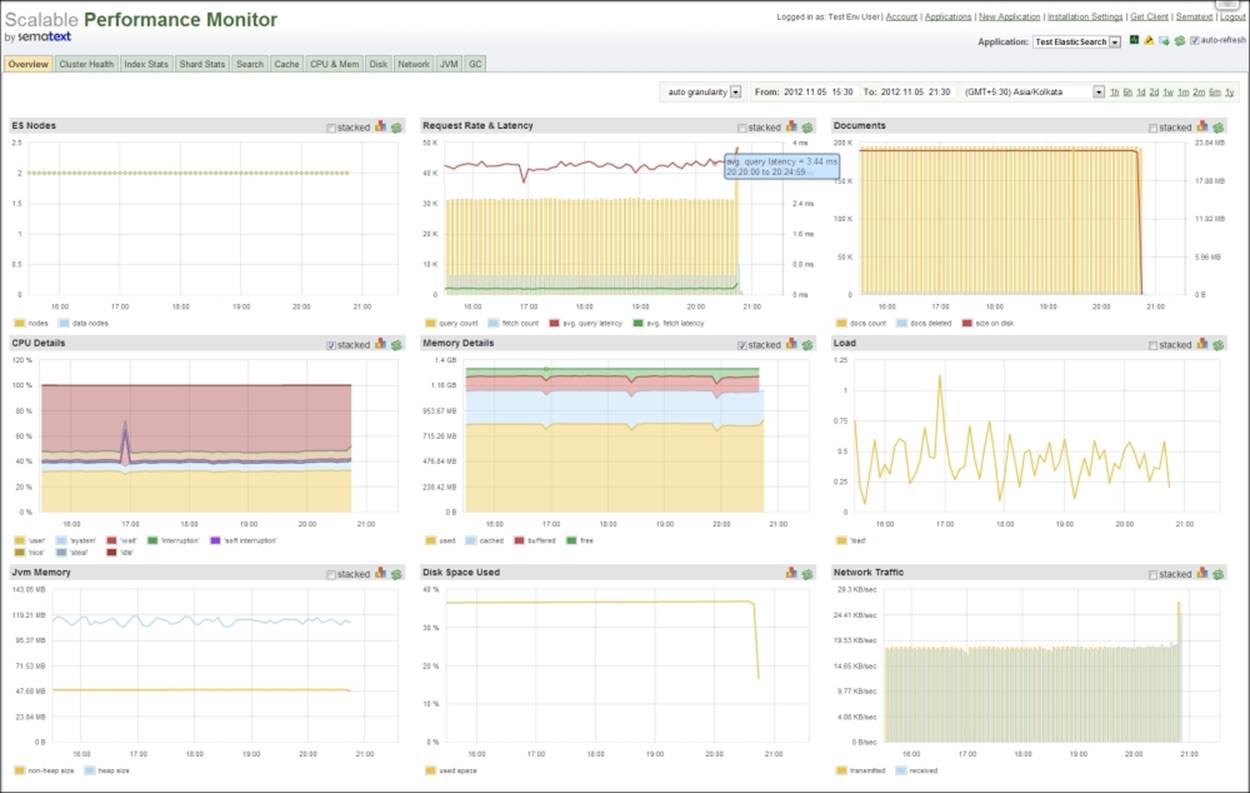
After having installed and started the client on the server, this application sends your node and cluster activities to the Sematext Cloud.
SemaText Cloud stores your activities to provide you with analysis over time depending on the support plan. It allows you to monitor and compare behaviors for up to a year.
The output is displayed in an interface similar to the following screenshot:
Tip
As SPM uses the node.name properties to identify the nodes, it is good practice to fix the node names in the elasticsearch.yml file to uniquely identify nodes in the logs.
The SPM from Sematext provides a practical and commercial solution to monitor ElasticSearch's performance during long usage, without requiring to set up any infrastructure to collect, store, and monitor data.
An alternative to this service is to set up a Nagios server (http://www.nagios.org/) and use the Nagios plugin for ElasticSearch (available at https://github.com/saj/nagios-plugin-elasticsearch).
See also
· For more details on SPM go to http://sematext.com/spm/elasticsearch-performance-monitoring/index.html
· The Nagios plugin is available at https://github.com/saj/nagios-plugin-elasticsearch
Installing and using Marvel
Similar to Sematext SPM, Marvel is a commercial product (freely available for development) built by ElasticSearch to monitor and manage an ElasticSearch cluster.
Getting ready
You need a working ElasticSearch cluster.
How to do it...
To install the Marvel plugin, we will perform the following steps:
1. The plugin is composed of a native component (JAR) and a site component (HTML, CSS, images, and JavaScript). It can be installed using the following command:
2. bin/plugin -i elasticsearch/marvel/latest
3. After a node restart, if everything goes well, it should appear in the sites list.
4. [INFO ][node ] [ESCookbookNode] version[1.3.1], pid[62763], build[2de6dc5/2014-07-28T14:45:15Z]
5. [INFO ][node ] [ESCookbookNode] initializing ...
6. [INFO ][plugins ] [ESCookbookNode] loaded [marvel], sites [marvel, bigdesk, head, HQ]
7. [INFO ][node ] [ESCookbookNode] initialized
8. [INFO ][node ] [ESCookbookNode] starting ...
9. [INFO ][transport ] [ESCookbookNode] bound_address {inet[/127.0.0.1:9300]}, publish_address {inet[/127.0.0.1:9300]}
[INFO ][discovery ] [ESCookbookNode] escookbook/TUYpmiFVTU6hY7DtjsmC3w
10. Now, to go to the interface, you need to navigate your browser to the following URL:
http://es_address:9200/_plugin/marvel/
Tip
The dark interface color can be changed to a lighter one in the Configure dashboard section (the wheel icon).
How it works...
Marvel is a commercial product developed by ElasticSearch. At the time of writing, the cost was $500 per year to monitor your first five nodes and $3,000 per year thereafter for each five-node cluster; however, it is free for development purposes.
Marvel is composed of two components:
· The native JAR is responsible for monitoring all cluster and node events, and for storing them in an index called marvel-<<YEAR>>.<<MONTH>>.<<DAY>> created for a particular day. Its purpose is to collect node and cluster data.
· The UI front-end, accessible at http://es_address:9200/_plugin/marvel/, is based on Kibana to show and analyze the data.
The Marvel plugin must be installed in every node of the cluster, so it can correctly collect the data.
The collecting part of the process stores the cluster and node data in the same ElasticSearch cluster, but it can be configured to use an external cluster for monitoring purposes.
Configurations for this part of the plugin are, as usual, in the elasticsearch.yml file. The most important properties are as follows:
· marvel.agent.exporter.es.hosts (by default, ["localhost:9200"]): This denotes a list of hosts in the hostname:port format to which the statistics and events will be sent.
· marvel.agent.enabled (by default, true): This can be set to false to disable all data export.
· marvel.agent.indices (by default, *): This allows us to control which indices to export data for. It is a comma-separated list of names that can also be wildcards. For example, +test* and -test1.
· marvel.agent.interval (by detault, 10s): This controls the interval between data samples. It is set to -1 to temporarily disable data export.
The insight part is in the frontend, based on Kibana (http://www.elasticsearch.org/overview/kibana/), that allows a powerful customization of the interface to provide advanced analysis.
The following screenshot shows the Marvel home page:
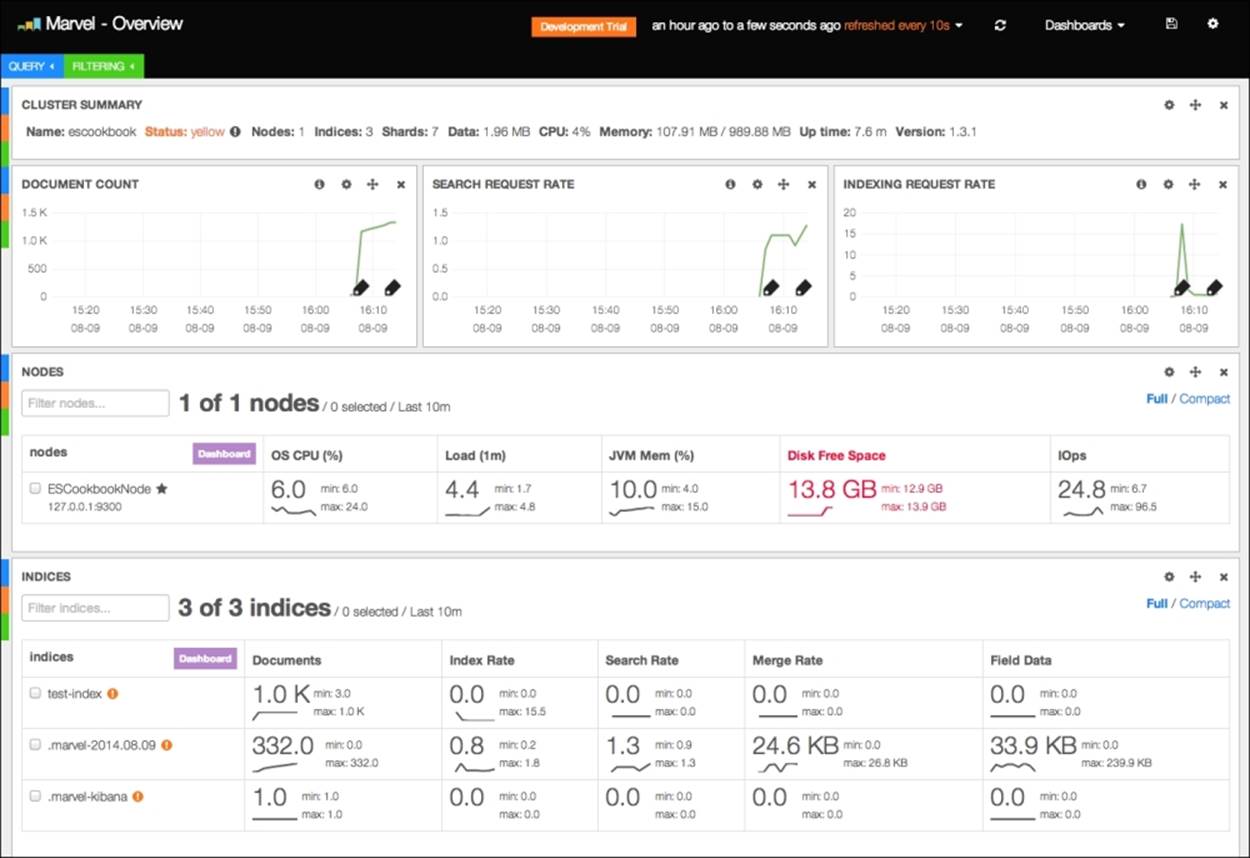
The home page gives an overview about the most important part of the cluster. The header provides settings for all the pages of the Marvel interface, listed as follows:
· The name of the Marvel cluster (in our example, Marvel – Overview) can be changed in the Configure dashboard section.
· Development Trial is shown because this Marvel version is running on trial mode.
· The interval that must be shown in the interface (such as, an hour ago to few minutes). Clicking on it results in the dashboard providing a common preset.
· The interface refresh interval (such as refreshed every 10s). When you click on it, the dashboard provides a common preset.
· The Force refresh icon.
· The Dashboards menu provides predefined dashboards such as the following:
· Cluster Pulse: This is very useful in the analysis of cluster events such as index creation, node connection/disconnections, and metadata changes.
· Shard Allocation: This tracks shard allocation events and allows you to replay them to analyze problems or evolution in time.
· Sense: This is an interface for the execution of queries (as explained earlier in the chapter).
· Node Statistics: This allows you to analyze all node statistics, such as memory usage, and file descriptors. It shows the data that we discussed in the Getting node statistics via the API recipe in this chapter.
· Index Statistics: This allows us to analyze all index statistics.
· The save icon allows you to save the changes to the current dashboard.
· The settings icon allows you to change dashboard settings.
The main dashboard page provides a global cluster overview. The interface is very simple to understand, and common issues are marked in red to gain the user's attention.
Marvel is probably the most complete and available solution for monitoring an ElasticSearch cluster that is easy to use and fully customizable. Explaining all the Kibana functionalities is outside the scope of this book.
See also
· To know more about Marvel's licensing and to get an overview, go to http://www.elasticsearch.com/marvel/
· Marvel documentation available at http://www.elasticsearch.org/guide/en/marvel/current/
· To learn more about Kibana, go to http://www.elasticsearch.org/overview/kibana/
All materials on the site are licensed Creative Commons Attribution-Sharealike 3.0 Unported CC BY-SA 3.0 & GNU Free Documentation License (GFDL)
If you are the copyright holder of any material contained on our site and intend to remove it, please contact our site administrator for approval.
© 2016-2026 All site design rights belong to S.Y.A.