Data Flow Diagramming by Example. Process Modeling Techniques for Requirements Elicitation (2015)
Detailed Process and Data Specifications

Questions answered in this chapter:
§ What business value do detailed process specifications offer?
§ How can I express detailed specifications for processes and data?
§ What is “metadata” and why do you need it?
Optional Process Mini-Specs
If we feel that a process on the detail diagram, e.g., the VERIFY CREDIT process, is still too vague and we need more detail, we could explode that process following the steps I just outlined. In data flow diagramming language, any process that you do not explode to a lower level of detail is called a ‘Functional Primitive’. Functional Primitives are not good candidates for further explosion because analyzing the data flows within them would reveal nothing of value.
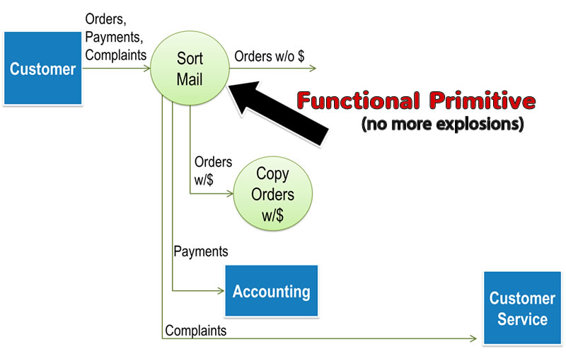
Nonetheless, you may need to describe what happens inside a Functional Primitive using a different tool to enable a thorough analysis or to inform the downstream developers what the process really does. A description of a Functional Primitive is called a ‘Mini-Spec’ or a ‘Process Specification’. You have a wide range of possible tools for documenting these Specifications.
You could use plain, simple English by writing a brief description of how we SORT MAIL. In our example, I could write:
The mail arrives between 8am and 10am Monday through Friday. The Mail Clerk opens each envelope and separates the contents into four stacks: Orders with Payments, Orders without Payments, Payments, and Complaints. Once that is complete, the Mail Clerk processes the stack of Orders with Payments.
For each order, he carefully separates the check from the order without damaging either, makes a copy of the order, staples the check to the copy, and adds the copy with check attached to the stack of Payments destined for ACCOUNTING. If the amount of payment exceeds 50% of the total price, he stamps the order “Credit OK” and puts it on a stack labeled Prepaid Orders; otherwise, he places the original order on the Orders without Payment stacks.
Once he has processed all Orders with Payment, the Mail Clerk distributes the stacks to the appropriate department:
o Original Orders stay in the Order Entry Department
o Payments and Copies of Orders with Payment got to Accounting
o Complaints go to Customer Service
If you and your target audience are comfortable with concepts such as Pseudo Code or Structured English, you could also write the specification thusly:
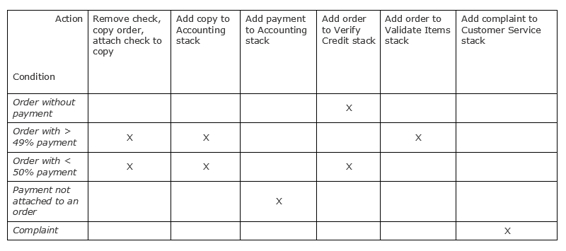
If the process is primarily a decision-making process and your target audience is comfortable with them, you can also use a decision table (also called ‘Truth Tables ’). To create a decision table, open a spreadsheet, and write down each potential action as a column header starting with the second column. Our column headers for this example will be:
If the process involves a lot of logical branching, you might consider an Activity Diagram, an Event-Response Diagram, a System Flow Chart, or any other tool suited for depicting conditional sequences of actions.
If the Functional Primitive is already automated, consider referencing existing documentation from that application. If it is not automated, check for a procedure manual describing how to do it.
Often, processes are controlled by business rules. You might consider simply listing the relevant business rules as process specifications:
Sort Mail Rules:
1. Orders with more than ½ payment are credit OK orders.
2. Checks will be forwarded to accounting for immediate deposit.
3. Complaints will be forwarded to Customer Service.
Given the state of technology today, you can use your smart phone to make a video showing the people performing the process. The key here is that you have many options for capturing and expressing what a Functional Primitive does and these options far exceed the scope of this publication. Each of the presented examples contain the same information about the SORT MAIL process. As the one wearing the BA hat, you have to pick the mode of presentation that is suitable for the process it defines and that you and your target audience both understand.
Capturing Data Elements
The other side of a data flow diagram is the data. Recognize that every arrow on the diagram represents data flowing from somewhere to somewhere and every data store represents data at rest. At the lowest level of detail, you need to understand exactly what data is contained within each data flow and in each data store.
Very often, problems in a process are caused by missing, incomplete, inaccurate, or untimely data. To be able to isolate data issues and to define the requirements for how a future application can avoid them, you need to know the data elements. You could consider this the equivalent of exploding a process. If you explode a data flow or a data store to its lowest level of detail, you find a bunch of Data Elements.
A Data Element is atomic data, meaning a piece of data that only has value as a whole. For example, the data flow Credit OK Order contains all of the data describing the order (customer name and address, items ordered, order date, etc.) and some indicator that this customer has good credit. To show the data on your data flow diagram, you can list all of the data elements on every data flow and every data store. Whereas this level of detail is overkill for most projects, it might be very valuable to explode one or two data flows or data stores down to the elementary level to uncover hidden problems or ensure understandable requirements. You might also consider hyperlinking the data flow or data store to a word document listing the relevant data elements.
Let us look at a concrete example. This is the Order Form that our example uses:
If I ignore the physical layout and look only at the individual data elements on the form, I get this list:
Order Date
Order Number
Customer PO#
Customer ID
Customer Name
Ship-To Address
Bill-To Address
Item#
Item Description
Unit Price
Quantity Ordered
Extended Price
Desired Shipping Method
Total Price
This list represents the minimum data content for every data flow on my diagram that contains the word Order (e.g., Orders w/$, Orders w/o $, New Customer Order, etc.). It is also the data content for the data store Valid Orders. Of course, that is primarily because the diagram represents a manual process involving physical order forms being moved from one process to another. There will be additional, flow-specific data elements associated with the state the order is in (with payment, without payment, new customer, etc.) but this list is my starting point.
What does the one wearing the BA hat need to communicate about each of these data elements to the solution providers so they can do their job? Typically, they need to know what the element contains (its description), where does it come from (its source), who has the authority to change it (its owner), what kind of data does it contain (its type), how to validate its contents (data range, validation rules), etc. Collectively, this data about each data element is called ‘Metadata’. Depending on the role you as the one wearing the BA hat have on the project, capturing and communicating the Metadata may or may not fall into your area of responsibility.
If you do have to capture this, I recommend creating a simple spreadsheet containing all relevant metadata about each data element, for example:
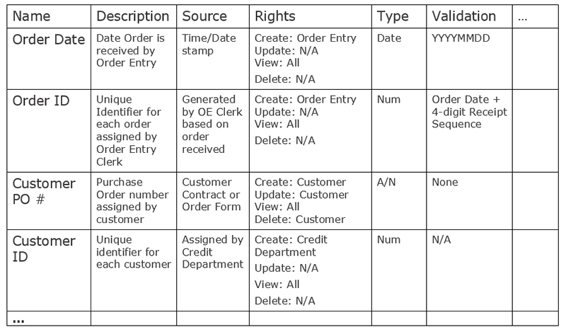
Obviously, the columns in the spreadsheet can be different based on your organization’s needs and the project. The key takeaway here is that solution providers need to know a ton of details about the data that the solution will manipulate. Whether the responsibility of the one wearing the BA hat or another role (i.e., the one wearing the data analyst hat) does this, it should be business decisions made by the appropriate decision makers within the business community and not left to the imagination of those tasked with developing the solution or even the one wearing the BA hat.
Horizontal Balancing Reveals Missing Data Elements
If you invest the time to create a data flow diagram (DFD), make sure that you are getting the most out of it. You can use the diagram to identify potentially missing data, redundant data, and possible data conflicts. We would like to introduce a technique called ‘Horizontal Balancing’ or the ‘Preservation of Data’ law. The technique can be very useful for identifying data discrepancies, inconsistencies, and conflicts which are three major contributors to IT project overruns and failures.
Based on the rules governing DFDs, a process has to transform data, meaning the data it produces has to be different than the data it consumes. Logic dictates that the data coming out of a process can only come from two possible sources: either it comes directly via an incoming data flow OR the process creates it using the data it receives.
A data flow can come from a data store, another process, or an external entity. Processes need algorithms or business rules to create data. For example, the simple process Determine Age contains the algorithm Age = Current Year(from today’s date) – Birth Year (from the Employee’s Date of Birth). Algorithms and business rules in turn need data (getting the Birth Year requires an Employee ID to select the appropriate employee) which has to either come into the process from an incoming data flow or itself be created by a different algorithm or business rule. In the end, you should account for every data element the process creates and every data element it needs to create the output.
To simplify horizontal balancing, focus on data from the incoming data flow that each process needs to create the relevant output. For example, the physical order form is sent from one process to the next in our example, but each process only needs specific data elements. For example, the VERIFY CREDIT process only needs the Customer ID and/or Customer Name to access the CUSTOMERS data store. Customer ID and Customer Name are essential; all of the other data elements on the order form are irrelevant to accessing the customer data.
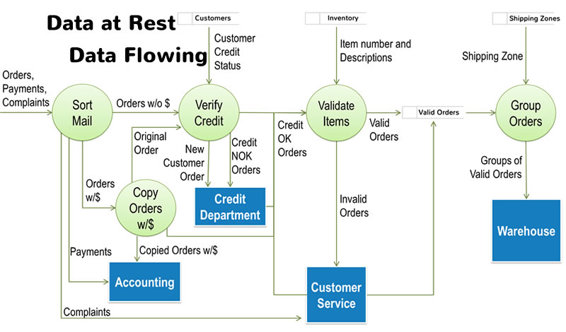
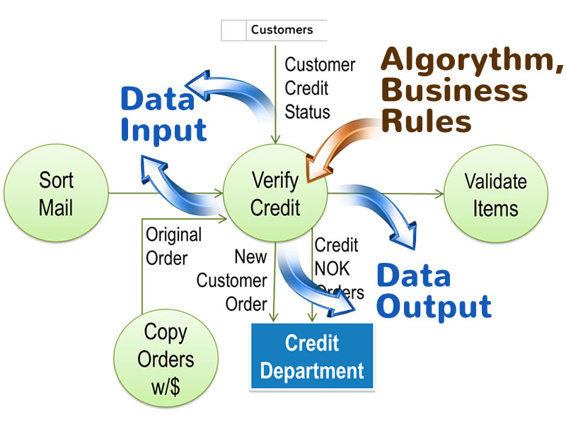
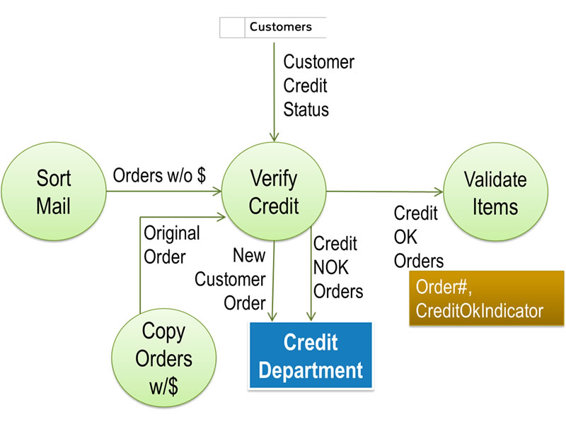
I will demonstrate this concept using the VERIFY CREDIT process from our retail store order entry example.
All three outgoing data flows have the word ‘Orders’ in their name because they deal with physical order forms.
In my analysis of the Order Form shown in the last chapter, I discovered it contains the data elements:
Order Date
Order Number
Customer PO#
Customer ID
Customer Name
Ship-To Address
Bill-To Address
Item#
Item Description
Unit Price
Quantity Ordered
Extended Price
Desired Shipping Method
Total Price
From the sample orders Paul, an Order Entry Clerk, provided, I also note that some have a stamp ‘Attached Payment’ with a dollar amount handwritten below it. Some also have a ‘Credit OK’ stamp and others have one stating ‘Credit Check Requested’. In rifling through those stamped ‘Credit Check Requested’, I also find several orders in which the Customer ID field is blank.
I initiate horizontal balancing starting with the ‘norm’ or most common flow created by the process. According to Paul, that is the Credit OK Orders data flow going to the VALIDATE ITEMS process. When I ask Paul to identify the Essential Data Elements on that flow, he replies, “The only Essential Data Element in this case would be the CreditOK Indicator on the order. It just shows that the order is approved for further processing.”
“I understand. But I also think you would need to know which order that ‘Credit OK Stamp’ is on, wouldn’t you?”
Paul replies, “That makes sense. I guess we also need the Order Number, which is assigned when we sort the mail. It is added to each order by whichever of us is sorting the mail. It simply consists of the current date plus a 4-digit running number. The example I have here has order number 141103_1966 written on it by whoever sorted the mail on November 3, 2014.”
Based on that information, I add Order#, CreditOK Indicator beneath the line labeled Credit OK Orders in parenthesis to indicate these are data elements.
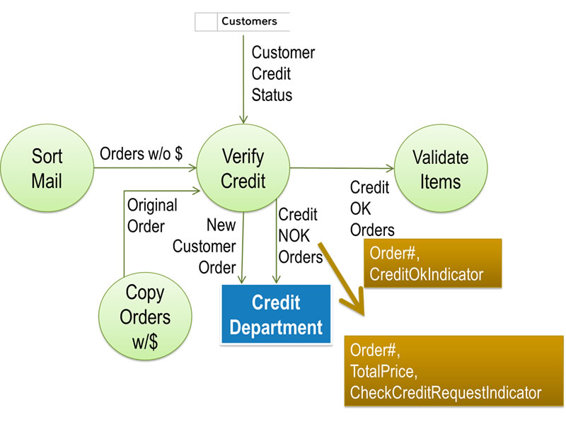
“OK, the next flow is the Credit NOK Orders being sent to the CREDIT DEPARTMENT. What is the essential information on that flow? I assume the Order Number and some kind of a stamp indicating the credit is not OK?”
Paul: “Those would be the ones with ‘Credit Check Requested’ stamped on them. That indicates it is either a new customer which we indicate by leaving the ‘Customer ID’ blank or an existing customer who owes us from previous orders.”
“Makes sense. So Essential Data for the Credit NOK Orders data flow would be the ‘Order Number’ and the ‘Check Credit Request Stamp’, right? Does the CREDIT DEPARTMENT need any other information to deal with these orders?”
“Sure, they need to know the ‘Total Price’ on the order so they can determine whether they should OK the order and send it back to us with the ‘CreditOK Stamp’on it or not.”
“What do they do with Credit NOK Orders that you send them that they do not approve?”
“You would have to ask someone in the CREDIT DEPARTMENT that. I think they send them over to Customer Service to contact the customer since they are the only ones in the company who are allowed direct customer contact.”
“If that is true, that would be between the CREDIT DEPARTMENT and CUSTOMER SERVICE, both of whom are out of scope for our project so we won’t worry about those orders.” I jot down Order#, CheckCreditRequest Indicator, Total Price below the Credit NOK Orders label.
“And I guess the same is true for New Customer Orders, right?”
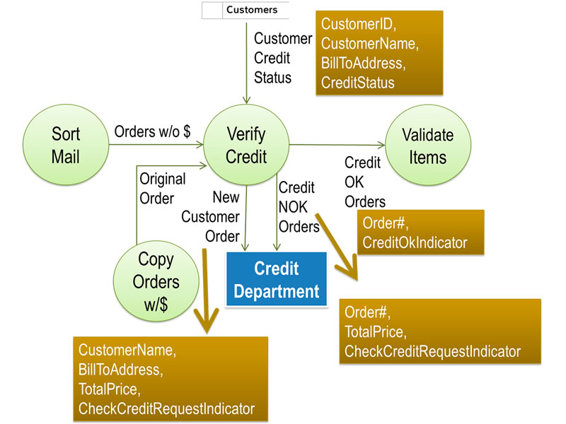
“No. An order is from a new customer if we can’t match the ‘Customer Name’ and ‘Bill-To’ from the order with any customers in our CUSTOMERS file. Actually, if the customer provides a ‘Customer ID’, we look for that first and if we find it in our file, we compare the ‘Customer Name’ and ‘Bill-To Address’ from the ‘Order’ to our file. If they match, then we simply look at the customer’s ‘Credit Status’ and put the respective stamp on the order.
“If the ‘Customer ID’ on the form is blank, we have to search the alphabetical customer list to try to find the customer. If we have a customer with a matching name, we compare the ‘Bill-To Address’ on the form with the one in our CUSTOMERS file. If they match, we fill in the ‘Customer ID’ on the ‘Order’ and again, add the respective ‘Credit Status Stamp’. If we can’t find the customer either by the ‘Customer ID’ or by the ‘Customer Name’, we stamp the ‘Order Credit Check Requested’ and put it on the pile going to the CREDIT DEPARTMENT.”
I add the data elements CustomerID, Customer Name, Bill-To Address, and Credit Status to the data flow coming from the CUSTOMERS data store into the VERIFY CREDIT process. In addition, I add the Customer Name, Bill-To Address, CheckCreditRequest Indicator, and Total Price below the New Customer Orders label and ask, “Does that accurately represent what you just told me?”
Paul replies, “I think so. I don’t know whether the CREDIT DEPARTMENT needs anything else from us for a New Customer Order, but what you wrote down makes sense to me. I am not sure they don’t need the Ship-To Addressfor the customer as well. You might want to check with them to confirm that they do not need anything else, though.”
“I will certainly run this by them to see if this is all the data they need to process either a New Customer Order or one from a customer with bad credit. For now, we will assume that the Data Elements I listed on the diagram are the essential Data Elements on each flow coming out of the VERIFY CREDIT process. As I explained earlier, each of these data elements has to come into the process on one of the incoming data flows or be created in the process. Coming back to the primary data flow Credit OK Orders, you told me that the Order# is created in the SORT MAIL process, right?”
“Right. That’s the number we have to add to make sure we can keep track of the order.”
“Great.” I write Order# beneath the data flow labels Orders w/o $ and Original Order and add “I assume that this is true whether the order had any payment attached or not, correct?” Paul confirms my assumption.
“Furthermore, I understood you earlier to indicate that you always get a ‘Customer Name’, and ‘Bill-to Address’ from the order and sometimes you also get a ‘CustomerID’.” After Paul confirms, I add those Data Element names below the Order# on both, the Orders w/o $ and Original Order data flows. I also notice that the Total Price is on order form so I add it as a data element to the Orders w/o $ and the Original Order data flows.
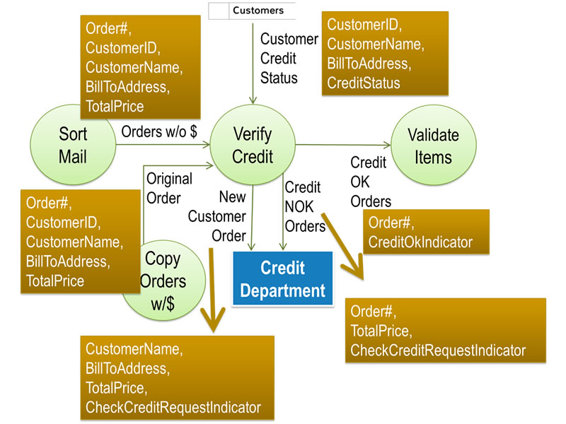
Having dealt with all outgoing and incoming flows, I now review the results with Paul. “It appears that the only data VERIFY CREDIT creates is the CreditOK Indicator or the CheckCreditRequest Indicator. Both of them are created based on the contents of the Customer’s Credit Status, which is coming out of the CUSTOMERS File. You find the customer based on either the CustomerID or both Customer Name and Bill-To Address. Both of them are coming in on one of the two order data flows. Is that all correct?”
Paul agrees.
All materials on the site are licensed Creative Commons Attribution-Sharealike 3.0 Unported CC BY-SA 3.0 & GNU Free Documentation License (GFDL)
If you are the copyright holder of any material contained on our site and intend to remove it, please contact our site administrator for approval.
© 2016-2026 All site design rights belong to S.Y.A.