Optimizing Hadoop for MapReduce (2014)
Chapter 2. An Overview of the Hadoop Parameters
Once you have your Hadoop job running, it is important to know whether your cluster resources are being fully utilized. Fortunately, the Hadoop framework provides several parameters that enable you to tune your job and specify how it will run on the cluster.
Performance tuning involves four main components: CPU utilization, memory occupation, disk I/O, and network traffic. This chapter describes the most relative parameters to these components and introduces techniques to optimize Hadoop execution and define some configuration parameters.
It is important and essential to have an efficient monitoring tool, with alerts delivered when a problem is developing or occurs, which provides a visual indication of how the Hadoop cluster is and has been performing. This chapter is focused on introducing Hadoop performance tuning using configuration parameters and also introducing several tools for monitoring Hadoop services.
In this chapter, we will cover the following topics:
· Investigation of Hadoop tunable parameters
· Hadoop configuration parameters related to CPU utilization, memory, disk I/O, and network
· Hadoop metrics
· Hadoop monitoring tools
Investigating the Hadoop parameters
As discussed in Chapter 1, Understanding MapReduce, there are many factors that may affect the Hadoop MapReduce performance. In general, workload-dependent Hadoop performance optimization efforts have to focus on three major categories: the system hardware, the system software, and the configuration and tuning/optimization of the Hadoop infrastructure components.
It is good to point out that Hadoop is classified as a highly-scalable solution, but not necessarily as a high-performance cluster solution. Administrators can configure and tune a Hadoop cluster with various configuration options. Performance configuration parameters focus mainly on CPU utilization, memory occupation, disk I/O, and network traffic. Besides the main performance parameters of Hadoop, other system parameters such as inter-rack bandwidth may affect the overall performance of the cluster.
Hadoop can be configured and customized according to the user's needs; the configuration files that get generated automatically after installation can be modified to meet the specific needs of applications and clusters.
The configuration files fall in two categories: read-only default configuration and site-specific configuration:
· The first category includes core-default.xml, hdfs-default.xml, and mapred-default.xml
· The second category includes core-site.xml, hdfs-site.xml, and mapred-site.xml
There are a large number of variables in Hadoop configuration files that you can define or override in order to control the Hadoop configuration. These variables can be defined in core-site.xml, hdfs-site.xml, and mapred-site.xml. Some variables are used to specify file paths on your system, while others adjust different aspects of the Hadoop framework with different granularity deep inside it. Each configuration file has name-value pairs expressed in an XML format, and they define the workings of different aspects of Hadoop.
From a system's hardware perspective, it is paramount to balance the appropriate hardware components with regard to performance, scalability, and cost. From a software perspective, the choice of the operating system, the JVM (Java Virtual Machine), the specific Hadoop version, as well as other software components that are necessary to run the Hadoop setup do have a profound impact on performance and stability of the environment. The design, setup, configuration, and tuning phases of any Hadoop project are paramount to fully benefit from the distributed Hadoop hardware and software solution stack.
The mapred-site.xml configuration file
The mapred-site.xml file may be considered as the main key to enhance the Hadoop MapReduce performance. This configuration file contains CPU, memory, disk I/O, and network-related parameters.
The CPU-related parameters
The following two parameters are the most relative ones to CPU utilization. By overriding these variables, you specify the maximum number of map/reduce tasks that will be run simultaneously by the TaskTracker node. By default, the value of both these parameters is 2.
|
Configuration variable |
Description |
Default value |
|
mapred.tasktracker.map.tasks.maximum |
It is used to set the maximum number of map tasks that TaskTracker will run simultaneously |
2 |
|
mapred.tasktracker.reduce.tasks.maximum |
It is used to set the maximum number of reduce tasks that TaskTracker will run simultaneously |
2 |
Theoretically, increasing these default values will increase the CPU utilization and therefore improve the performance, but this must be done smartly in accordance with your cluster resources such as CPU (with/without the hyper threading factor) and available memory. Otherwise, you may downgrade the overall MapReduce jobs and the cluster performance.
One typical question asked by users is how many mappers/reducers should be set to achieve best performance? To set this value, you should consider TaskTracker's utilization of resources such as CPU, memory, and disk I/O. Also, you should consider if the job you are running is CPU intensive or not.
To illustrate these parameter settings, assume you have 10 Hadoop cluster nodes and each node has a quad-core CPU. Then, the total number of daemons should be no more than 10 (nodes) x 4 (CPU cores) = 40. Considering that one CPU core should be reserved for the DataNode daemon and another one for TaskTracker, only 38 CPU cores remain for map/reduce tasks.
You don't need to set the mapper or reducer count to the same value, because it depends on CPU utilization per task and how the job is done by each mapper and reducer to get the final result. You can distribute CPU resources 50 percent for mappers and 50 percent for reducers, use two-third of the CPU resources for mappers and one-third for reducers, or any other distribution scheme that allows you to get your cluster to run optimally.
Setting the count value to -1 means that Hadoop will use all the memory allocated by the administrator for the mapper and reducer tasks. Setting this value larger than the physical CPU cores count will result in intensive CPU context switching (see Chapter 4,Identifying Resource Weaknesses), which may considerably downgrade your cluster's performance.
The disk I/O related parameters
In order to optimize disk I/O operations, you may decide to use data compression, which is turned off by default. You can enable compression by changing the default value for parameters that control compression. The mapred.compress.map.output variable enables map output compression, the mapred.output.compress variable enables job output compression, and the mapred.map.output.compression.codec variable is used to define the compression codec.
|
Configuration variable |
Description |
Default value |
|
mapred.compress.map.output |
This is a Boolean (true or false) value, which is set to false by default. If set to true, the output of the map tasks will be compressed using the SequenceFile codec compression before being sent across the network. |
false |
|
mapred.output.compress |
This is a Boolean value; setting it to true will enable job output compression. |
false |
|
mapred.map.output.compression.codec |
This value is used to determine the compression codec (coder/decoder) that will be used to compress map outputs. |
org.apache.hadoop.io.compress.DefaultCodec |
Enabling compressed output for map tasks will reduce the intermediate data volume to write on the storage. Therefore, this will speed up disk write operations in both shuffle and writing phases and reduce the total time of data transfer. Speeding up disk write operations using compression will have an additional CPU cost overhead during the compression/decompression process.
Real-world experience demonstrates that you should enable compression only when your input data is large and easily splittable (such as text files). Otherwise, enabling compression may downgrade the cluster's performance.
To achieve disk I/O balance and greatly improve I/O performance, you can use the feature of writing to multiple locations to write data on all disks on each node. Using multiple physical devices yields roughly 50 percent better performance than RAID 0 striping.
The following two parameters determine where to store data in Hadoop. You may use the mapred.local.dir variable to specify where the intermediate map output data is stored, and the dfs.data.dir variable to specify where the HDFS data is stored.
|
Configuration variable |
Description |
Default value |
|
mapred.local.dir |
This is used to specify the local directory where we need to store map's intermediate files. You can define multiple directories for this parameter, which should be on separate physical devices. If multiple directories are provided, data is spread over these directories. The directories that do not exist are ignored. |
${hadoop.tmp.dir}/mapred/local |
|
dfs.data.dir (hdfs-site.xml) |
This is used to specify the directory where the DataNode should store its blocks on the local filesystem. If you provide a comma-delimited list of directories, the data blocks will be stored in all directories. If this parameter is lost, your entire HDFS dataset is lost. |
${hadoop.tmp.dir}/dfs/data |
The memory-related parameters
The memory resource is a very important resource that needs to be allocated smartly in order to avoid swap and allow Hadoop jobs run optimally. You can use memory-related parameters to set the amount of physical memory that you want to reserve to MapReduce jobs. The following table shows the most common memory-related parameters:
|
Configuration variable |
Description |
Default value |
|
mapred.child.java.opts |
This controls the amount of memory available to each JVM task. The default value will reserve 200 MB of memory to run MapReduce jobs. |
-Xmx200m |
|
Mapred.child.ulimit |
This parameter is used to control the limit of virtual memory that will be allocated to a MapReduce job. |
The default Mapred.child.ulimit value is not specified. If you choose to specify a value for this parameter, then it should be greater than or at least equal to the –Xmx value of mapred.child.java.opts. Otherwise, the Java Virtual Machine might not start. To set this value correctly, you should set it to a value greater than 2 * mapred.child.java.opts.
Merging and sorting is another aspect that you can optimize using memory-related parameters. There are three main parameters that you may set to optimize merging and sorting MapReduce performance.
|
Configuration variable |
Description |
Default value |
|
io.sort.mb |
This specifies the amount of buffer space in megabytes to use when sorting streams. When misconfigured, this parameter often causes jobs to run out of memory on small memory machines. |
100 |
|
io.sort.factor |
This determines the number of map output partitions to merge at a time while sorting files. |
10 |
|
mapred.job.reduce.input.buffer.percent |
This determines the percentage of memory relative to the maximum heap size to retain map outputs during the reduce phase. The reduce task can begin when the shuffle is concluded, and the allocated memory for any remaining map outputs must be less than this threshold. |
0.0 |
If you increase the values of io.sort.mb and io.sort.factor, it will allocate more memory for sorting and merging operations. This minimizes spills to the disk, which will reduce I/O time for both mapper and reducer tasks. On the other hand, increasing these values increases the memory required by each map task and might increase the garbage collector activities when memory allocated for each task is not large enough.
Our experience shows that you may need to increase the value of io.sort.factor if you have large number of spills to the disk, and high I/O times of the sort/shuffle phase. Also, if your map output is large with frequent map-side I/O, you should try to increase the value of io.sort.mb. To avoid a "task out of memory" error, you should set io.sort.mb to a value greater than 0.25*mapred.child.java.opts and less than 0.5*mapred.child.java.opts.
You may increase the value of mapred.job.reduce.input.buffer.percent to get more buffer in memory, which will reduce local disk I/O times during the reduce phase, but as stated earlier, if more memory is allocated, it might increase the garbage collector's activities to free unused memory. Therefore, you should try to allocate more memory when map output is large and local disk I/O is frequent during the reduce sort phases.
The network-related parameters
Hadoop has a concept called rack awareness. Administrators can define the rack of each DataNode in the cluster. Making Hadoop rack aware is essential because rack awareness prevents data loss and a well rack-aware configuration improves network performance. The variables defined in the following table help make a Hadoop setup rack aware:
|
Configuration variable |
Description |
Default value |
|
mapred.reduce.parallel.copies |
This specifies the number of parallel transfers used to fetch map output during the shuffle phase. |
5 |
|
topology.script.file.name (core-site.xml) |
This specifies the script name to be called in order to resolve DNS names to network topology names (for example, pass host.servers.company as an argument, and return /rack1 as the output). |
Increasing mapred.reduce.parallel.copies might increase the network flow rate and speed up the process of copying map outputs at the cost of more CPU usage. We suggest increasing this value only if your mapper task produces a very large output.
Hadoop rack awareness is configured using the topology.script.file.name parameter in the core-site.xml file. This parameter should point to a user-defined script that determines rack-host mapping (Rack1: DataNode1, DataNode2 … Rack2: DataNode6, DataNode7…). If topology.script.file.name is not configured, /default-rack is passed for any node's IP address placed on the same rack.
Note
You may learn more about Hadoop's rack awareness setup and configuration at http://hadoop.apache.org/docs/r1.2.1/cluster_setup.html#Hadoop+Rack+Awareness
The hdfs-site.xml configuration file
The hdfs-site.xml configuration file contains many parameters related to the HDFS storage system that you can override in order to customize your Hadoop installation and/or tune it. The value of the filesystem block size is the most commonly tuned HDFS parameter in hdfs-site.xml. It controls the size of the input split, which will be processed by each map task. The size of the input split can be specified through three main variables: dfs.block.size (in hdfs-site.xml), mapred.min.split.size, and mapred.max.split.size(both in mapred-site.xml).
By default, dfs.block.size is set to 67108864 bytes (64 MB). Increasing this value will create larger input splits and therefore reduce the number of blocks that will be stored on each DataNode.
The total number of map tasks depend on the input data size and the total input split size. While map output size is proportional to the HDFS block size, a bigger block size could lead to additional map-side spills if spill-related properties are not adjusted accordingly.
Usually, to maximize throughput, you should adapt the block size to the input data. For a very large input file, it is best to use very large blocks (128 MB or even 256 MB), while for smaller files, using a smaller block size is better. Notice that by changing thedfs.block.size parameter, when the file is written, it is possible to have files with different block sizes on the same filesystem (refer to Chapter 5, Enhancing Map and Reduce Tasks, to understand the block size impact).
The following table shows the main parameters that you can set in the hdfs-site.xml configuration file:
|
Configuration variable |
Description |
Default value |
|
dfs.access.time.precision |
This is the precision, in milliseconds, of the access times that are maintained. If this value is 0, no access times are maintained. The default value is 1 hour. To disable access time for HDFS, set this to 0(zero), which may increase performance on busy clusters where bottlenecks often occur due to slow log writing speeds on NameNode. |
3600000 |
|
dfs.balance.bandwidthPerSec |
This specifies the maximum amount of bandwidth that each DataNode may utilize to rebalance block storage among Hadoop cluster's DataNodes. This value is expressed in bytes per second. |
1048576 |
|
dfs.block.size |
This is the default block size for new files. This parameter should be tuned depending on your cluster and your data jobs. |
67108864 |
|
dfs.data.dir |
This determines the location on the local filesystem where a data node should store its blocks. If a comma-delimited list of directories can be provided, then data will be stored in all named directories. If this data is lost, your entire HDFS data set is lost. |
${hadoop.tmp.dir}/dfs/data |
|
dfs.datanode.du.reserved |
This is the amount of space that must be kept free in each location used for block storage. |
0.0 |
|
dfs.datanode.handler.count |
This determines the number of server threads handling block requests. If you increase this value, this may increase the DataNode throughput, in particular if it stores its blocks on multiple separate physical devices. |
3 |
|
dfs.max.objects |
This variable determines the maximum number of objects (files, directories, and blocks) permitted. By default, this variable is set to zero, which indicates no limit to the number of objects. |
0 |
|
dfs.name.dir |
This variable supports individual directory path or a comma-separated list of directories to use for data block storage. Hadoop will process this list using a round-robin algorithm for storing new data blocks. To get better performance, these locations should be set to point to separate physical devices. |
${hadoop.tmp.dir}/dfs/name |
|
dfs.name.edits.dir |
This determines where on the NameNode the transaction (edits) file should be stored. Ideally, for redundancy, you can define a comma-delimited list of directories to replicate the transaction file in all the directories. The default value is the same as dfs.name.dir. |
${dfs.name.dir} |
|
dfs.namenode.handler.count |
This specifies the number of server threads for the NameNode. You should increase this value if you have a large and busy cluster. |
10 |
|
dfs.replication |
This determines the default block replication number of each block stored on the cluster. This number can be specified when the file is created. Defining a large value allows more DataNodes to fail before blocks are unavailable; however, this will increase the amount of network I/O required to store data and the disk space requirements. This may also increase the probability that a map task will have a local replica of the input split. |
3 |
|
dfs.replication.considerLoad |
This is a Boolean value that is used to decide the DataNode load when picking replication locations. |
true |
Changing the block size will impact a number of things. In most cases, splitting a file with large block size will produce fewer blocks. Therefore, this will reduce the metadata of the NameNode, which is important with very large files. Moreover, it will be possible for a client to read/write more data without interacting with the NameNode.
With fewer blocks, you need fewer nodes to store the file. This may reduce total throughput for parallel access and make the scheduling of data-local tasks more difficult.
Reducing the parallel throughput also means you may not gain maximum parallelism, which can decrease overhead and your cluster may be underutilized. This increases the chance of straggling of tasks, and if a task fails, more work needs to be redone.
Also, having fewer blocks means having more data to process per task, which can cause additional read/write operations.
The core-site.xml configuration file
The core-site.xml file is one of the major Hadoop configuration files and contains the configurations common to the whole Hadoop distribution. It exists on every host in your cluster.
Basically, the variables of core-site.xml allow you to override or define the distributed filesystem name, the temporary directory, and some other parameters related to the network configuration.
|
Configuration variables |
Description |
Default value |
|
fs.default.name |
This determines the name (URI) of the default filesystem. This should be hdfs://NameNodeHostName:PORT. |
file:/// |
|
hadoop.tmp.dir |
This determines the path to store temporary files. |
/tmp/hadoop-${user.name} |
|
fs.checkpoint.dir |
It determines a list of directories where the secondary NameNode stores checkpoints. It stores a copy of the checkpoint in each directory in the list. |
${hadoop.tmp.dir}/dfs/namesecondary |
|
io.file.buffer.size |
This determines the amount of buffered data during read/write operations on the disk files. The size of this buffer is typically a multiple of the hardware page size (4096 on Intel x86). |
4096 |
In the case of small clusters, all servers are usually connected by a single switch. Therefore, there are only two locality levels: on-machine and off-machine. When loading data from HDFS into the DataNode's local drive, the NameNode will schedule only one copy to be transferred into the local DataNode, and will randomly pick two other machines from the cluster for storing a replica of the data.
For larger Hadoop clusters that span multiple racks, it is important to ensure that replicas of data exist on all racks. Then, a switch failure will not render the data blocks unavailable due to replicas being available.
The io.file.buffer.size parameter sets the buffer size used by Hadoop during I/O operations. This parameter is set by default to 4096 bytes (4 KB). On modern systems, it can be increased to 65536 bytes (64 KB) or 131072 bytes (128 KB) for performance gains.
Hadoop MapReduce metrics
Due to its scale and distributed nature, diagnosing the performance problems of Hadoop programs and monitoring a Hadoop system are inherently difficult. Although Hadoop system exports many textual metrics and logs, this information may be difficult to interpret and not fully understood by many application programmers.
Currently, Hadoop reports coarse-grained metrics about the performance of the whole system through logs and metrics API. Unfortunately, it lacks important metrics for per-job/per-task levels such as disk and network I/O utilization. In the case of running multiple jobs in a Hadoop system, it also lacks metrics to reflect the cluster resource utilization of each task. This results in difficulty for cluster administrators to measure their cluster utilization and set up the correct configuration of Hadoop systems.
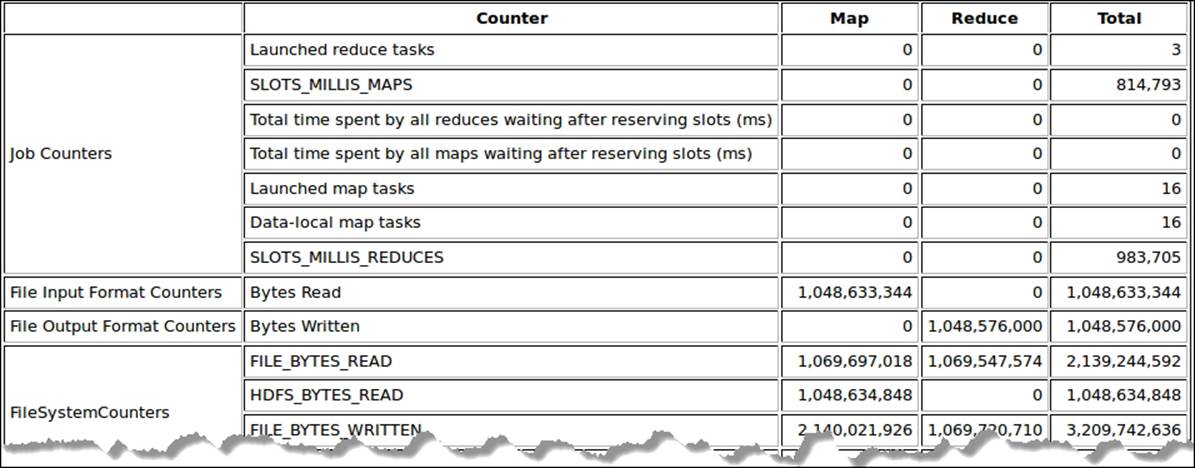
Furthermore, logs generated by Hadoop can get excessively large, which makes it extremely difficult to handle them manually and can hardly answer the simple question: "why can a specific number of mappers/reducers not achieve optimal throughput?" The following screenshot shows a partial Hadoop job history view in some detail:
Performance monitoring tools
Monitoring basic system resources on Hadoop cluster nodes such as CPU utilization and average disk data transfer rates helps to understand the overall utilization of these hardware resources and identify any bottlenecks while diagnosing performance issues. Monitoring a Hadoop cluster includes monitoring the usage of system resources on cluster nodes along with monitoring the key service metrics. The most commonly monitored resources are I/O bandwidth, number of disk I/O operations per second, average data transfer rate, network latency, and average memory and swap space utilization.
Hadoop performance monitoring suggests collecting performance counters' data in order to determine whether the response times of various tasks lie within acceptable execution time range. The average percentage utilization for MapReduce tasks and HDFS storage capacity over time indicates whether your cluster's resources are used optimally or are underused.
Hadoop offers a substantial number of metrics and information sources for monitoring and debugging of Hadoop services. It requires correlating and collecting these system and service metrics from the cluster nodes to analyze the overall state of the Hadoop cluster along with diagnosing any problems that are discovered.
You may enhance your monitoring experience by using proven open source monitoring systems such as Chukwa, Ganglia, Nagios, and Ambari (a nonexhaustive list) to consolidate various metrics and information sources provided by Hadoop into more meaningful service-specific summary, graphs, and alerts.
Using Chukwa to monitor Hadoop
Chukwa (http://incubator.apache.org/chukwa/) is an open source data collection system for monitoring and analyzing large distributed systems. It is built on top of Hadoop and includes a powerful and flexible toolkit for monitoring, analyzing, and viewing results.
Many components of Chukwa are pluggable, allowing easy customization and enhancement. It provides a standardized framework for processing the collected data and can scale to thousands of nodes in both collection and analysis capacities.
Using Ganglia to monitor Hadoop
Ganglia (http://ganglia.sourceforge.net/) was originally developed at the University of California, Berkeley. Its purpose is to provide a robust and resource-consuming solution to monitor a computing cluster's performance. This cluster can contain hundreds or thousands of nodes. Basically, Ganglia collects high-level variables such as CPU utilization and free disk space for each monitored node. Also, it can be used to monitor failed cluster nodes.
The current Hadoop version has built-in support for Ganglia (version 3.0+). It is a highly scalable cluster monitoring tool that provides graphical view information about the state of a single cluster or set of clusters, or individual machines in a cluster.
Ganglia's architecture and implementation on Hadoop supports federations of clusters, monitoring the state within each cluster and aggregating those states. The architecture includes a Ganglia Collector that runs monitoring daemons and collects metrics for each cluster. It also runs a meta daemon that aggregates the metrics for all clusters. The Ganglia Collector provides a web user interface that presents real-time dynamic views of memory usage, disk usage, network statistics, running processes, and other metrics.
Using Nagios to monitor Hadoop
Nagios (http://www.nagios.org/) is a popular open source monitoring tool system, which is heavily used in High Performance Computing (HPC) and other environments, and is designed to obtain system resources metrics. You can use it to monitor your Hadoop cluster resources and the status of applications and operating system attributes, such as CPU usage, disk space, and memory utilization.
Nagios has an integrated built-in notification system that focuses on alerting rather than gathering and tracking system metrics (such as Ganglia). The current version of Nagios allows you to run agents on target hosts and provides a flexible and customizable framework for collecting metrics and information data about the state of your Hadoop cluster.
Nagios can be used to address different monitoring perspectives:
· Getting instant information about your Hadoop infrastructure organization
· Raising and receiving alerts on system failures
· Analyzing, reporting, and producing graphs on cluster utilization and making decisions about future hardware acquisitions
· Detecting and anticipating future issues
· Monitoring how exhausted the queues are and finding the availability of nodes for running the jobs
Note
Nagios is to be considered as a health checking and alerting monitoring tool.
Using Apache Ambari to monitor Hadoop
The Apache Ambari project (http://incubator.apache.org/ambari/) simplifies Hadoop management and cluster monitoring. Its primary goal is to simplify the deployment and management of Hadoop clusters in multi-instance environments.
Ambari provides a set of intuitive and easy-to-use tools to monitor Hadoop clusters, hiding the complexities of the Hadoop framework. It exposes RESTful APIs for administrators to allow integration with other system(s). Furthermore, Ambari relies on measures from Ganglia and Nagios for an alert system function to send e-mails to the attention of the administrator when required (for example, when a node fails, the remaining disk space is low, and so on). Additionally, Ambari supports Hadoop security by supporting installation of secure (Kerberos-based) Hadoop clusters, providing role-based user authentication, authorization, auditing, and integration with LDAP and Active Directory for user management.
Tip
If you set up your Hadoop cluster through Apache Ambari, you can also use it to set up monitoring tools such as Ganglia or Nagios.
Summary
In this chapter, we discussed Hadoop MapReduce performance tuning and learned how application developers and cluster administrators can tune Hadoop in order to enhance the MapReduce job's performance.
We learned about most configuration variables related to CPU, disk I/O, memory and network utilization and discussed how these variables may affect the MapReduce job's performance.
Then, we learned about Hadoop metrics and suggested some open source monitoring tools, which enhance the Hadoop monitoring experience and are very handy to Hadoop cluster administrators and application developers.
In the next chapter, we will learn how to identify resource bottlenecks based on performance indicators and also learn about common performance tuning methods.
All materials on the site are licensed Creative Commons Attribution-Sharealike 3.0 Unported CC BY-SA 3.0 & GNU Free Documentation License (GFDL)
If you are the copyright holder of any material contained on our site and intend to remove it, please contact our site administrator for approval.
© 2016-2026 All site design rights belong to S.Y.A.