Optimizing Hadoop for MapReduce (2014)
Chapter 4. Identifying Resource Weaknesses
Every Hadoop cluster consists of different machines and different hardware. This means that each Hadoop installation should be optimized for its unique cluster setup. To ensure that your Hadoop is performing jobs efficiently, you need to check your cluster and identify potential bottlenecks in order to eliminate them.
This chapter presents some scenarios and techniques to identify cluster weaknesses. We will then introduce some formulas that will help to determine an optimal configuration for NameNodes and DataNodes. After that, you will learn how to configure your cluster correctly and how to determine the number of mappers and reducers for your cluster.
In this chapter, you will learn the following:
· To check the cluster's weakness based on some scenarios
· To identify CPU contention and inappropriate number of mappers and reducers
· To identify massive I/O and network traffic
· To size your cluster and define its sizing
· To configure your cluster correctly
Identifying cluster weakness
Adapting the Hadoop framework's configuration based on a cluster's hardware and number of nodes has proven to give increased performance. In order to ensure that your Hadoop framework is using your hardware efficiently and you have defined the number of mappers and reducers correctly, you need to check your environment to identify whether there are nodes, CPU, or network weaknesses. Then you can decide whether the Hadoop framework should behave as a new set of configuration, or needs to be optimized.
In the following sections, we will go through common scenarios that may cause your job to perform poorly. Each scenario has its own technique that shows how to identify the problem. The scenario covers the cluster node's health, the input data size, massive I/O and network traffic, insufficient concurrent tasks, and CPU contention (which occurs when all lower priority tasks have to wait when any higher priority CPU-bound task is running, and there are no other CPUs that can handle other work).
Checking the Hadoop cluster node's health
Often in multi-node Hadoop clusters, it is possible that a node may fail due to a hardware failure such as hard disk failure or a power supply failure. In this case, the node cannot be used by Hadoop to process jobs and the node will be marked as Blacklisted,Graylisted, or Excluded by the framework. This can also happen in a single node cluster. In such a case, the node is down and you cannot process any MapReduce jobs. Checking whether Hadoop is using all the nodes of your cluster is the first step to get full performance from your cluster.
To determine whether you have unused nodes in your cluster, you should check the cluster summary displayed on your JobTracker page. The cluster summary must show 0 nodes for each of the Blacklisted Nodes, Graylisted Nodes, and Excluded Nodes. The following screenshot shows a partial cluster summary in which appears the Blacklisted, Graylisted, and Excluded nodes:
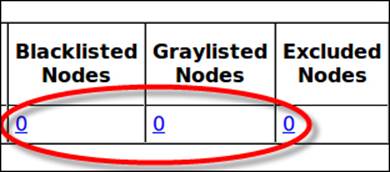
Your cluster should not have any unused nodes.
The excluded nodes are ignored by the Hadoop framework and are not permitted to connect to the cluster. Also, Hadoop doesn't schedule any jobs to process to the Blacklisted nodes and they don't contribute to the cluster; removing the Blacklisted nodes from the cluster can have a significant impact on the job's performance.
The Graylisted nodes are nodes that have intermittent failures (which may become permanent) and will affect your job's performance and execution time due to failing tasks. You should quickly react to the node failures by replacing or removing them. While Excluded nodes are controlled by the administrator by maintaining the dfs.hosts.exclude property (for HDFS) and the mapred.hosts.exclude property (for MapReduce), it's a good practice to set up monitoring for Blacklisted and Graylisted nodes using Hadoop cluster management tools such Nagios, Ganglia, or Cacti.
Checking the input data size
In some cases, you may run your MapReduce job that takes a certain amount of time to process data, and if you rerun the same job, you will observe that it takes longer to process the input data. This is not necessarily due to the inefficient implementation of a map function or a resource bottleneck, but may be due to the input data that has grown between the first and the second run. This may occur, for example, if you're running a web log processing job on a particular day and this day the logfile is much larger than normal logfiles, which may be the reason for slowness of your map job.
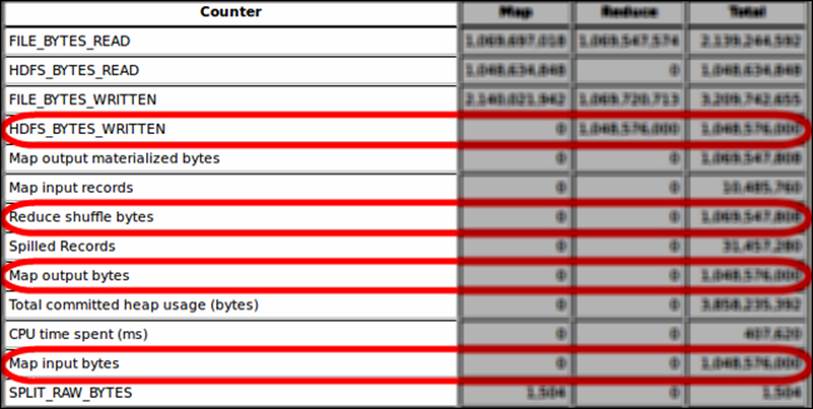
To identify whether there are different volumes of input data sizes in your map (or reduce) input sizes, you can compare the map input and output data sizes of the slow job with the input and output sizes of the baseline of your previous jobs. Basically, you need to compare four counters: HDFS_BYTES_WRITTEN, Reduce shuffle bytes, Map output bytes, and Map input bytes.
The following screenshot shows the Hadoop counters you need to focus on and compare their values with those of your baseline values:
Checking massive I/O and network traffic
As discussed in Chapter 3, Detecting System Bottlenecks, bottlenecks on disk I/O or network bandwidth could cause a slow job performance or even Java exceptions (often time-out exception). Massive I/O can occur either while reading the input data or while writing the output data. If the disk I/O or network traffic does not have a high throughput, computation resources are constrained to wait for the incoming data and will spend time waiting to get data to process.
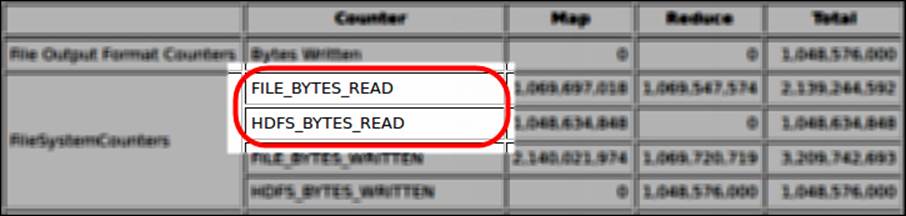
Bottlenecks may occur while reading very large input data which may constrain mappers to wait (or to be idle) before they can process the input data. To identify massive I/O due to large input data, you should focus on two Hadoop counter values:FILE_BYTES_READ and HDFS_BYTES_READ. These counter values should be huge if you have a very large input data.
The following screenshot shows the Hadoop counters you should focus on in order to identify a massive I/O due to large input data:
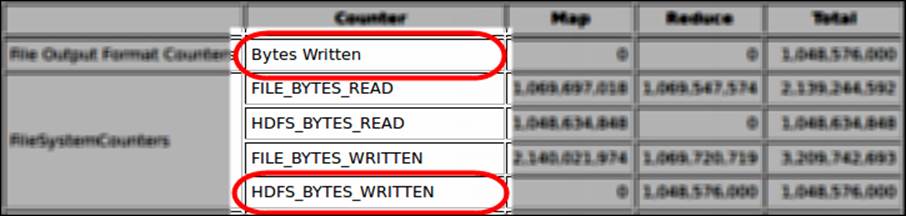
Massive I/O can also be caused by a large output data. This usually occurs when reducers write their output to HDFS, which requires a lot of I/O write operations. To identify any massive bottleneck I/O or network traffic, you can check the Bytes Written andHDFS_BYTES_WRITTEN Hadoop counter values if you see huge numbers. If such bottlenecks occur, you should observe high values for both counters. The following screenshot shows the counters that you should give a particular attention to identify massive I/O and network traffic caused by large output data:
You should also consider the replication factor (which is configured through the dfs.replication parameter). It determines the default block replication number of each block stored in the cluster (see Chapter 2, An Overview of the Hadoop Parameters). If your replication factor is greater than one, it means more data to read/write and the data will be replicated across the network. Therefore, you will usually observe high values in counters for both I/O and network usage.
To resolve any massive I/O or network bandwidth bottleneck, you can compress data or use combiners. These techniques will be discussed in Chapter 6, Optimizing MapReduce Tasks.
Checking for insufficient concurrent tasks
Poor MapReduce job configuration may leave many resources idle. Basically, concurrent tasks are determined by the total capacity of Map and Reduce slots for the cluster, and the number of Map and Reduce jobs defined to process a particular job.
If there is a misconfiguration for the concurrent tasks either for the cluster or the job, the CPU resource will often be idle or overloaded to this misconfiguration. The most commonly observed misconfiguration is leaving the CPU's cores in a cluster idle with no work assigned to them. This misconfiguration may also lead to underutilized I/O throughput and network bandwidth, because there are no requests coming from the CPU cores. If you have misconfigured your cluster or job capacity, you will observe a low CPU utilization on your DataNodes.
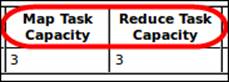
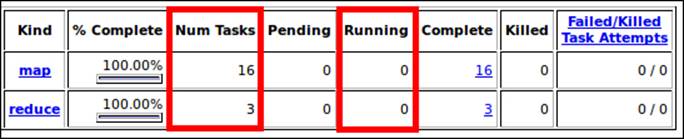
To check underutilization configuration, you should focus on the Hadoop Num Tasks, Running, Map Task Capacity, and Reduce Task Capacity counters, which are helpful to check whether you are using your CPU's cores to their full capacity or not. The Map Task Capacity and Reduce Task Capacity values should be set at least to the CPU's cores number, that is 1.
The following screenshot shows a partial cluster summary (Map Task Capacity and Reduce Task Capacity) from the MapReduce administration page:
The following screenshot shows partial job details where you can find the Num Tasks and Running Hadoop counters. You will learn how to set these values correctly later in this chapter.
Checking for CPU contention
Nowadays, all operating systems are multitasking systems and utilize multicore CPUs. In order to allow multitasking and enable multiple processes to share a single CPU, the operating system needs to store and restore the CPU state (context) when switching between processes, so that execution can be resumed from the same point at a later time. This is what is called Context Switch. The operating system assigns a priority for each task that will be executed by the CPU. Contention occurs when all lower priority tasks wait when any higher priority CPU-bound task is running and there are no other CPUs that can handle other tasks. Consequently, when the number of Context Switches per second is high, it means that the CPU is busy and is spending a lot of time storing and restoring process states.
Therefore, excessive context switching means that you're possibly running too many tasks on your host. When configuring MapReduce, as a rule of thumb, the total of mapred.tasktracker.map.tasks.maximum and mapred.tasktracker.reduce.tasks.maximum should be around the total CPU's cores, that is, 1 in a normal condition or 120 to 150 percent of the logical cores on your host. Due to Hyper-Threading, the CPU might process more than one job at a time.
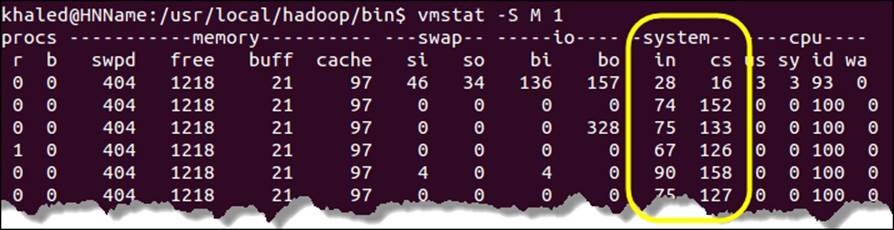
In order to display the Context Switch's statistics, you may use the vmstat Linux tool, which is very helpful to display utilization statistics of your CPU (cs = Context Switch).
The following screenshot shows the vmstat output on a lightly used machine. The in column indicates the number of interrupts per second. If this number is high (value * 1000 or more), it indicates a heavily used machine or problem with the hardware.
Note
The vmstat tool was launched using the –S M 1 command. The –S parameter is used to set the unit size, M indicates the unit size: 1048576, and the last parameter 1 indicates the delay between updates.
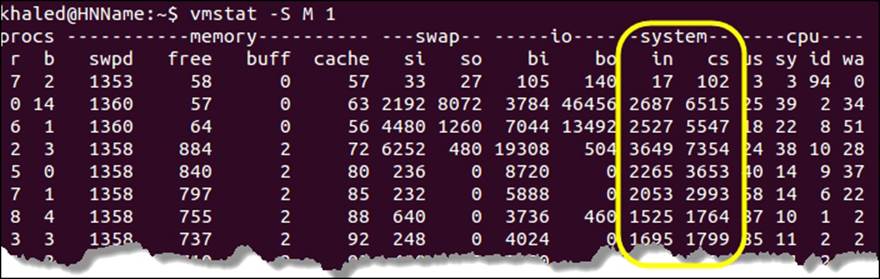
The following screenshot shows the vmstat output on a heavily used machine. You can observe that the number of interrupts per second (the in column) is high in comparison to the lightly used machine.
Sizing your Hadoop cluster
As discussed earlier, Hadoop's performance depends on multiple factors based on well-configured software layers and well-dimensioned hardware resources that utilize its CPU, Memory, hard drive (storage I/O) and network bandwidth efficiently.
Planning the Hadoop cluster remains a complex task that requires minimum knowledge of the Hadoop architecture and may be out the scope of this book. This is what we are trying to make clearer in this section by providing explanations and formulas in order to help you to best estimate your needs. We will introduce a basic guideline that will help you to make your decision while sizing your cluster and answer some How to plan questions about cluster's needs such as the following:
· How to plan my storage?
· How to plan my CPU?
· How to plan my memory?
· How to plan the network bandwidth?
While sizing your Hadoop cluster, you should also consider the data volume that the final users will process on the cluster. The answer to this question will lead you to determine how many machines (nodes) you need in your cluster to process the input data efficiently and determine the disk/memory capacity of each one.
Hadoop is a Master/Slave architecture and needs a lot of memory and CPU bound. It has two main components:
· JobTracker: This is the critical component in this architecture and monitors jobs that are running on the cluster
· TaskTracker: This runs tasks on each node of the cluster
To work efficiently, HDFS must have high throughput hard drives with an underlying filesystem that supports the HDFS read and write pattern (large block). This pattern defines one big read (or write) at a time with a block size of 64 MB, 128 MB, up to 256 MB. Also, the network layer should be fast enough to cope with intermediate data transfer and block.
HDFS is itself based on a Master/Slave architecture with two main components: the NameNode / Secondary NameNode and DataNode components. These are critical components and need a lot of memory to store the file's meta information such as attributes and file localization, directory structure, names, and to process data. The NameNode component ensures that data blocks are properly replicated in the cluster. The second component, the DataNode component, manages the state of an HDFS node and interacts with its data blocks. It requires a lot of I/O for processing and data transfer.
Typically, the MapReduce layer has two main prerequisites: input datasets must be large enough to fill a data block and split in smaller and independent data chunks (for example, a 10 GB text file can be split into 40,960 blocks of 256 MB each, and each line of text in any data block can be processed independently). The second prerequisite is that it should consider the data locality, which means that the MapReduce code is moved where the data lies, not the opposite (it is more efficient to move a few megabytes of code to be close to the data to be processed, than moving many data blocks over the network or the disk). This involves having a distributed storage system that exposes data locality and allows the execution of code on any storage node.
Concerning the network bandwidth, it is used at two instances: during the replication process and following a file write, and during the balancing of the replication factor when a node fails.
The most common practice to size a Hadoop cluster is sizing the cluster based on the amount of storage required. The more data into the system, the more will be the machines required. Each time you add a new node to the cluster, you get more computing resources in addition to the new storage capacity.
Let's consider an example cluster growth plan based on storage and learn how to determine the storage needed, the amount of memory, and the number of DataNodes in the cluster.
|
Daily data input |
100 GB |
Storage space used by daily data input = daily data input * replication factor = 300 GB |
|
HDFS replication factor |
3 |
|
|
Monthly growth |
5% |
Monthly volume = (300 * 30) + 5% = 9450 GB After one year = 9450 * (1 + 0.05)^12 = 16971 GB |
|
Intermediate MapReduce data |
25% |
Dedicated space = HDD size * (1 – Non HDFS reserved space per disk / 100 + Intermediate MapReduce data / 100) = 4 * (1 – (0.25 + 0.30)) = 1.8 TB (which is the node capacity) |
|
Non HDFS reserved space per disk |
30% |
|
|
Size of a hard drive disk |
4 TB |
|
|
Number of DataNodes needed to process: Whole first month data = 9.450 / 1800 ~= 6 nodes The 12th month data = 16.971/ 1800 ~= 10 nodes Whole year data = 157.938 / 1800 ~= 88 nodes |
||
Tip
Do not use RAID array disks on a DataNode. HDFS provides its own replication mechanism. It is also important to note that for every disk, 30 percent of its capacity should be reserved to non-HDFS use.
It is easy to determine the memory needed for both NameNode and Secondary NameNode. The memory needed by NameNode to manage the HDFS cluster metadata in memory and the memory needed for the OS must be added together. Typically, the memory needed by Secondary NameNode should be identical to NameNode. Then you can apply the following formulas to determine the memory amount:
|
NameNode memory |
2 GB – 4 GB |
Memory amount = HDFS cluster management memory + NameNode memory + OS memory |
|
Secondary NameNode memory |
2 GB – 4 GB |
|
|
OS memory |
4 GB – 8 GB |
|
|
HDFS memory |
2 GB – 8 GB |
|
|
At least NameNode (Secondary NameNode) memory = 2 + 2 + 4 = 8 GB |
||
It is also easy to determine the DataNode memory amount. However, this time, the memory amount depends on the physical CPU's core number installed on each DataNode.
|
DataNode process memory |
4 GB – 8 GB |
Memory amount = Memory per CPU core * number of CPU's core + DataNode process memory + DataNode TaskTracker memory + OS memory |
|
DataNode TaskTracker memory |
4 GB – 8 GB |
|
|
OS memory |
4 GB – 8 GB |
|
|
CPU's core number |
4+ |
|
|
Memory per CPU core |
4 GB – 8 GB |
|
|
At least DataNode memory = 4*4 + 4 + 4 + 4 = 28 GB |
||
Regarding how to determine the CPU and the network bandwidth, we suggest using the now-a-days multicore CPUs with at least four physical cores per CPU. The more physical CPU's cores you have, the more you will be able to enhance your job's performance (according to all rules discussed to avoid underutilization or overutilization). For the network switches, we recommend to use an equipment having a high throughput (such as 10 GB) Ethernet intra rack with N x 10 GB Ethernet inter rack.
Configuring your cluster correctly
To run Hadoop and get a maximum performance, it needs to be configured correctly. But the question is how to do that. Well, based on our experiences, we can say that there is not one single answer to this question. The experiences gave us a clear indication that the Hadoop framework should be adapted for the cluster it is running on and sometimes also to the job.
In order to configure your cluster correctly, we recommend running a Hadoop job(s) the first time with its default configuration to get a baseline (see Chapter 3, Detecting System Bottlenecks). Then, you will check the resource's weakness (if it exists) by analyzing the job history logfiles and report the results (measured time it took to run the jobs). After that, iteratively, you will tune your Hadoop configuration and re-run the job until you get the configuration that fits your business needs.
The number of mappers and reducer tasks that a job should use is important. Picking the right amount of tasks for a job can have a huge impact on Hadoop's performance.
The number of reducer tasks should be less than the number of mapper tasks. Google reports one reducer for 20 mappers; the others give different guidelines. This is because mapper tasks often process a lot of data, and the result of those tasks are passed to the reducer tasks. Often, a reducer task is just an aggregate function that processes a minor portion of the data compared to the mapper tasks. Also, the correct number of reducers must also be considered.
The number of mappers and reducers is related to the number of physical cores on the DataNode, which determines the maximum number of jobs that can run in parallel on DataNode.
In a Hadoop cluster, master nodes typically consist of machines where one machine is designed as a NameNode, and another as a JobTracker, while all other machines in the cluster are slave nodes that act as DataNodes and TaskTrackers. When starting the cluster, you begin starting the HDFS daemons on the master node and DataNode daemons on all data nodes machines. Then, you start the MapReduce daemons: JobTracker on the master node and the TaskTracker daemons on all slave nodes. The following diagram shows the Hadoop daemon's pseudo formula:
When configuring your cluster, you need to consider the CPU cores and memory resources that need to be allocated to these daemons. In a huge data context, it is recommended to reserve 2 CPU cores on each DataNode for the HDFS and MapReduce daemons. While in a small and medium data context, you can reserve only one CPU core on each DataNode.
Once you have determined the maximum mapper's slot numbers, you need to determine the reducer's maximum slot numbers. Based on our experience, there is a distribution between the Map and Reduce tasks on DataNodes that give good performance result to define the reducer's slot numbers the same as the mapper's slot numbers or at least equal to two-third mapper slots.
Let's learn to correctly configure the number of mappers and reducers and assume the following cluster examples:
|
Cluster machine |
Nb |
Medium data size |
Large data size |
|
DataNode CPU cores |
8 |
Reserve 1 CPU core |
Reserve 2 CPU cores |
|
DataNode TaskTracker daemon |
1 |
1 |
1 |
|
DataNode HDFS daemon |
1 |
1 |
1 |
|
Data block size |
128 MB |
256 MB |
|
|
DataNode CPU % utilization |
95% to 120% |
95% to 150% |
|
|
Cluster nodes |
20 |
40 |
|
|
Replication factor |
2 |
3 |
We want to use the CPU resources at least 95 percent, and due to Hyper-Threading, one CPU core might process more than one job at a time, so we can set the Hyper-Threading factor range between 120 percent and 170 percent.
|
Maximum mapper's slot numbers on one node in a large data context |
= number of physical cores – reserved core * (0.95 -> 1.5) Reserved core = 1 for TaskTracker + 1 for HDFS |
|
Let's say the CPU on the node will use up to 120% (with Hyper-Threading): Maximum number of mapper slots = (8 – 2) * 1.2 = 7.2 rounded down to 7 |
|
|
Let's apply the 2/3 mappers / reducers technique: Maximum number of reducers slots = 7 * 2/3 = 5 |
|
|
Let's define the number of slots for the cluster: Mapper's slots: = 7 * 40 = 280 Reducer's slots: = 5 * 40 = 200 |
|
The block size (discussed in Chapter 2, An Overview of the Hadoop Parameters) is also used to enhance performance. The default Hadoop configuration uses 64 MB blocks, while we suggest using 128 MB in your configuration for a medium data context as well and 256 MB for a very large data context. This means that a mapper task can process one data block (for example, 128 MB) by only opening one block. In the default Hadoop configuration (set to 2 by default), two mapper tasks are needed to process the same amount of data. This may be considered as a drawback because initializing one more mapper task and opening one more file takes more time.
Summary
In this chapter, we introduced some scenarios and techniques that may help you to identify your cluster's weakness. You learned how to check your Hadoop cluster node's health and how to identify a massive I/O traffic. Also, we talked about how to identify CPU contention using the vmstat Linux tool.
Then we learned some formulas that you need to use in order to size your Hadoop cluster correctly. Also, in the last section, you learned how to configure the number of mappers and reducers correctly using a new, dedicated formula.
In the next chapter, you will learn more about profiling map and reduce tasks, and will dive more deeply in to the universe of Hadoop map and reduce tasks.
All materials on the site are licensed Creative Commons Attribution-Sharealike 3.0 Unported CC BY-SA 3.0 & GNU Free Documentation License (GFDL)
If you are the copyright holder of any material contained on our site and intend to remove it, please contact our site administrator for approval.
© 2016-2026 All site design rights belong to S.Y.A.