HDInsight Essentials, Second Edition (2015)
Chapter 7. Analyze and Report from Data Lake
The real value of big data is when data becomes information that decision makers can take action with. In this chapter, we will review how to access data from Data Lake for analysis and reporting. The topics covered in this chapter are as follows:
· Data access overview
· Analysis using Excel and Microsoft Hive ODBC Driver
· Analysis using Excel Power Query
· Other business intelligence features in Excel
· Hive for ad hoc queries
· Other alternatives for analysis
Data access overview
Once we have data in a normalized and aggregated form, business analysts can run pivot tables and what-if analysis, and data scientists can run statistical analysis to present insights to executive management empowering them to make business decisions. This process of democratizing the Data Lake is also termed Data access.
For our airline on-time performance project in this chapter, we will analyze the aggregated and cleansed data that was performed in the previous chapter. The following figure shows the flow of data from Ingest to Report:

In the next few sections, we will see how to use Excel and other tools to perform analysis.
Analysis using Excel and Microsoft Hive ODBC driver
Excel is the most popular data analysis tool used by business analysts and now HDInsight makes it easy to integrate Excel with Hadoop using Hive. In this section, we will see how to use Excel against the data that is in our Data Lake using Hive.
Prerequisites
The prerequisites required are listed as follows:
· Office 2013 Professional Plus, Office 365 Pro Plus, Excel 2013 Standalone, or Office 2010 Professional plus
· Operating systems that are supported are Windows 7, Windows 8, Windows Server 2008 R2, or Windows Server 2012
The following are the steps to get your data into Excel and analyze it.
Step 1 – installing the Microsoft Hive ODBC driver
The first step is to download the Hive ODBC driver and set it up. Download the Hive ODBC driver from Microsoft Download Center based on your office version (2013 or 2010); the link for 2013 is http://www.microsoft.com/en-us/download/details.aspx?id=40886.
Once you download the driver MSI file to your local machine, double-click on it to install the driver. At the end of the installation, you will get a success confirmation message.
Note
There are two versions of the installation package: 32 bit or 64 bit. You should install the version that matches your office installation.
Step 2 – creating Hive ODBC Data Source
The next step is to configure Hive ODBC Data Source. Perform the following steps to create your Hive OBDC Data Source:
1. Navigate to Start | Control Panel.
2. Then, navigate to System and Security | Administration tools.
3. Next, click on ODBC Data Sources and select the user DSN.
4. Then, click on Add; this will enable you to add a new data source. Select Microsoft Hive ODBC Driver and click on Finish.
5. You will now see a Microsoft Hive ODBC Driver DSN Setup pop up. You will need to enter the following information:
· Data Source Name: Provide a name such as hdindhive.
· Description: Provide a description.
· Host: Provide a complete cluster name such as hdind.azurehdinsight.net for the Azure HDInsight service.
· Port: Use default 443. This is the port of the thrift server.
· Hive Server Type: Select Hive Server 2.
· Mechanism: Select Windows Azure HDInsight Service.
· User Name and Password: Enter the HDInsight cluster username and password.
The following screenshot shows a new Microsoft Hive ODBC Driver DSN configuration:
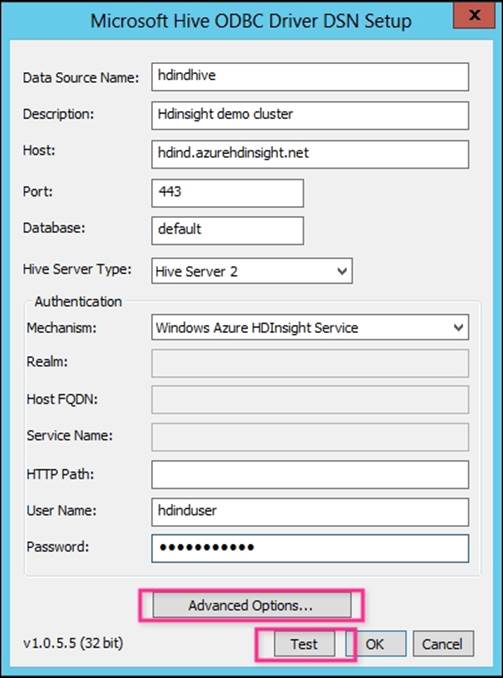
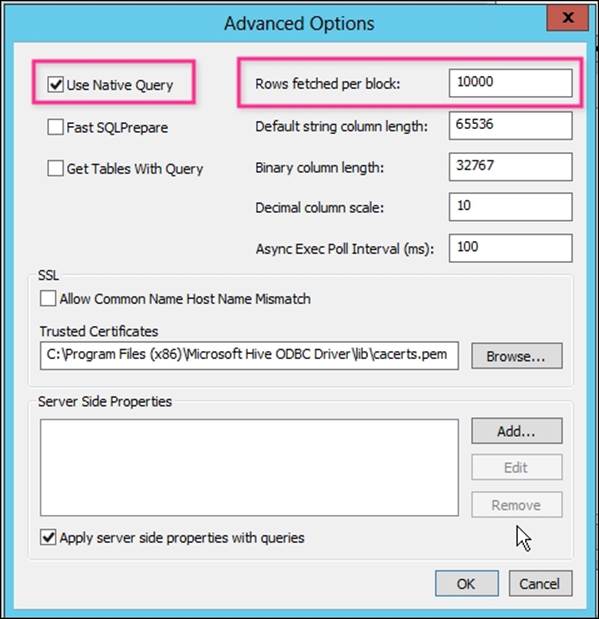
6. Next, click on the Advanced Options… tab to confirm certain parameters that impact the performance:
· Use Native Query: Enable this if you are going to use HiveQL only
· Rows fetched per block: When fetching large amounts of data, this parameter will help you optimize the performance
The following screenshot shows you the advanced options that are worth looking into for the Microsoft Hive ODBC Driver DSN configuration:
7. Next, click on OK and you will be back to the first tab of the ODBC configuration. Click on the Test button and verify the connection. You should receive a success message to proceed to the next step.
Step 3 – importing data to Excel
Once you have the new Hive data source set up, you can use Excel to analyze and visualize your data by performing the following steps:
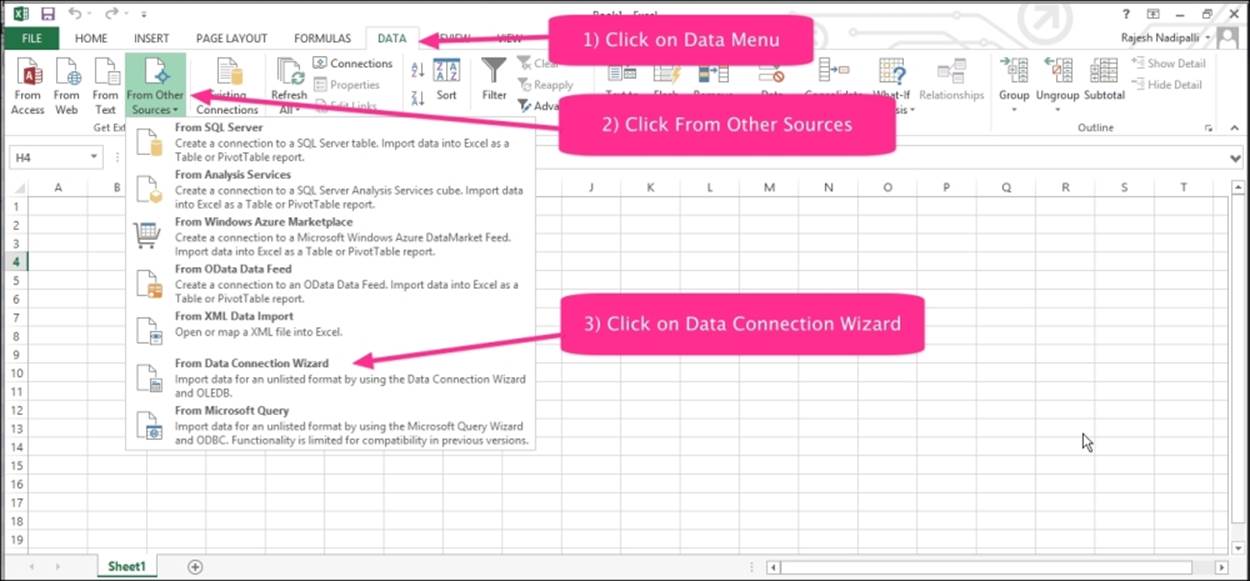
1. Open a new Excel workbook and click on the DATA tab.
2. Click on From Other Sources.
3. Then, click on From Data Connection Wizard.
The following screenshot illustrates these steps:
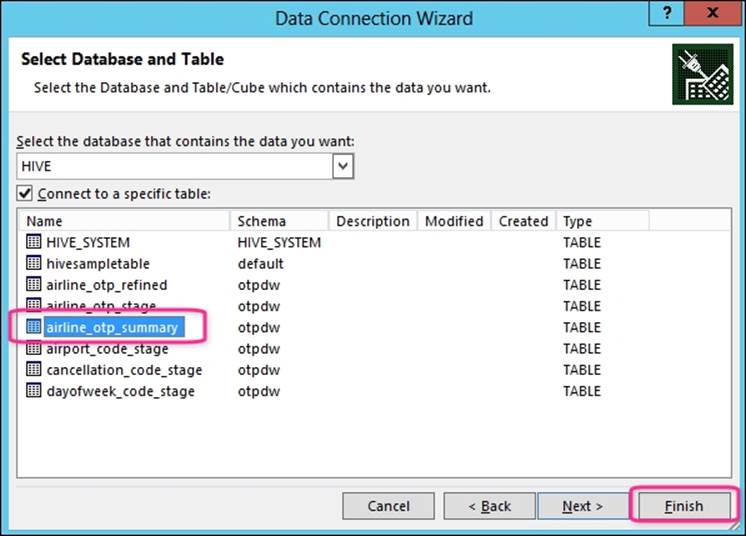
4. Next, the wizard will ask you which remote data source you want to connect to; select ODBC DSN. The next pop up should show you Microsoft Hive ODBC Data Source that you have just created, hdindhive. Continue with the default options till you see theSelect Database and Table pop up. In this pop up, select airline_otp_summary and click on the Finish button, as shown in the following screenshot:
5. Next, you will see an Import Data dialog box; here you can change the actual query by clicking on the Connection Properties. If you suspect the data volume to be high, it is recommended that you use a limit clause to prevent your laptop from freezing. The following screenshot shows this pop up:
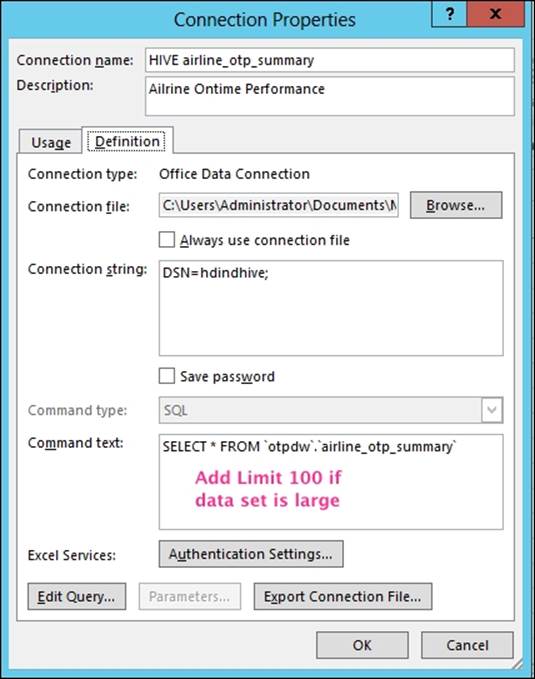
Note
If you are editing the query, do verify the generated SQL. Excel, by default, will construct queries with table references such as `HIVE`.`otpdw`.`airline_otp_summary` which you will need to edit and remove the HIVE prefix to `otpdw`.`airline_otp_summary`.
6. Next, you have a choice to import the data as a simple table, PivotTable, or a PivotChart. Select PivotChart, and select the flightyear and flightmonth as rows, airlinecarrier as columns, and averagedepdelay as values. With a few clicks, you can quickly get a useful chart that shows you how each airline carrier performs using the average arrival delay as a measure and you can also compare it against its peers. Take a look at the following screenshot:
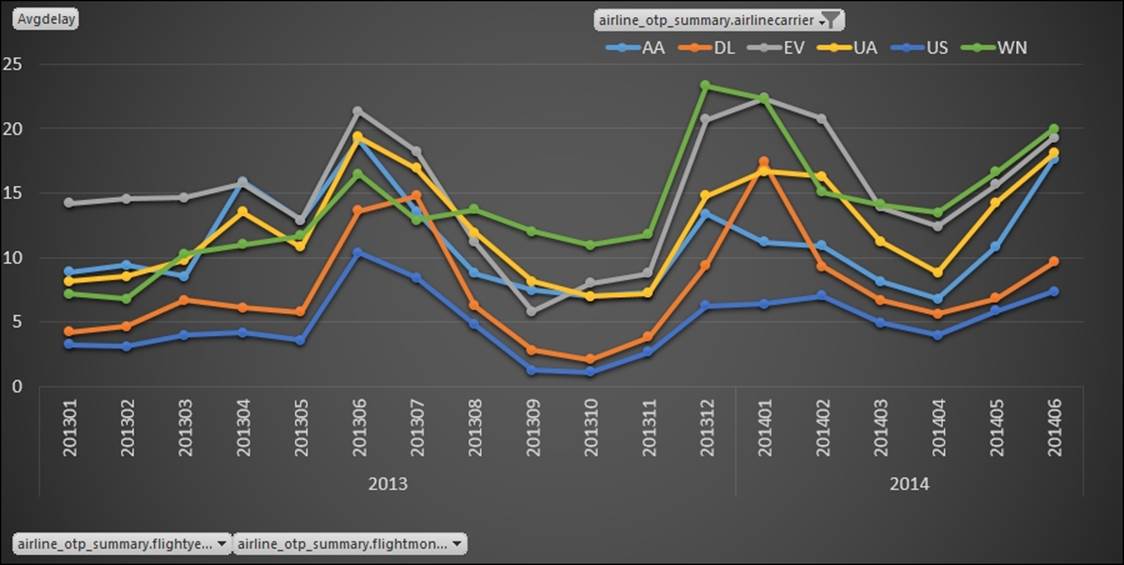
Let's take a moment to look at the chart and understand its key insights:
· Peak travel seasons in June and December are worst in delays
· US Airways (abbreviated US) is consistently better than other leading carriers
· Southwest (WN) and ExpressJet (EV) are the worst performing carriers
Let's understand how this works:
1. Microsoft Hive ODBC driver executes the HiveQL on the HDInsight cluster.
2. Hive converts this to a MapReduce job as per the query.
3. Results from the query are sent to the client PC where Excel is running.
4. Further, all analysis/charts will use data that is already imported to Excel.
Analysis using Excel Power Query
A key strategy of Microsoft's big data solution is the integration of Business Intelligence (BI) components with HDInsight. This is seen with the integration of Microsoft Power Query of Excel with data stored in the HDInsight cluster.
Let's take our airline on-time performance project; the summary analysis showed us that the flight from carrier EV in the month of June has high delays. If we want to get into further details, we can use Power Query in Excel to filter and search for the top flights delayed for that airline in that month.
Prerequisites
The prerequisites are as follows:
· Office 2013 Professional Plus, Office 365 Pro Plus, Excel 2013 Standalone, or Office 2010 Professional plus
· Operating systems that are supported are Windows 7, Windows 8, Windows Server 2008 R2, Windows Server 2012, Windows Vista (requires .NET 3.5 SP1), Windows Server 2008 (requires .NET 3.5 SP1), or Windows 8.1
Step 1 – installing the Microsoft Power Query for Excel
The first step is to download the Excel add-in from http://www.microsoft.com/en-us/download/details.aspx?id=39379.
Once you download the driver MSI file to your local machine, double-click on it to install the add-in.
Note
There are two versions of the installation package: 32 bit or 64 bit. You should install the version that matches your office installation.
Step 2 – importing Azure Blob storage data into Excel
To import data from an HDInsight cluster in Excel, you can import data associated with the cluster by performing the following steps:
1. Open Excel and create a new blank workbook.
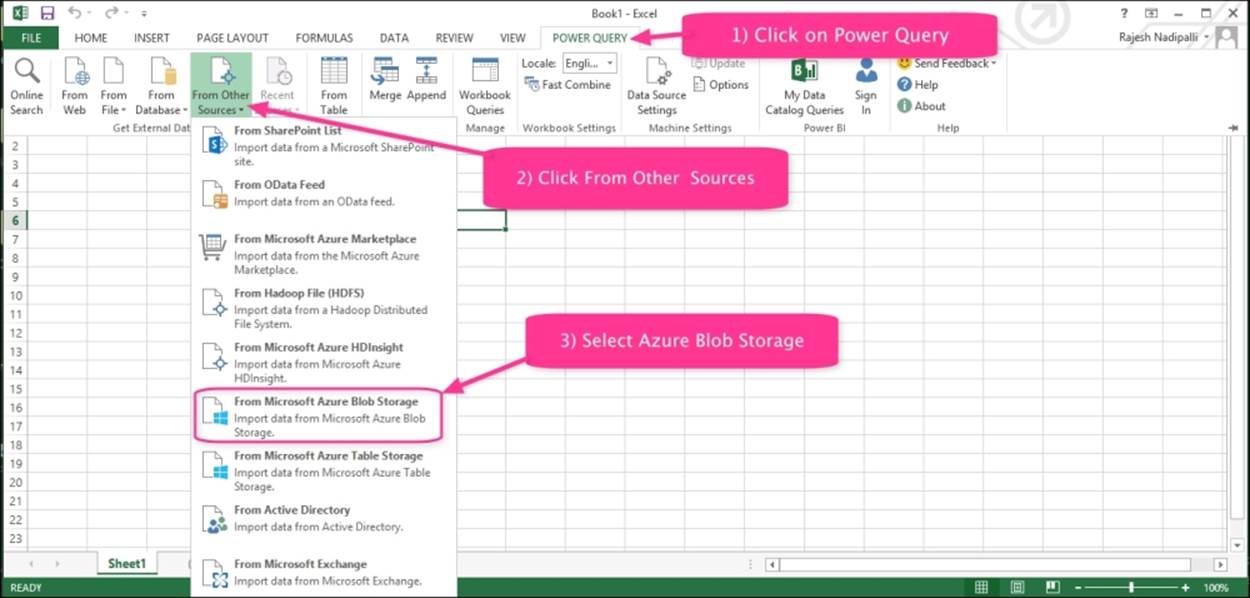
2. Navigate to the new add-in POWER QUERY | From Other Sources | From Microsoft Azure Blob Storage, as shown in the following screenshot:
3. This will next prompt you for the Azure Blob Storage account name and account key associated with your HDInsight cluster. In our demo, it is hdindstorage.
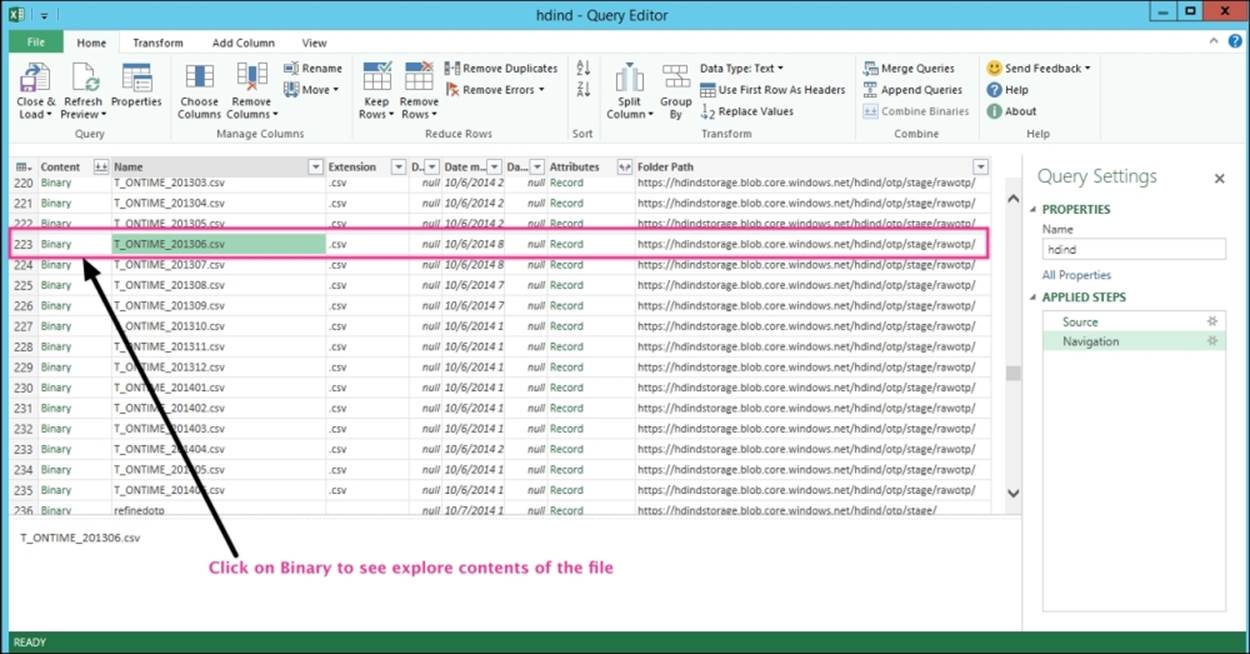
4. Now, you will see the containers inside the Blob storage and the individual files. In our case, we are looking for the on-time performance file for the month of June 2013. Locate the file and then click on the Binary link on the left-hand side, as shown in the following screenshot. This allows us to search, sort, and apply Excel functions to this dataset.
Step 3 – analyzing data using Excel
To analyze the data, filter the records where the airline carrier (Column 7) is EV and then sort it by the arrival delay (Column 23) descending.
This now give us a list of flights that were delayed significantly and caused the average arrival delay for flights from the EV carrier. Take a look at the following screenshot:
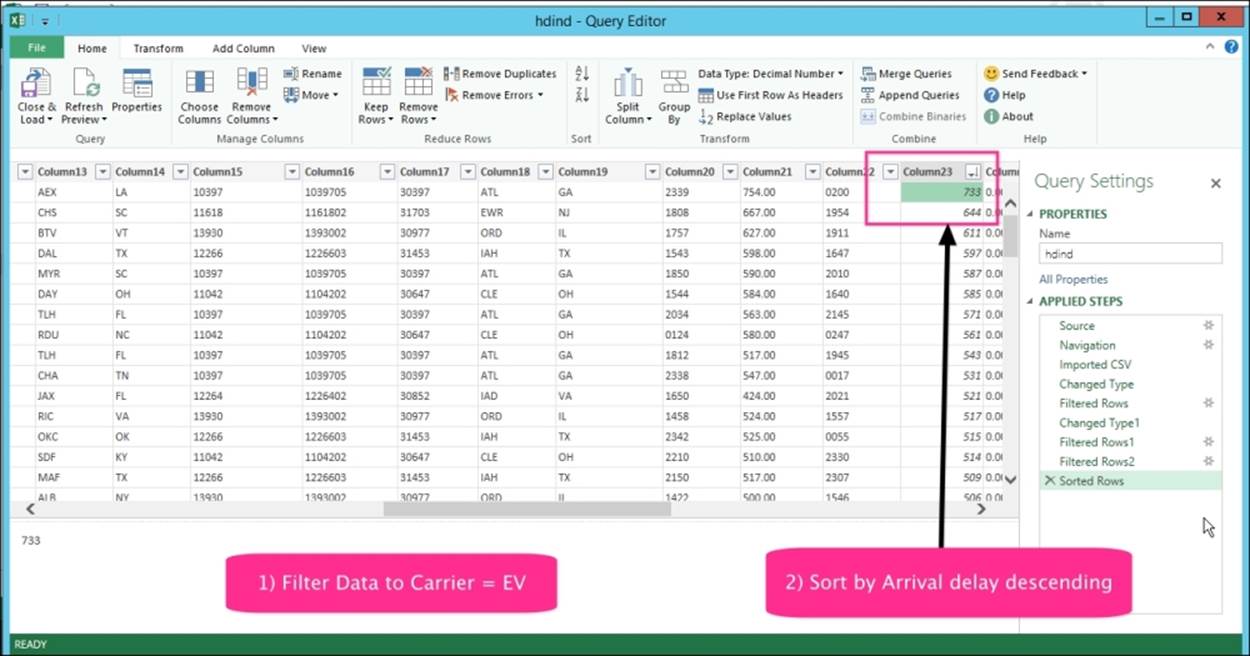
The data shows you certain flights that had over a 10-hour delay (over 600 minutes in Column 23). These outliers caused the average for this airline to go higher.
Let's understand how this works:
1. Microsoft Power Query plugin connects to Azure Blob storage.
2. Power Query plugin buffers a certain number of rows in Excel based on user criteria.
3. Results from the query are sent to the client PC where Excel is running.
4. Further, all analysis/charts will use data that is already imported to Excel.
5. This approach eliminates the need for a Hive table and directly reads from Azure Blob storage.
Other BI features in Excel
Excel has several other features and add-ins that make it a great tool for business intelligence. The following features are worth exploring for your analytics use cases.
Note
For the features that are discussed in the following section, you might need to install additional software on top of Excel.
PowerPivot
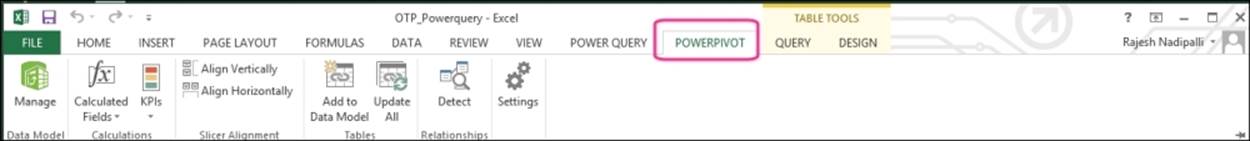
The PowerPivot allows you to build a data model, calculate key performance indicators (KPI), detect relationships, and visualize using charts or tables. The following screenshot shows you the POWERPIVOT menu:
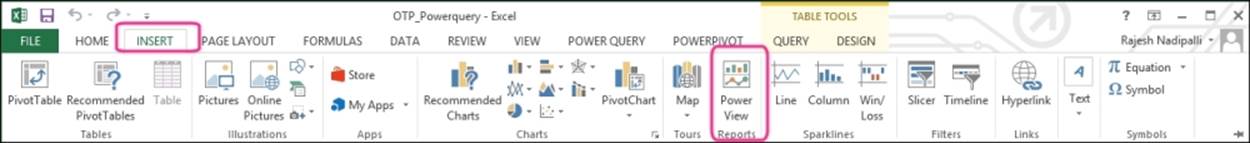
Power View and Power Map
Power View reports allow a host of new visualizations of your KPIs, including a Map view where you can geographically report your results. This feature is under the INSERT | Power View Reports submenu, as shown in the following screenshot:
If your data has geographical information such as state, city, or latitude and longitude, you can visualize this information easily by a few clicks in Excel. Let's consider our sample project with airline on-time performance data for which the origin city code is a good candidate for the location and departure delay as a metric to visualize. To visualize this using Power Map, perform the steps mentioned in the following sections.
Step 1 – importing Azure Blob storage data into Excel
First, you can import Azure Blob Storage data into Excel, as described in the Analysis using Excel Power Query section.
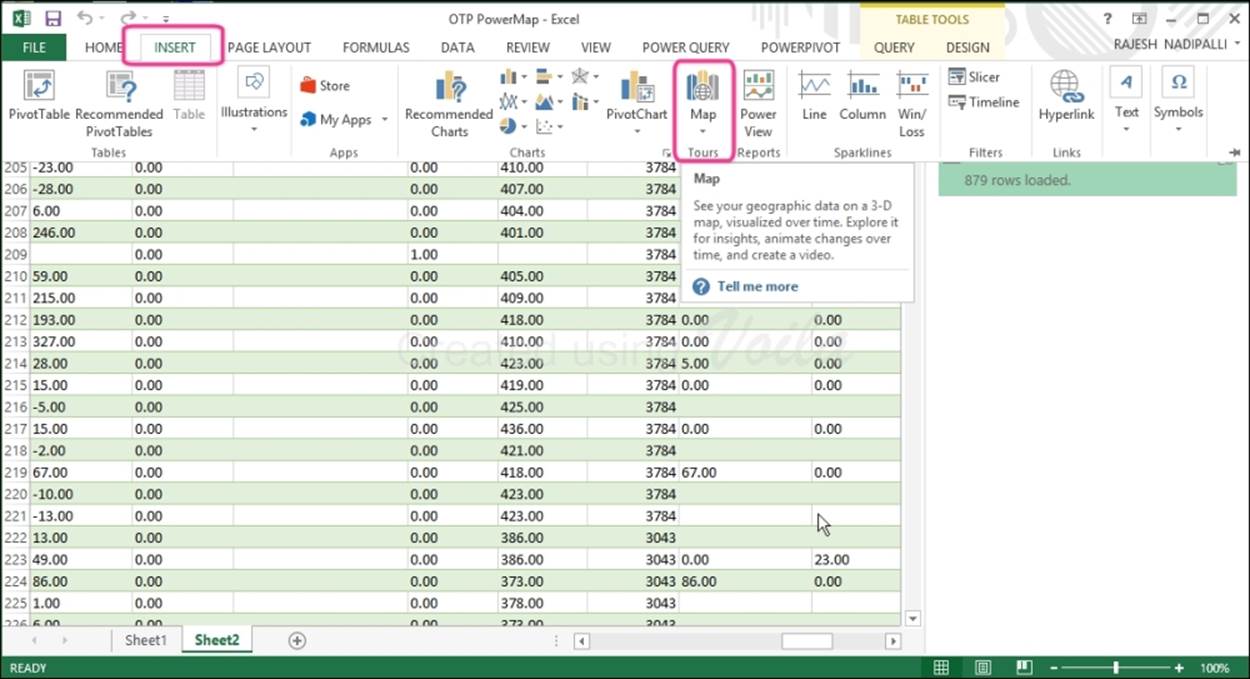
Step 2 – launch map view
Next, click on the INSERT tab, click on Map icon, and then launch Power Map, as shown in the following screenshot. Power Map uses Bing to geocode the data based on its geographic properties.
Step 3 – configure the map
Next, you will see the Power Map and the first screen of Layer Pane with the properties seen on the right-hand side. Let's change the GEOGRAPHY option to the Origin column and the Departure delay column as the metric to be displayed as a circle. Next, Power Map will plot the data and circles will appear on the map, as shown in the following screenshot. The size of the circle represents the number of flights from the city and the color represents the departure delay.
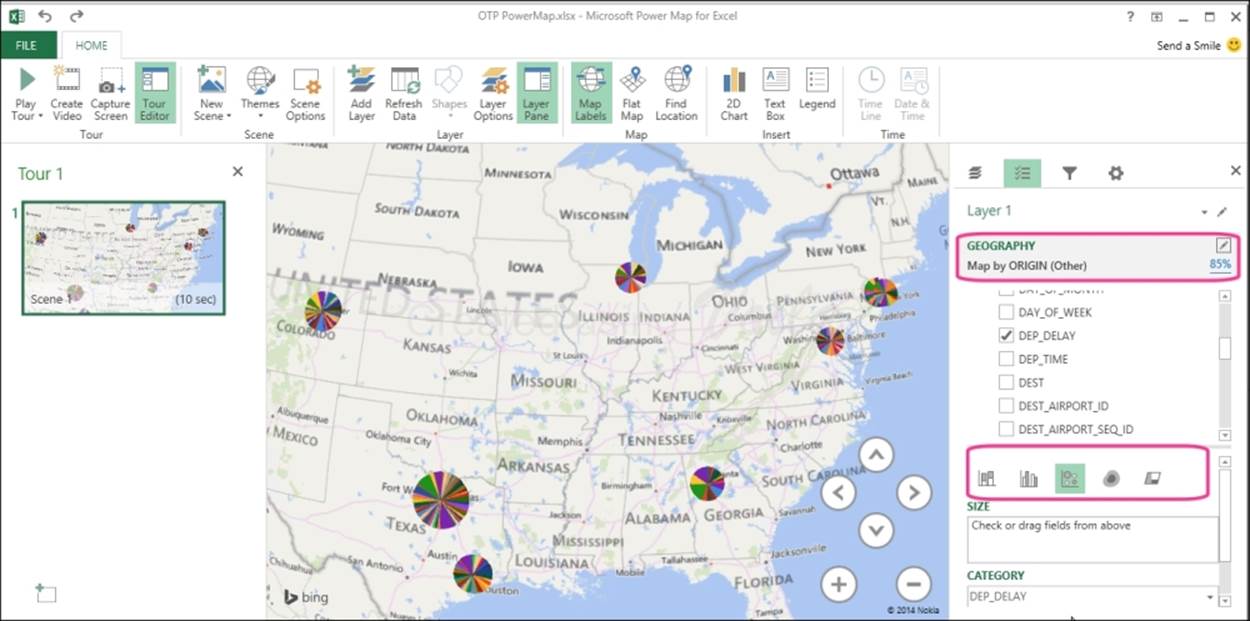
This approach can be used to visualize your data in geographic space and you can also see it change by time to gain new understandings.
Power BI Catalog
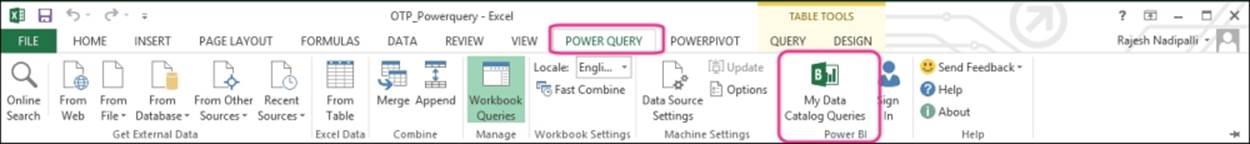
With Power BI Catalog feature, you can publish and share results with your coworkers in your organization. Additionally, you can clean, transform, and merge data from multiple sources.
Power BI Catalog is accessible under POWER QUERY | My Data Catalog Queries, as shown in the following screenshot:
For further information, refer to http://www.microsoft.com/en-us/powerBI/home/discover.aspx.
Ad hoc analysis using Hive
Historically, Hive was considered a good abstraction over MapReduce and for data extraction in batch mode. Hive was not considered as a good alternative for low latency queries; however, this is changing as you read this book. With Hive Version 13, you can run Hive over Apache Tez, which is faster and more efficient than the traditional MapReduce. This allows business users to explore and interact with data in HDInsight using BI tools such as Excel.
Other alternatives for analysis
The Hadoop ecosystem has several other specialized tools and projects for data analysis that might be applicable for your use case. I'll mention a few popular open source tools to be considered.
RHadoop
R is a language created for statisticians and has over 2 million users. RHadoop is a set of R packages that run on Hadoop, which are as follows:
· rmr package provides interface to MapReduce using R code
· rhdfs package provides interface to HDFS with R
· rhbase package is required if HBase is used
· plyrmr package has common data manipulation functions
· ravro package allows reading and writing to files in an avro format
With RHadoop, data scientists can explore the Data Lake, perform regression analysis to predict the future, identify customer segments and relationships to understand customer behavior, detect outliers for fraud detection, and perform other time series data mining.
Here are some useful links to get further details on RHadoop:
· https://github.com/RevolutionAnalytics/RHadoop/wiki
· http://www.rstudio.com/products/rstudio/
Apache Giraph
Apache Giraph allows graph processing using HDInsight cluster for large-scale graph analysis. Graphs model relationships between entities such as people, place, job, sale, and date. Graph processing allows you to understand the strength of these relations and has several use cases, which are as follows:
· Recommendations to a tourist on the shortest route between two cities by avoiding busy intersections
· Song recommendations based on users and their friends' history
· In our airline on-time performance project, the shortest route between two cities with less than two stops and 90 percent on-time performance.
For further information on how Facebook analyzed a trillion edges using Giraph, you can refer to https://www.facebook.com/notes/facebook-engineering/scaling-apache-giraph-to-a-trillion-edges/10151617006153920.
Apache Mahout
Apache Mahout is a library of scalable machine learning algorithms implemented on top of Apache Hadoop and enables machines to learn without being explicitly programmed. Common use cases for Apache Mahout are as follows:
· Collaborative filtering: This algorithm mines user behaviors such as ratings, clicks, and purchases to provide recommendations to other users. Sites such as Amazon and Netflix use this approach.
· Clustering: This algorithm is used to group similar items together. For example, if a certain news article is trending, this algorithm can group news articles from public sources in one place to allow you to get a well-rounded review.
· Categorization: This algorithm is also referred to as classification. As documents are ingested to Data Lake, they are first tagged with one/more labels. Next, this algorithm can check the unclassified documents and tag them to the best category.
· Frequent itemset: This algorithm is used to analyze product placement and market basket analysis, for example, retailers realize that beer and diapers are generally purchased together so placing them close to each other helps their end customers.
The following are some reference links for Mahout:
· http://blogs.technet.com/b/oliviaklose/archive/2014/04/14/mahout-for-dummies-2-step-by-step-mahout-and-hdinsight-interactive-style.aspx
· http://hortonworks.com/hadoop/mahout/
Azure Machine Learning
Azure Machine Learning (ML) is an exciting addition to Azure's growing list of valuable cloud services and provides predictive analytics without the need of complex software and high-end computers.
Azure ML is very simple to use and does not require seasoned data scientists to mine data. Users can model using ML studio, which is launched using a web browser, and has a simple drag-and-drop designer. ML studio comes with a library of sample experiments using which you can create new experiments on your data stored in HDInsight.
Azure ML also allows data scientists to drop the existing R code directly into your workspace or author it directly in ML studio.
For further details on this preview feature, visit this website at http://azure.microsoft.com/en-us/services/machine-learning/.
Summary
For any big data project to be successful, the key is to gain actionable information from the vast amount of data collected in the Data Lake. The familiar Microsoft Excel has several add-ins that make it a powerful business intelligence tool that allows one to model, analyze, report, and publish rich and interactive reports. PowerPivot, Power Query, Power BI, and Power Map work with data in HDInsight and other SQL stores.
Hadoop ecosystem has several additional tools such as RHadoop, Apache Giraph, and Apache Mahout. These allow data scientists and statisticians to detect patterns, predict future trends, and perform data mining.
In the next chapter, we will see some of the preview and new features of HDInsight that further enhance the Data Lake capabilities.
All materials on the site are licensed Creative Commons Attribution-Sharealike 3.0 Unported CC BY-SA 3.0 & GNU Free Documentation License (GFDL)
If you are the copyright holder of any material contained on our site and intend to remove it, please contact our site administrator for approval.
© 2016-2026 All site design rights belong to S.Y.A.