High Performance MySQL (2012)
Chapter 16. Tools for MySQL Users
The MySQL server distribution doesn’t include tools for many common tasks, such as monitoring the server or comparing data between servers. Fortunately, Oracle’s commercial offerings extend these tools, and MySQL’s active open source community and third-party companies also provide a wide variety of tools, reducing the need to roll your own.
Interface Tools
Interface tools help you run queries, create tables and users, and perform other routine tasks. This section gives a brief description of some of the most popular tools for these purposes. You can generally do all or most of the jobs they’re used for with SQL queries or commands—the tools we discuss here just add convenience, help you avoid mistakes, and speed up your work:
MySQL Workbench
MySQL Workbench is an all-in-one tool for tasks such as managing your server, writing queries, developing stored procedures, and working with schema diagrams. It features a plugin interface that lets you write your own tools and integrate them into the workbench, and there are Python scripts and libraries that use this plugin interface. MySQL Workbench is available in both community and commercial editions, with the commercial editions adding in some more advanced features. The free version is more than adequate for most needs, though. You can learn more athttp://www.mysql.com/products/workbench/.
SQLyog
SQLyog is one of the most popular visual tools for MySQL, with many nice features. It’s in the same class as MySQL Workbench, but both tools have some checkboxes in their feature matrices that the other doesn’t have. It is available only for Microsoft Windows, in a full-featured edition for a price and in a limited-functionality edition for free. More information about SQLyog is available at http://www.webyog.com.
phpMyAdmin
phpMyAdmin is a popular administration tool that runs on a web server and gives you a browser-based interface to your MySQL servers. Although browser-based access is nice sometimes, phpMyAdmin is a large and complex tool, and it has been accused of having a lot of security problems. Be extremely careful with it. We recommend not installing it anywhere that’s accessible from the Internet. More information is available at http://sourceforge.net/projects/phpmyadmin/.
Adminer
Adminer is a lightweight, secure browser-based administration tool that’s in the same category as phpMyAdmin. The developer positions it as a better replacement for phpMyAdmin. Although it does seem to be more secure, we still recommend being cautious about installing it in any publicly accessible place. More information is available at http://www.adminer.org.
Command-Line Utilities
MySQL comes with some command-line utilities, such as mysqladmin and mysqlcheck. These are listed and documented in the MySQL manual. The MySQL community has also created a wide range of high-quality toolkits with good documentation to supplement these utilities:
Percona Toolkit
Percona Toolkit is the must-have toolkit for MySQL administrators. It is the successor to Baron’s earlier toolkits, Maatkit and Aspersa, which many people regarded as mandatory for anyone running a serious MySQL deployment. It includes many tools for purposes such as log analysis, replication integrity checking, data synchronization, schema and indexing analysis, query advice, and data archiving. If you’re just getting started with MySQL, we suggest that you learn these essential tools first: pt-mysql-summary, pt-table-checksum, pt-table-sync, and pt-query-digest. More information is available at http://www.percona.com/software/.
Maatkit and Aspersa
These two toolkits have been around since 2006 in one form or another, and both came to be widely regarded as essential for MySQL users. They have now been merged into Percona Toolkit.
The openark kit
Shlomi Noach’s openark kit (http://code.openark.org/forge/openark-kit) contains Python scripts that you can use for a wide variety of administrative tasks.
MySQL Workbench utilities
Some of the MySQL Workbench utilities are usable as standalone Python scripts. They are available from https://launchpad.net/mysql-utilities.
In addition to these tools, there are a variety of others that are less formally packaged and maintained. Many of the prominent MySQL community members have contributed tools at one time or another, mostly hosted on their own websites or on the MySQL Forge (http://forge.mysql.com). You can find a great deal of information by watching the Planet MySQL blog aggregator over time (http://planet.mysql.com), but unfortunately there is no single central directory for these tools.
SQL Utilities
There are a variety of free add-ons and utilities you can use from within the server itself; some of them are quite powerful indeed:
common_schema
Shlomi Noach’s common_schema project (http://code.openark.org/forge/common_schema) is a powerful set of routines and views for server scripting and administration. The common_schema is to MySQL as jQuery is to JavaScript.
mysql-sr-lib
Giuseppe Maxia created a library of stored routines for MySQL, which you can find at http://www.nongnu.org/mysql-sr-lib/.
UDF repository for MySQL
Roland Bouman has curated a collection of user-defined functions for MySQL, which is available at http://www.mysqludf.org.
MySQL Forge
At the MySQL Forge (http://forge.mysql.com), you’ll find hundreds of community-contributed programs, scripts, snippets, utilities, and tips and tricks.
Monitoring Tools
In our experience, most MySQL shops primarily need two kinds of monitoring: tools for health monitoring—detecting and alerting when something goes wrong—and recording metrics for trending, diagnosis, troubleshooting, capacity planning, and so on. Most systems are good at only one of these tasks, and can’t do a good job of both. Unfortunately, there are dozens of tools to choose from, making it a very time-intensive process to evaluate the offerings and decide whether a specific one suits you well.
Most monitoring systems are not designed specifically to monitor MySQL servers. Instead, they are general-purpose systems designed to periodically check the status of many kinds of resources, from machines to routers to software (such as MySQL). They usually have some kind of plugin architecture and often come with plugins for MySQL.
You generally install a monitoring system on its own server and use it to monitor other servers. If you’re using it to monitor important systems, it will quickly become a critical part of your infrastructure, so you might need to take extra steps, such as making the monitoring system itself redundant with failover.
Open Source Monitoring Tools
The following are some of the most popular open source all-in-one monitoring systems:
Nagios
Nagios (http://www.nagios.org) is probably the most popular open source problem detection and alerting system. It periodically checks services you define and compares the results to default or explicit thresholds. If the results are outside the limits, Nagios can execute a program and/or alert someone to the trouble. Nagios’s contact and alert system lets you escalate alerts to different contacts, change alerts or send them to different places depending on the time of day and other conditions, and honor scheduled downtime. Nagios also understands dependencies between services, so it won’t bother you about a MySQL instance being down when it notices the server is unreachable because a router in the middle is down, or when it finds that the host server itself is down.
Nagios can run any executable file as a plugin, provided it accepts the right arguments and gives the right output. As a result, Nagios plugins exist in many languages, including the shell, Perl, Python, Ruby, and other scripting languages. And if you can’t find a plugin that does exactly what you need, it’s simple to create your own. A plugin just needs to accept standard arguments, exit with an appropriate status, and optionally print output for Nagios to capture.
Nagios has some serious shortcomings, though. Even after you’ve learned it well, it is hard to maintain. It also keeps its entire configuration in files, instead of a database. The files have a special syntax that is easy to get wrong, and they are labor-intensive to modify as your systems grow and evolve. Nagios is not very extensible; you can write monitoring plugins easily, but that’s about all you can do. Finally, its graphing, trending, and visualization capabilities are limited. Nagios can store some performance and other data in a MySQL server and generate graphs from it, but not as flexibly as some other systems. All of these problems are made worse by politics. Nagios has been forked at least twice due to the real or perceived difficulties of working with the code and people involved. The forks are named Opsview (http://www.opsview.com) and Icinga (http://www.icinga.org). Many people prefer these systems to Nagios.
There are several books devoted to Nagios; we like Wolfgang Barth’s Nagios System and Network Monitoring (No Starch Press).
Zabbix
Zabbix is a full-featured system for monitoring and metrics collection. For example, it stores all configuration and other data in a database, not in configuration files. It also stores more types of data than Nagios and can thus generate better trending and history reports. Its network graphing and visualization capabilities are superior to Nagios’s, and many people find it easier to configure, more flexible, and more scalable. See http://www.zabbix.com for more information.
Zenoss
Zenoss is written in Python and has a browser-based user interface that uses Ajax to make it faster and more productive. It can autodiscover resources on the network, and it folds monitoring, alerting, trending, graphing, and recording historical data into a unified tool. Zenoss uses SNMP to gather data from remote machines by default, but it can also use SSH, and it has support for Nagios plugins. More information is available at http://www.zenoss.com.
Hyperic HQ
Hyperic HQ is a Java-based monitoring system that is targeted more toward so-called enterprise monitoring than most of the other systems in its class. Like Zenoss, it can autodiscover resources and supports Nagios plugins, but its logical organization and architecture are different, and it is a little “bulkier.” More information can be found at http://www.hyperic.com.
OpenNMS
OpenNMS is written in Java and has an active developer community. It has the usual features, such as monitoring and alerting, but adds graphing and trending capabilities as well. Its goals are high performance and scalability, automation, and flexibility. Like Hyperic, it is intended for enterprise monitoring of large, critical systems. For more information, see http://www.opennms.org.
Groundwork Open Source
Groundwork Open Source combines Nagios and several other tools into one system with a portal interface. Perhaps the best way to describe it is as the system you might build in-house if you were an expert in Nagios, Cacti, and a host of other tools and had a lot of time to integrate them together. More information is available at http://www.groundworkopen source.com.
In addition to the all-in-one systems, there is a variety of software that’s focused on collecting metrics and letting you graph and visualize them, rather than performing health checks. Many of these are built on top of RRDTool (http://www.rrdtool.org), which stores time-series data in round-robin database (RRD) files. RRD files automatically aggregate incoming data, interpolate missing values in case the incoming values are not delivered when expected, and have powerful graphing tools that generate beautiful, distinctive graphs. Several RRDTool-based systems are available. Here are some of the most popular:
MRTG
The Multi Router Traffic Grapher, or MRTG (http://oss.oetiker.ch/mrtg/), is the quintessential RRDTool-based system. It is really designed for recording network traffic, but it can be extended to record and graph other things as well.
Cacti
Cacti (http://www.cacti.net) is probably the most popular RRDTool-based system. It is a PHP web interface to RRDTool. It uses a MySQL database to define the servers, plugins, graphs, and so on. It is template-driven, so you can define templates and then apply them to your systems. Baron wrote a very popular set of templates for MySQL and other systems; see http://code.google.com/p/mysql-cacti-templates/ for more information. These have been ported to Munin, OpenNMS, and Zabbix.
Ganglia
Ganglia (http://ganglia.sourceforge.net) is similar to Cacti, but it’s designed to monitor clusters and grids of systems, so you can view data from many servers in aggregate and drill down to the individual servers if you wish.
Munin
Munin (http://munin.projects.linpro.no) gathers data for you, puts it into RRDTool, and then generates graphs of the data at several levels of granularity. It creates static HTML files from the configuration, so you can browse them and view trends easily. It is easy to define a graph; you just create a plugin script whose command-line help output has some special syntaxes Munin recognizes as graphing instructions.
RRDTool-based systems have some limitations, such as the inability to query the stored data with a standard query language, the inability to keep data forever, problems with kinds of data that don’t fit into simple counters or gauges easily, the requirement to predefine metrics and graphs, and so on. Ideally, we’d like to have a system that can just accept any metrics you send to it, with no predefinition of what they are, and draw arbitrary plots of them afterward, again without needing to predefine them. Probably the closest we’ve seen to such a system is Graphite (http://graphite.wikidot.com).
These systems can all be used to gather, record, and graph data and report on MySQL systems, with various degrees of flexibility and for slightly different purposes. They all lack a really flexible means of alerting someone when something is wrong.
The main problem with most of the systems we’ve mentioned is that they were apparently designed by people who were frustrated that the existing systems didn’t quite meet their needs, so they wrote yet another system that doesn’t quite meet a lot of other people’s needs. Most of these systems have fundamental limitations, such as a strange internal data model that doesn’t work well in a lot of situations. It’s frustrating, but in many cases, using one of these systems is like trying to fit a round peg into a square hole.
Commercial Monitoring Systems
Although we know a lot of MySQL users who are most interested in using open source tools, we also know many who are perfectly happy to pay for proprietary software as well, if it gets the job done better and saves them time and hassle. Here are some of the available commercial options:
MySQL Enterprise Monitor
The MySQL Enterprise Monitor is included with a MySQL support subscription from Oracle. It combines features such as monitoring, metrics and graphing, advisory services, and query analysis into a single tool. It uses an agent on the servers to monitor their status counters (including key operating system metrics). It can capture queries in two ways: via MySQL Proxy, or by using the appropriate MySQL connectors, such as Connector/J for Java or MySQLi for PHP. Although it’s designed to monitor MySQL, it is extensible to some degree. Still, you will probably not find it adequate for monitoring every server and service in your infrastructure. More information is available at http://www.mysql.com/products/enterprise/monitor.html.
MONyog
MONyog (http://www.webyog.com) is an agentless browser-based monitoring system that runs on a desktop system. It starts an HTTP server, and you can point your browser at this server to use the system.
New Relic
New Relic (http://newrelic.com) is a hosted, software-as-a-service application performance management system that can analyze your entire application’s performance, from the application code (in Ruby, PHP, Java, and other languages) to the JavaScript running in the browser, the SQL calls you make to the database, and even the server’s disk space, CPU utilization, and other metrics.
Circonus
Circonus (https://circonus.com) is a hosted SaaS metrics and alerting system from OmniTI. An agent collects metrics from one or more servers and forwards them to Circonus, where you view them through a browser-based dashboard.
Monitis
Monitis (http://monitis.com) is another cloud-hosted SaaS monitoring system. It is designed to monitor “everything,” which means that it’s slightly generic. It has a free entry-level cousin, Monitor.us (http://mon.itor.us), which has a MySQL plugin, too.
Splunk
Splunk (http://www.splunk.com) is a log aggregator and search engine that can help you gain operational insight into all of the machine-generated data in your environment.
Pingdom
Pingdom (http://www.pingdom.com) monitors your website’s availability and performance from many locations in the world. There are many services like Pingdom, actually, and we don’t necessarily recommend any specific one, but we do recommend that you use some external monitoring service to alert you when your site is unavailable. Many of the services can do a lot more than just “pinging” or fetching a web page.
There are many other commercial monitoring tools—we could tick off a dozen or more from memory. One thing to be careful about with all monitoring systems is their impact on the server. Some tools are pretty intrusive because they’re designed by companies who have no practical experience with large, heavily loaded MySQL systems. For example, we have solved more than one emergency by disabling the monitoring system’s feature that executed SHOW TABLE STATUS in every database once per minute. (This command is extremely disruptive on large I/O-bound systems.) Tools that query some of the INFORMATION_SCHEMA tables too often can also tend to have negative impacts.
Command-Line Monitoring with Innotop
There are a few command line–based monitoring tools, most of which emulate the Unix top tool in some way. The most sophisticated and capable of these is innotop (http://code.google.com/p/innotop/), which we’ll explore in some detail. There are several others, though, such as mtop(http://mtop.sourceforge.net), mytop (http://jeremy.zawodny.com/mysql/mytop/), and some web-based clones of mytop.
Although mytop is the original top clone for MySQL, innotop can do everything it can do and much more, which is why we focus on innotop instead.
Baron Schwartz, one of this book’s authors, wrote innotop. It presents a real-time updating view of what’s happening in your server. Despite its name, it is not limited to monitoring InnoDB, but can monitor practically any aspect of MySQL. It lets you monitor multiple MySQL instances simultaneously, and it is very configurable and extensible.
Some of its features include:
§ A transaction list that displays current InnoDB transactions
§ A query list that shows currently running queries
§ A list of current locks and lock waits
§ Summaries of server status and variables to show the relative magnitudes of values
§ Modes to display information about InnoDB internals, such as its buffers, deadlocks, foreign key errors, I/O activity, row operations, semaphores, and more
§ Replication monitoring, with master and slave statuses displayed together
§ A mode to view arbitrary server variables
§ Server grouping to help you organize many servers easily
§ Noninteractive mode for use in command-line scripting
It’s easy to install innotop. You can either install it from your operating system’s package repository or download it from http://code.google.com/p/innotop/, unpack it, and run the standard make install routine:
perl Makefile.PL
make install
Once you’ve installed it, execute innotop at the command line, and it will walk you through the process of connecting to a MySQL instance. It can read your ~/.my.cnf option files, so you might not need to do anything but type your server’s hostname and press Enter a few times. Once connected, you’ll be in T (InnoDB Transaction) mode, and you should see a list of InnoDB transactions, as shown in Figure 16-1.
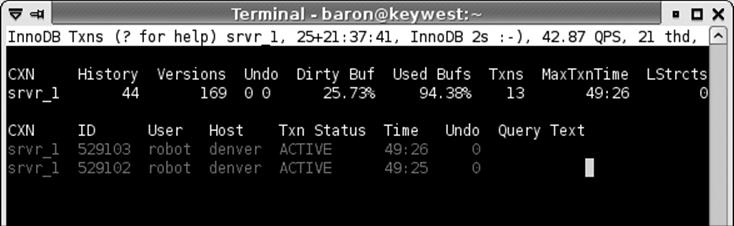
Figure 16-1. innotop in T (Transaction) mode
By default, innotop applies filters to reduce the clutter (as with everything in innotop, you can define your own or customize the built-in filters). In Figure 16-1, most of the transactions have been filtered out to show only active transactions. You can press the i key to disable the filter and fill the screen with as many transactions as will fit.
innotop displays a header and a main thread list in this mode. The header shows some overall InnoDB information, such as the length of the history list, the number of unpurged InnoDB transactions, the percentage of dirty buffers in the buffer pool, and so forth.
The first key you should press is the question mark (?), to see the help screen. This screen’s contents will vary depending on what mode innotop is in, but it always displays every active key, so you can see all possible actions. Figure 16-2 shows the help screen in T mode.
We won’t go through all of its other modes, but as you can see from the help screen, innotop has a lot of features.
The only other thing we cover here is some basic customization to show you how to monitor whatever you please. One of innotop’s strengths is its ability to interpret user-defined expressions, such as Uptime/Questions to derive a queries-per-second metric. It can display the result since the server was started and/or incrementally since the last sample.
This makes it easy to add your own columns to its tabular displays. For example, the Q (Query List) mode has a header that shows some overall server information. Let’s see how to modify it to monitor how full the key cache is. Start innotop and press Q to enter Q mode. The result will look like Figure 16-3.
The screenshot is truncated because we’re not interested in the query list for this exercise; we care only about the header.
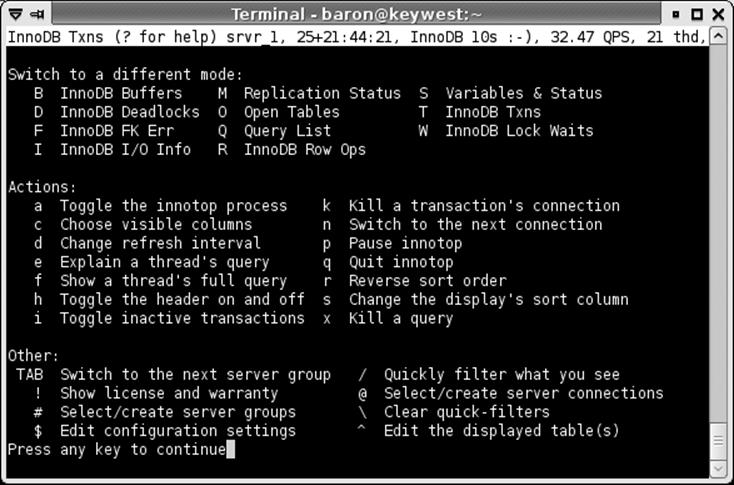
Figure 16-2. innotop help screen
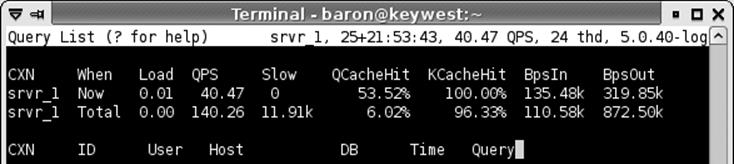
Figure 16-3. innotop in Q (Query List) mode
The header shows statistics for “Now” (which measures incremental activity since the last time innotop refreshed itself with new data from the server) and “Total” (which measures all activity since the MySQL server started, in this case 25 days ago). Each column in the header is derived from an equation involving values from SHOW STATUS and SHOW VARIABLES. The default headers shown in Figure 16-3 are built in, but it’s easy to add your own. All you have to do is add a column to the header “table.” Press the ^ key to start the table editor, then enter q_header at the prompt to edit the header table (Figure 16-4). Tab completion is built in, so you can just press q and then Tab to complete the word.
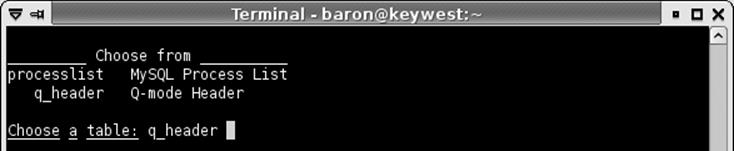
Figure 16-4. Adding a header (start)
After this, you’ll see the table definition for the Q mode header (Figure 16-5). The table definition shows the table’s columns. The first column is selected. We could move the selection around, reorder and edit the columns, and do several other things (press ? to see a full list), but we’re just going to create a new column. Press the n key and type the column name (Figure 16-6).
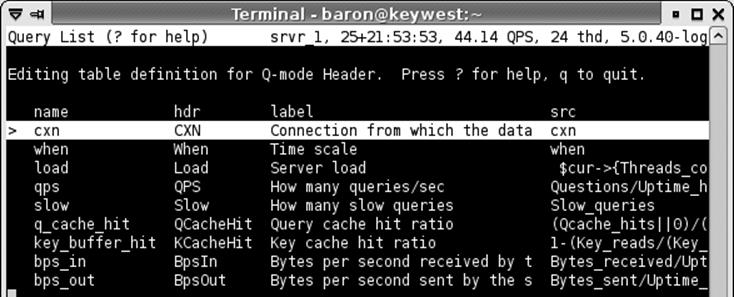
Figure 16-5. Adding a header (choices)
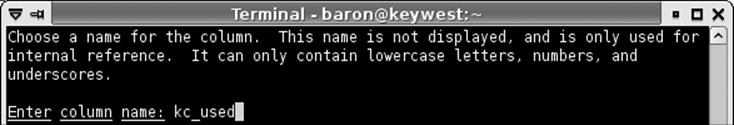
Figure 16-6. Adding a header (naming column)
Next, type the column’s header, which will appear at the top of the column (Figure 16-7). Finally, choose the column’s source. This is an expression that innotop compiles into a function internally. You can use names from SHOW VARIABLES and SHOW STATUS as though they’re variables in an equation. We use some parentheses and Perl-ish “or” defaults to prevent division by zero, but otherwise this equation is pretty straightforward. We also use an innotop transformation called percent() to format the resulting column as a percentage; check the innotop documentation for more on that. Figure 16-8 shows the expression.
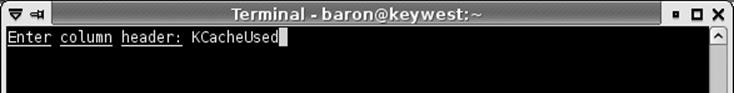
Figure 16-7. Adding a header (text for column)
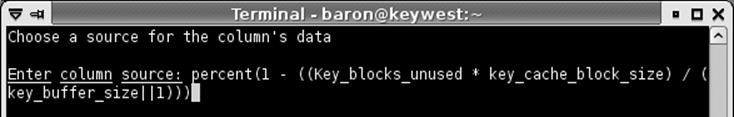
Figure 16-8. Adding a header (expression to calculate)
Press Enter, and you’ll see the table definition just as before, but with the new column added at the bottom. Press the + key a few times to move it up the list, next to the key_buffer_hit column, and then press q to exit the table editor. Voilà: your new column, nestled between KCacheHitand BpsIn (Figure 16-9). It’s easy to customize innotop to monitor what you want. You can even write plugins if it really can’t do what you need. There’s more documentation at http://code.google.com/p/innotop/.
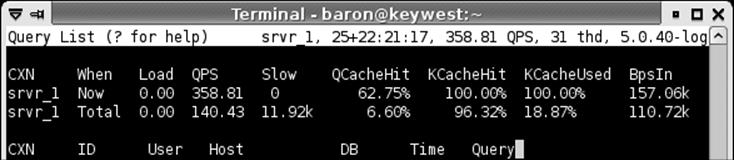
Figure 16-9. Adding a header (result)
Summary
Good tools are essential for administering MySQL. You’d be well advised to use some of the excellent tools that are already available, widely tested, and popular, such as Percona Toolkit (nee Maatkit). When we are introduced to new servers, practically the first thing we do is run pt-summary and pt-mysql-summary. If we’re working on a server, we’ll probably be watching it and any related servers in another terminal running innotop.
Monitoring tools are a more complicated topic, because they’re so central to the organization. If you’re an open source advocate and you want to use open source monitoring systems, you might try either the combination of Nagios and Cacti with Baron’s Cacti templates, or Zabbix if you don’t mind its complicated interface. If you want a commercial tool for monitoring MySQL, MySQL Enterprise Monitor is quite well done, and we know a lot of happy users. If you want something capable of monitoring your whole environment, and all of the software and hardware in it, you will need to do your own investigation—that is a bigger topic than we can tackle in this book.
All materials on the site are licensed Creative Commons Attribution-Sharealike 3.0 Unported CC BY-SA 3.0 & GNU Free Documentation License (GFDL)
If you are the copyright holder of any material contained on our site and intend to remove it, please contact our site administrator for approval.
© 2016-2026 All site design rights belong to S.Y.A.