High Performance MySQL (2012)
Chapter 2. Benchmarking MySQL
Benchmarking is an essential skill for MySQL novices and power users alike. A benchmark, simply put, is a workload designed to stress your system. The usual goal is to learn about the system’s behavior, but there are other worthwhile reasons for running benchmarks, such as reproducing a desired system state or burning in new hardware. In this chapter we’ll explore reasons, strategies, tactics, and tools for benchmarking MySQL and MySQL-based applications. We’ll focus especially on sysbench, because it’s an excellent tool for MySQL benchmarking.
Why Benchmark?
Why is benchmarking so important? It’s because benchmarking is uniquely convenient and effective for studying what happens when you give systems work to do. A benchmark can help you observe the system’s behavior under load, determine the system’s capacity, learn which changes are important, or see how your application performs with different data. Benchmarking lets you create fictional circumstances, beyond the real conditions you can observe. You can do these things and more with benchmarks:
§ Validate your assumptions about the system, and see whether your assumptions are realistic.
§ Reproduce a bad behavior you’re trying to eliminate in the system.
§ Measure how your application currently performs. If you don’t know how fast it currently runs, you can’t be sure any changes you make are helpful. You can also use historical benchmark results to diagnose problems you didn’t foresee.
§ Simulate a higher load than your production systems handle, to identify the scalability bottleneck that you’ll encounter first with growth.
§ Plan for growth. Benchmarks can help you estimate how much hardware, network capacity, and other resources you’ll need for your projected future load. This can help reduce risk during upgrades or major application changes.
§ Test your application’s ability to tolerate a changing environment. For example, you can find out how your application performs during a sporadic peak in concurrency or with a different configuration of servers, or you can see how it handles a different data distribution.
§ Test different hardware, software, and operating system configurations. Is RAID 5 or RAID 10 better for your system? How does random write performance change when you switch from ATA disks to SAN storage? Does the 2.4 Linux kernel scale better than the 2.6 series? Does a MySQL upgrade help performance? What about using a different storage engine for your data? You can answer these questions with special benchmarks.
§ Prove that your newly purchased hardware is correctly configured. We can’t count the number of times we’ve used benchmarks to burn in a new system and found misconfigurations or faulty hardware components. It’s a good idea not to put a new server into production without benchmarking it first, and never to take a hosting provider or hardware vendor’s word for what is installed and how fast it should perform. Testing is always a good idea, if possible.
You can also use benchmarks for other purposes, such as to create a unit test suite for your application, but we focus only on performance-related aspects here.
The problem with benchmarking is that it isn’t real. The workload you use to stress the system is usually very simple in comparison with real-life workloads. There’s a reason for that: real-life workloads are nondeterministic, varying, and too complex to understand readily. If you benchmarked your systems with real workloads, it would be harder to draw accurate conclusions from the benchmarks.
In what ways is a benchmark’s workload unrealistic? There are many artificial dimensions to a benchmark—the data size, the distribution of data and queries—but perhaps the most important is that a benchmark usually runs as fast as it possibly can, loading the system so heavily that it behaves badly. In many cases we would like to tell benchmark tools to run as fast as possible within certain tolerances, throttling themselves as necessary to maintain good performance. This would be especially helpful for determining the system’s maximum usable capacity. However, most benchmarking tools don’t support such complexity. It’s good to keep in mind that the tools limit the meaningfulness and usefulness of the results.
It’s tricky to use benchmarks for capacity planning, too. It is often unrealistic to extrapolate from benchmark results. For example, suppose you want to know how much business growth you will be able to support with your new database server. You benchmark the existing server, then benchmark the new server and find that it can perform 40 times as many transactions per second. But that doesn’t mean that your business will be able to grow 40-fold on the new server. By the time your revenue grows that much, the system will probably have more traffic, more users, more data, and more interconnections between related pieces of data. You should not expect any of those factors to grow only 40 times, especially the number of relationships. In addition, your application will almost certainly have changed by the time your revenue has grown by a factor of 40. You will have new features, some of which might impact the database far out of proportion to their apparent complexity. These changes in workload, data, relationships, and features are very hard to simulate, and their impacts are hard to guess.
As a result, we usually settle for approximations, with a goal of knowing whether there’s still a decent amount of spare capacity in the system. It is possible to do more realistic load testing (as distinct from benchmarking), but it requires a lot of care in creating the dataset and workload, and in the end it’s not really a benchmark. Benchmarks are simpler, more directly comparable to each other, and cheaper and easier to run. And despite their limitations, benchmarks are useful. You just need to be clear about what you’re doing and in what ways the outcome is meaningful.
Benchmarking Strategies
There are two primary benchmarking strategies: you can benchmark the application as a whole, or isolate MySQL. We call these two strategies full-stack and single-component benchmarking, respectively. There are several reasons to measure the application as a whole instead of just MySQL:
§ You’re testing the entire application, including the web server, the application code, the network, and the database. This is useful because you don’t care about MySQL’s performance in particular; you care about the whole application.
§ MySQL is not always the application bottleneck, and a full-stack benchmark can reveal this.
§ Only by testing the full application can you see how each part’s cache behaves.
§ Benchmarks are good only to the extent that they reflect your actual application’s behavior, which is hard to do when you’re testing only part of it.
On the other hand, application benchmarks can be hard to create and even harder to set up correctly. If you design the benchmark badly, you can end up making bad decisions, because the results don’t reflect reality.
Sometimes, however, you don’t really want to know about the entire application. You might just need a MySQL benchmark, at least initially. Such a benchmark is useful if:
§ You want to compare different schemas or queries.
§ You want to benchmark a specific problem you see in the application.
§ You want to avoid a long benchmark in favor of a shorter one that gives you a faster “cycle time” for making and measuring changes.
It’s also useful to benchmark MySQL when you can repeat your application’s queries against a real dataset. The data itself and the dataset’s size both need to be realistic. If possible, use a snapshot of actual production data.
Unfortunately, setting up a realistic benchmark can be complicated and time-consuming, and if you can get a copy of the production dataset, count yourself lucky. It might even be impossible—for example, you might be developing a new application that has few users and little data. If you want to know how it’ll perform when it grows very large, you’ll have no option but to simulate the larger application’s data and workload.
What to Measure
It’s best to identify your goals before you start benchmarking—indeed, before you even design your benchmarks. Your goals will determine the tools and techniques you’ll use to get accurate, meaningful results. Try to frame your goals as a questions, such as “Is this CPU better than that one?” or “Do the new indexes work better than the current ones?”
You sometimes need different approaches to measure different things. For example, latency and throughput might require different benchmarks.
Consider some of the following measurements and how they fit your goals:
Throughput
Throughput is defined as the number of transactions per unit of time. This is one of the all-time classics for benchmarking database applications. Standardized benchmarks such as TPC-C (see http://www.tpc.org) are widely quoted, and many database vendors work very hard to do well on them. These benchmarks measure online transaction processing (OLTP) throughput and are most suitable for interactive multiuser applications. The usual unit of measurement is transactions per second, although it is sometimes transactions per minute.
Response time or latency
This measures the total time a task requires. Depending on your application, you might need to measure time in micro- or milliseconds, seconds, or minutes. From this you can derive aggregate response times, such as average, maximum, minimum, and percentiles. Maximum response time is rarely a useful metric, because the longer the benchmark runs, the longer the maximum response time is likely to be. It’s also not at all repeatable, because it’s likely to vary widely between runs. For this reason, it’s common to use percentile response times instead. For example, if the 95th percentile response time is 5 milliseconds, you know that the task finishes in 5 milliseconds or less 95% of the time.
It’s usually helpful to graph the results of these benchmarks, either as lines (for example, the average and 95th percentile) or as a scatter plot so you can see how the results are distributed. These graphs help show how the benchmarks will behave in the long run. We will return to this point later in this chapter.
Concurrency
Concurrency is an important but frequently misused and misunderstood metric. For example, it’s popular to say how many users are browsing a website at the same time, usually measured by how many sessions there are.[11] However, HTTP is stateless and most users are simply reading what’s displayed in their browsers, so this doesn’t translate into concurrency on the web server. Likewise, concurrency on the web server doesn’t necessarily translate to the database server; the only thing it directly relates to is how much data your session storage mechanism must be able to handle. A more accurate measurement of concurrency on the web server is how many simultaneous requests are running at any given time.
You can measure concurrency at different places in the application, too. The higher concurrency on the web server might cause higher concurrency at the database level, but the language and toolset will influence this. Be sure that you don’t confuse open connections to the database server with concurrency. A well-designed application might have hundreds of connections open to the MySQL server, but only a fraction of these should be running queries at the same time. Thus, a website with “50,000 users at a time” might require only 10 or 15 simultaneously running queries on the MySQL server!
In other words, what you should really care about benchmarking is the working concurrency, or the number of threads or connections doing work simultaneously. Measure whether throughput drops or response times increase when the concurrency increases; if so, your application probably can’t handle spikes in load.
Concurrency is completely different from other metrics such as response time and throughput: it’s usually not an outcome, but rather a property of how you set up the benchmark. Instead of measuring the concurrency your application achieves, you will usually instruct the benchmark tool to generate various levels of concurrency, and then measure the application’s performance. However, you should measure concurrency at the database, too. When you tell sysbench to run with 32, 64, and 128 threads, check the database server during each run and record the value of theThreads_running status variable. In Chapter 11, you’ll see why this is useful for capacity planning.
Scalability
Scalability measurements are useful for systems that need to maintain performance under a changing workload. We’ll discuss scalability more formally in Chapter 11, but one short definition is that an ideal system should get twice as much work done (twice as much throughput) when you double the number of workers trying to complete tasks. A second angle on the same goal is that if you double the resources available (for example, twice as many CPUs), you should be able to achieve twice the throughput. In both cases, you also want to ensure that performance (response time) is acceptable. Most systems are not linearly scalable, and exhibit diminishing returns and degraded performance as you vary the parameters.
Scalability measurements are good for capacity planning, because they can show weaknesses in your application that other benchmark strategies won’t show. For example, if you design your system to perform well on a response-time benchmark with a single connection (a poor benchmark strategy), your application might perform badly when there’s any degree of concurrency. A benchmark that looks for consistent response times under an increasing number of connections would show this design flaw.
Some activities, such as batch jobs to create summary tables from granular data, just need fast response times, period. It’s fine to benchmark them for pure response time, but remember to think about how they’ll interact with other activities. Batch jobs can cause interactive queries to suffer, and vice versa.
In the final analysis, it’s best to benchmark whatever is important to your users. Try to gather some requirements (formally or informally) about what acceptable response times are, what kind of concurrency you expect, and so on. Then try to design your benchmarks to satisfy all of the requirements, without getting tunnel vision and focusing on some things to the exclusion of others.
[11] Forum software, in particular, has miseducated countless website owners to believe they have tens of thousands of users at a time.
Benchmarking Tactics
With the general behind us, let’s move on to the specifics of how to design and execute benchmarks. Before we discuss how to do benchmarks well, though, let’s look at some common mistakes that can lead to unusable or inaccurate results:
§ Using a subset of the real data size, such as using only one gigabyte of data when the application will need to handle hundreds of gigabytes, or using the current dataset when you plan for the application to grow much larger.
§ Using incorrectly distributed data, such as uniformly distributed data when the real system’s data will have “hot spots.” (Randomly generated data is almost always unrealistically distributed.)
§ Using unrealistically distributed parameters, such as pretending that all user profiles are equally likely to be viewed.[12]
§ Using a single-user scenario for a multiuser application.
§ Benchmarking a distributed application on a single server.
§ Failing to match real user behavior, such as “think time” on a web page. Real users request a page and then read it; they don’t click on links one after another without pausing.
§ Running identical queries in a loop. Real queries aren’t identical, so they cause cache misses. Identical queries will be fully or partially cached at some level.
§ Failing to check for errors. If a benchmark’s results don’t make sense—e.g., if a slow operation suddenly completes very quickly—check for errors. You might just be benchmarking how quickly MySQL can detect a syntax error in the SQL query! Always check error logs after benchmarks, as a matter of principle.
§ Ignoring how the system performs when it’s not warmed up, such as right after a restart. Sometimes you need to know how long it’ll take your server to reach capacity after a restart, so you’ll want to look specifically at the warmup period. Conversely, if you intend to study normal performance, you’ll need to be aware that if you benchmark just after a restart many caches will be cold, and the benchmark results won’t reflect the results you’ll get under load when the caches are warmed up.
§ Using default server settings. There’s more on optimizing server settings in later chapters.
§ Benchmarking too quickly. Your benchmark needs to last a while. We’ll say more about this later.
Merely avoiding these mistakes will take you a long way toward improving the quality of your results.
All other things being equal, you should typically strive to make the tests as realistic as you can. Sometimes, though, it makes sense to use a slightly unrealistic benchmark. For example, say your application is on a different host from the database server. It would be more realistic to run the benchmarks in the same configuration, but doing so would add more variables, such as how fast and how heavily loaded the network is. Benchmarking on a single node is usually easier, and, in some cases, it’s accurate enough. You’ll have to use your judgment as to when this is appropriate.
Designing and Planning a Benchmark
The first step in planning a benchmark is to identify the problem and the goal. Next, decide whether to use a standard benchmark or design your own.
If you use a standard benchmark, be sure to choose one that matches your needs. For example, don’t use TPC-H to benchmark an ecommerce system. In TPC’s own words, “TPC-H is an ad-hoc, decision support benchmark.” Therefore, it’s not an appropriate benchmark for an OLTP system.
Designing your own benchmark is a complicated and iterative process. To get started, take a snapshot of your production dataset. Make sure you can restore this dataset for subsequent runs.
Next, you need queries to run against the data. You can make a unit test suite into a rudimentary benchmark just by running it many times, but that’s unlikely to match how you really use the database. A better approach is to log all queries on your production system during a representative time frame, such as an hour during peak load or an entire day. If you log queries during a small time frame, you might need to choose several time frames. This will let you cover all system activities, such as weekly reporting queries or batch jobs you schedule during off-peak times.[13]
You can log queries at different levels. For example, you can log the HTTP requests on a web server if you need a full-stack benchmark. You can also enable MySQL’s query log, but if you replay a query log, be sure to recreate the separate threads instead of just replaying each query linearly. It’s also important to create a separate thread for each connection in the log, instead of shuffling queries among threads. The query log shows which connection ran each query.
Even if you don’t build your own benchmark, you should write down your benchmarking plan. You’re going to run the benchmark many times over, and you need to be able to reproduce it exactly. Plan for the future, too. You might not be the one who runs the benchmark the next time around, and even if you are, you probably will not remember exactly how you ran it the first time. Your plan should include the test data, the steps taken to set up the system, how you measured and analyzed the results, and the warmup plan.
Design some method of documenting parameters and results, and document each run carefully. Your documentation method might be as simple as a spreadsheet or notebook, or as complex as a custom-designed database. Keep in mind that you’ll probably want to write some scripts to help analyze the results, so the easier it is to process the results without opening spreadsheets and text files, the better.
How Long Should the Benchmark Last?
It’s important to run the benchmark for a meaningful amount of time. If you’re interested in the system’s steady-state performance, which you probably should be, then you need to observe the system in a steady state. This can take a surprisingly long time to achieve, especially on servers with a lot of data and a lot of memory. Most systems have some buffers that create burstable capacity—the ability to absorb spikes, defer some work, and catch up later after the peak is over. But if you pressure these mechanisms for a long time, they will fill up, and you will eventually see that the system can’t sustain its short-term peak performance.
Sometimes you don’t know how long your benchmark needs to run. If this is the case, you can just run the benchmark forever, and observe until you are satisfied that the system is starting to become stable. Here’s an example of how we did this on a system we didn’t know well. Figure 2-1shows a time-series plot of the system’s disk read and write throughput.
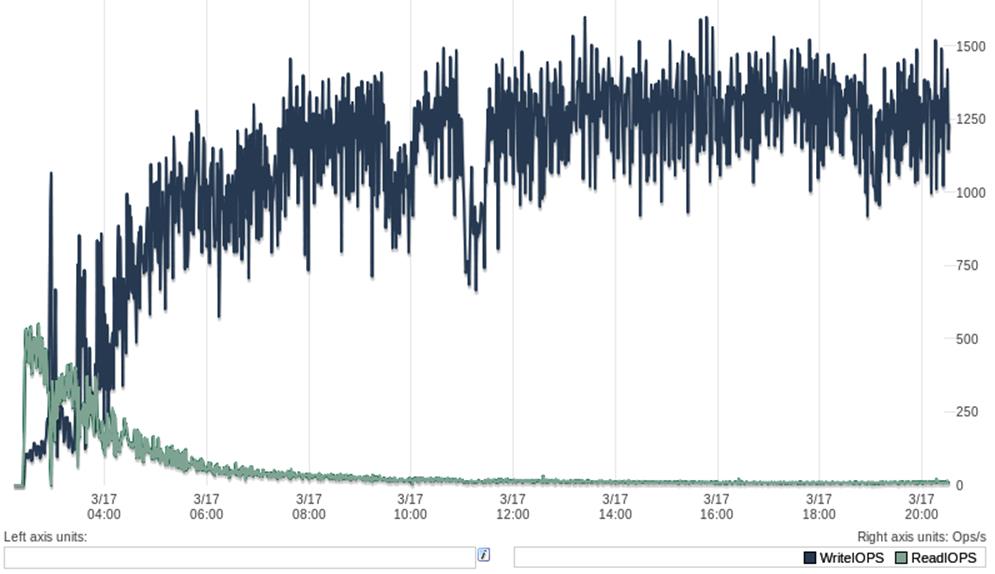
Figure 2-1. I/O performance during an extended benchmark
As the system warmed up, the read I/O activity settled into a steady line after three or four hours, but writes remained variable for at least eight hours, and then there were a few sharp notches in the plot of writes. After that, both reads and writes seemed to settle in.[14] A rule of thumb is to wait until the system looks like it’s been steady for at least as long as the initial warmup appeared to take. We ended up running this benchmark for 72 hours to ensure that the system was exhibiting its typical long-term behavior.
A very common benchmarking mistake is to run a series of short benchmarks, such as 60-second runs, and conclude something about the system’s performance from that. We hear a lot of comments such as “I tried benchmarking the new version of the server, and it wasn’t faster than the old version.” When we dig into the actual benchmark, we often find the benchmarks were conducted in a way that doesn’t support the conclusions they’re intended to generate. Sometimes people protest that they just don’t have time to benchmark the server for 8 or 12 hours at 10 different levels of concurrency on two or three server versions. If you don’t have the time to do the benchmarks right, any time you do spend is wasted; it is better to trust other people’s results, instead of doing an incomplete benchmark and getting the wrong answers.
Capturing System Performance and Status
It is important to capture as much information about the system under test (SUT) as possible while the benchmark runs. It’s a good idea to make a benchmark directory with subdirectories for each run’s results. You can then place the results, configuration files, measurements, scripts, and notes for each run in the appropriate subdirectory. If you can measure more than you think you’re interested in, record the extra data anyway. It’s much better to have unneeded data than to miss important data, and you might find the extra data useful in the future. Try to record status and performance metrics such as CPU usage, disk I/O, network traffic statistics, counters from SHOW GLOBAL STATUS; and so on.
Here is a sample shell script that you can use to gather data on MySQL during benchmarks:
#!/bin/sh
INTERVAL=5
PREFIX=$INTERVAL-sec-status
RUNFILE=/home/benchmarks/running
mysql -e 'SHOW GLOBAL VARIABLES' >> mysql-variables
while test -e $RUNFILE; do
file=$(date +%F_%I)
sleep=$(date +%s.%N | awk "{print $INTERVAL - (\$1 % $INTERVAL)}")
sleep $sleep
ts="$(date +"TS %s.%N %F %T")"
loadavg="$(uptime)"
echo "$ts $loadavg" >> $PREFIX-${file}-status
mysql -e 'SHOW GLOBAL STATUS' >> $PREFIX-${file}-status &
echo "$ts $loadavg" >> $PREFIX-${file}-innodbstatus
mysql -e 'SHOW ENGINE INNODB STATUS\G' >> $PREFIX-${file}-innodbstatus &
echo "$ts $loadavg" >> $PREFIX-${file}-processlist
mysql -e 'SHOW FULL PROCESSLIST\G' >> $PREFIX-${file}-processlist &
echo $ts
done
echo Exiting because $RUNFILE does not exist.
The shell script, simple as it is, is a solid framework for gathering performance and status data. There are a few things about it that we find useful, which you might not appreciate until you run large benchmarks across many servers and find it difficult to answer questions about system 'margin-top:6.0pt;margin-right:0cm;margin-bottom:0cm; margin-left:18.0pt;margin-bottom:.0001pt;text-indent:-18.0pt;line-height:normal; vertical-align:baseline'>§ The iterations are timed so that it will run every time the clock is evenly divisible by 5 seconds. If you just insert “sleep 5” into the loop, the loop will take slightly longer than 5 seconds to run, and you won’t have an easy time correlating any data captured by this script with any other scripts or graphs. And even if your loops somehow last exactly 5 seconds, it’s annoying to have some data from one system with a timestamp of 15:32:18.218192 and another system at 15:32:23.819437. You can change 5 seconds to something else, such as 1, 10, 30, or 60 if you want; we usually use 5 or 10 seconds.
§ Each file is named after the date and hour when the benchmark is run. When benchmarks last for days and the files grow large, you might find it handy to move previous files off the server and free up some disk space if needed, and get a head start on analyzing the full results. When you’re looking for data about a specific point in time, it’s also nice to be able to find it in a file named after the hour, rather than searching through a single file that has grown to gigabytes in size.
§ Each sample begins with a distinctive timestamp line, so you can search through the files for samples related to specific times, and you can write little awk and sed scripts easily.
§ The script doesn’t preprocess or filter anything it gathers. It’s a good idea to gather everything in its raw form, and process and filter it later. If you preprocess it, you’ll surely find yourself wishing for the raw data later when you find an anomaly and need more data to understand it.
§ You can make the script exit when the benchmark is done by removing the /home/benchmarks/running file in the script that executes your benchmark.
This is just a short code snippet, and probably won’t meet your needs as-is, but it’s an illustration of a good general approach to capturing performance and status data. As shown, the script captures only a few kinds of data on MySQL, but you can easily add more things to it. You can capture/proc/diskstats to record disk I/O for later analysis with the pt-diskstats tool,[15] for example.
Getting Accurate Results
The best way to get accurate results is to design your benchmark to answer the question you want to answer. Have you chosen the right benchmark? Are you capturing the data you need to answer the question? Are you benchmarking by the wrong criteria? For example, are you running a CPU-bound benchmark to predict the performance of an application you know will be I/O-bound?
Next, make sure your benchmark results will be repeatable. Try to ensure that the system is in the same state at the beginning of each run. If the benchmark is important, you should reboot between runs. If you need to benchmark on a warmed-up server, which is the norm, you should also make sure that your warmup is long enough (see the previous section on how long to run a benchmark), and that it’s repeatable. If the warmup consists of random queries, for example, your benchmark results will not be repeatable.
If the benchmark changes data or schema, reset it with a fresh snapshot between runs. Inserting into a table with a thousand rows will not give the same results as inserting into a table with a million rows! The data fragmentation and layout on disk can also make your results nonrepeatable. One way to make sure the physical layout is close to the same is to do a quick format and file copy of a partition.
Watch out for external load, profiling and monitoring systems, verbose logging, periodic jobs, and other factors that can skew your results. A typical surprise is a cron job that starts in the middle of a benchmark run, or a Patrol Read cycle or scheduled consistency check on your RAID card. Make sure all the resources the benchmark needs are dedicated to it while it runs. If something else is consuming network capacity, or if the benchmark runs on a SAN that’s shared with other servers, your results might not be accurate.
Try to change as few parameters as possible each time you run a benchmark. If you must change several things at once, you risk missing something. Parameters can also be dependent on one another, so sometimes you can’t change them independently. Sometimes you might not even know they are related, which adds to the complexity.[16]
It generally helps to change the benchmark parameters iteratively, rather than making dramatic changes between runs. For example, if you’re trying to adjust a setting to create a specific behavior, use techniques such as divide-and-conquer (halving the differences between runs) to home in on the right value.
We see a lot of benchmarks that try to predict performance after a migration, such as migrating from Oracle to MySQL. These are often troublesome, because MySQL performs well on completely different types of queries than Oracle. If you want to know how well an application built on Oracle will run after migrating it to MySQL, you usually need to redesign the schema and queries for MySQL. (In some cases, such as when you’re building a cross-platform application, you might want to know how the same queries will run on both platforms, but that’s unusual.)
You can’t get meaningful results from the default MySQL configuration settings either, because they’re tuned for tiny applications that consume very little memory. Some of the biggest face-palm moments we’ve had were when someone published flawed benchmarks comparing MySQL to other relational database management systems (RDBMSs) with the default settings. Irritatingly, these novice benchmarks often seem to become headline news.
Solid-state storage (SSDs and PCIe cards) presents special challenges for benchmarking, which we address in Chapter 9.
Finally, if you get a strange result, don’t simply dismiss it as a bad data point or say you don’t understand. Investigate and try to find out what happened. You might find a valuable result, a huge problem, or a flaw in your benchmark design. It’s not a good idea to publish benchmarks if you don’t understand the results. We’ve seen more than a few cases where benchmarks with odd results turned out to be completely meaningless due to a silly mistake, and the benchmarker looked rather foolish in the end.[17]
Running the Benchmark and Analyzing Results
Once you’ve prepared everything, you’re ready to run the benchmark and begin gathering and analyzing data.
It’s a good idea to automate the benchmark runs. Doing so will improve your results and their accuracy, because it will prevent you from forgetting steps or accidentally doing things differently on different runs. It will also help you document how to run the benchmark.
Any automation method will do; for example, a Makefile or a set of custom scripts. Choose whatever scripting language makes sense for you: shell, PHP, Perl, etc. Try to automate as much of the process as you can, including loading the data, warming up the system, running the benchmark, and recording the results.
NOTE
When you have it set up correctly, benchmarking can be a one-step process. If you’re just running a one-off benchmark to check something quickly, you might not want to automate it, but if you think you’ll ever refer to the results in the future, do it anyway. If you don’t, you’ll never remember how you ran the benchmark or what parameters you used, and you won’t be able to use the benchmark results later.
You’ll usually run a benchmark several times. Exactly how many runs you need depends on how you score the results, and how important the benchmark is. If you need greater certainty, you need to run the benchmark more times. Common practices are to look for the best result, average all the results, or just run the benchmark five times and average the three best results. You can be as precise as you want. You might want to apply statistical methods to your results, find the confidence interval, and so on, but you often don’t need that level of certainty.[18] If it answers your question to your satisfaction, you can simply run the benchmark several times and see how much the results vary. If they vary widely, either run the benchmark more times or run it for longer, which usually reduces variance.
Once you have your results, you need to analyze them—that is, turn the numbers into knowledge. The goal is to answer the question that frames the benchmark. Ideally, you’d like to be able to make a statement such as “Upgrading to four CPUs increases throughput by 50% with the same response time” or “The indexes made the queries faster.” If you want to be more scientific, read up on the null hypothesis before benchmarking—but note that most people are unlikely to hold you to such strict standards.
How you “crunch the numbers” depends on how you collect the results. You should probably write scripts to analyze the results, not only to help reduce the amount of work required, but for the same reasons you should automate the benchmark itself: repeatability and documentation. Here is a very simple skeleton shell script that can help you extract time-series metrics from the data-gathering script we showed earlier. It accepts as its command-line options the filenames of the collected data:
#!/bin/sh
# This script converts SHOW GLOBAL STATUS into a tabulated format, one line
# per sample in the input, with the metrics divided by the time elapsed
# between samples.
awk '
BEGIN {
printf "#ts date time load QPS";
fmt = " %.2f";
}
/^TS/ { # The timestamp lines begin with TS.
ts = substr($2, 1, index($2, ".") - 1);
load = NF - 2;
diff = ts - prev_ts;
prev_ts = ts;
printf "\n%s %s %s %s", ts, $3, $4, substr($load, 1, length($load)-1);
}
/Queries/ {
printf fmt, ($2-Queries)/diff;
Queries=$2
}
' "$@"
If you name this script analyze and run it against the status file generated by the earlier script, you might get something like the following:
[baron@ginger ~]$ ./analyze 5-sec-status-2011-03-20
#ts date time load QPS
1300642150 2011-03-20 17:29:10 0.00 0.62
1300642155 2011-03-20 17:29:15 0.00 1311.60
1300642160 2011-03-20 17:29:20 0.00 1770.60
1300642165 2011-03-20 17:29:25 0.00 1756.60
1300642170 2011-03-20 17:29:30 0.00 1752.40
1300642175 2011-03-20 17:29:35 0.00 1735.00
1300642180 2011-03-20 17:29:40 0.00 1713.00
1300642185 2011-03-20 17:29:45 0.00 1788.00
1300642190 2011-03-20 17:29:50 0.00 1596.40
The first line is the column headers, and you should ignore the second line, because it is before the benchmark really started to run. Subsequent lines have the Unix timestamp, date, time (notice the data points occur on the five-second clock ticks, as mentioned previously), system load average, and finally the QPS (queries per second) that the database server was executing. This is the bare minimum data you need to examine the system’s performance. Next we’ll show you how to plot this quickly and see what happened during the benchmark.
The Importance of Plotting
If you want to achieve world domination, you must plot continually, pun intended. But seriously, the single easiest and most rewarding thing you can do with your system performance metrics is plot them in a time series and look at them. You can spot problems on a chart instantly, when they could be difficult or impossible to see by examining the raw data. You should resist the temptation to simply look at the averages and other summary statistics your benchmark tool might print out. Averages are useless, because they obscure what is really happening. Fortunately, the output from the scripts we’ve written so far is custom-made for tools such as gnuplot or R to plot in the blink of an eye. We’ll demonstrate using gnuplot, assuming you saved the data into a file called QPS-per-5-seconds:
gnuplot> plot "QPS-per-5-seconds" using 5 w lines title "QPS"
This instructs gnuplot to plot the fifth field in the file (the QPS field) with lines and title it “QPS” on the plot. Figure 2-2 shows the result.
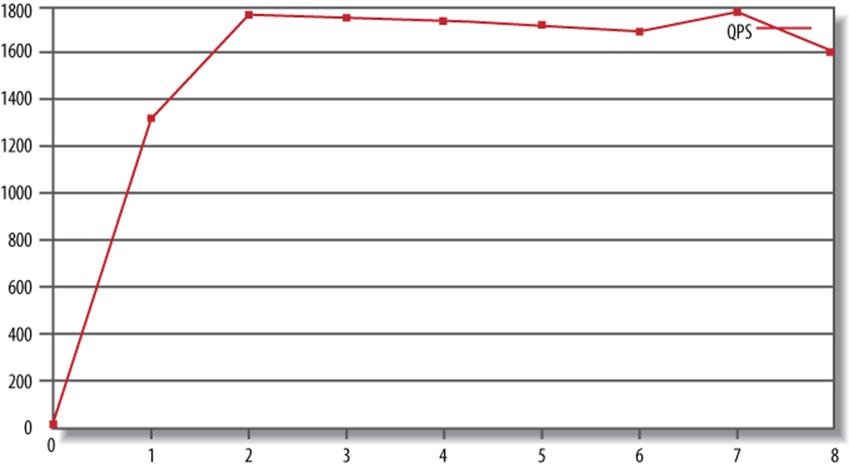
Figure 2-2. Plotting the benchmark’s QPS
Now let’s look at an example that will make the value of plotting more obvious. Suppose your system suffers from so-called “furious flushing” when it gets behind on checkpointing and blocks all activity until it catches up, causing sharp drops in the throughput. The 95th percentile and average response times will not show the drops, so the results will hide the problem. However, a graph will show periodic notches. This is illustrated in Figure 2-3.
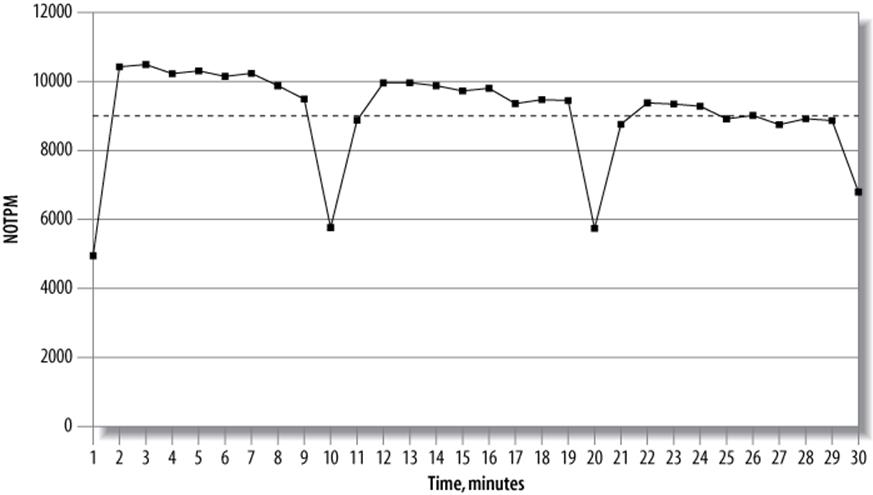
Figure 2-3. Results from a 30-minute dbt2 benchmark run
Figure 2-3 shows the throughput in new-order transactions per minute (NOTPM). This line shows significant drops, which the overall average (the dotted line) doesn’t show at all. The first drop is because the server’s caches are cold. The others show when the server spends time intensively flushing dirty pages to the disk. Without the graph, these aberrations are hard to see.
Such spiky behavior is very common in heavily loaded systems, and needs to be investigated. In this case, the behavior was because of the use of an older version of InnoDB, which had a poor flushing algorithm. But you can’t take that for granted. You need to go back to your detailed statistics and look at them. What did SHOW ENGINE INNODB STATUS look like during these notches? What about the output of SHOW FULL PROCESSLIST? You might be able to see instantly that InnoDB was flushing, or that there were many threads in the process list with a status of “waiting on query cache lock,” or something else similarly obvious. This is why it’s helpful to capture very detailed data during your benchmarks, and then plot it so problems pop out.
[12] Justin Bieber, we love you! Just kidding.
[13] All this is provided that you want a perfect benchmark, of course. Real life usually gets in the way.
[14] By the way, the graph of write I/O activity shows extremely bad behavior; this system’s steady state is a performance catastrophe. Calling it a “steady state” is almost laughable, but our point is that it’s indicative of how the server is going to behave over the long term.
[15] See Chapter 9 for more on the pt-diskstats tool.
[16] Sometimes, this doesn’t really matter. For example, if you’re thinking about migrating from a Solaris system on SPARC hardware to GNU/Linux on x86, there’s no point in benchmarking Solaris on x86 as an intermediate step!
[17] This has never, ever happened to any of the authors. Just in case you’re wondering.
[18] If you really need scientific, rigorous results, you should read a good book on how to design and execute controlled tests, because the subject is much larger than we can cover here.
Benchmarking Tools
You don’t have to roll your own benchmarking system, and in fact you shouldn’t unless there’s a good reason why you can’t use one of the available ones. We show you some of the available tools in the following sections.
Full-Stack Tools
Recall that there are two types of benchmarks: full-stack and single-component. Not surprisingly, there are tools to benchmark full applications, and there are tools to stress-test MySQL and other components in isolation. Testing the full stack is usually a better way to get a clear picture of your whole application’s performance. Full-stack tools include:
ab
ab is an Apache HTTP server benchmarking tool. It shows how many requests per second your HTTP server is capable of serving. If you are benchmarking a web application, this translates to how many requests per second the entire application can satisfy. It’s a very simple tool, but its usefulness is limited because it just hammers one URL as fast as it can. More information on ab is available at http://httpd.apache.org/docs/2.0/programs/ab.html.
http_load
This tool is similar in concept to ab; it is also designed to load a web server, but it’s more flexible. You can create an input file with many different URLs, and http_load will choose from among them at random. You can also instruct it to issue requests at a timed rate, instead of just running them as fast as it can. See http://www.acme.com/software/http_load/ for more information.
JMeter
JMeter is a Java application that can load another application and measure its performance. It was designed for testing web applications, but you can also use it to test FTP servers and issue queries to a database via JDBC.
JMeter is much more complex than ab and http_load. For example, it has features that let you simulate real users more flexibly, by controlling such parameters as ramp-up time. It has a graphical user interface with built-in result graphing, and it offers the ability to record and replay results offline. For more information, see http://jakarta.apache.org/jmeter/.
Single-Component Tools
Here are some useful tools to test the performance of MySQL and the system on which it runs. We show example benchmarks with some of these tools in the next section:
mysqlslap
mysqlslap (http://dev.mysql.com/doc/refman/5.1/en/mysqlslap.html) simulates load on the server and reports timing information. It is part of the MySQL 5.1 server distribution, but it should be possible to run it against MySQL 4.1 and newer servers. You can specify how many concurrent connections it should use, and you can give it either a SQL statement on the command line or a file containing SQL statements to run. If you don’t give it statements, it can also autogenerate SELECT statements by examining the server’s schema.
MySQL Benchmark Suite (sql-bench)
MySQL distributes its own benchmark suite with the MySQL server, and you can use it to benchmark several different database servers. It is single-threaded and measures how quickly the server executes queries. The results show which types of operations the server performs well.
The main benefit of this benchmark suite is that it contains a lot of predefined tests that are easy to use, so it makes it easy to compare different storage engines or configurations. It’s useful as a high-level benchmark, to compare the overall performance of two servers. You can also run a subset of its tests (for example, just testing UPDATE performance). The tests are mostly CPU-bound, but there are short periods that demand a lot of disk I/O.
The biggest disadvantages of this tool are that it’s single-user, it uses a very small dataset, you can’t test your site-specific data, and its results might vary between runs. Because it’s single-threaded and completely serial, it will not help you assess the benefits of multiple CPUs, but it can help you compare single-CPU servers.
Perl and DBD drivers are required for the database server you wish to benchmark. Documentation is available at http://dev.mysql.com/doc/en/mysql-benchmarks.html/.
Super Smack
Super Smack (http://vegan.net/tony/supersmack/) is a benchmarking, stress-testing, and load-generating tool for MySQL and PostgreSQL. It is a complex, powerful tool that lets you simulate multiple users, load test data into the database, and populate tables with randomly generated data. Benchmarks are contained in “smack” files, which use a simple language to define clients, tables, queries, and so on.
Database Test Suite
The Database Test Suite, designed by The Open Source Development Labs (OSDL) and hosted on SourceForge at http://sourceforge.net/projects/osdldbt/, is a test kit for running benchmarks similar to some industry-standard benchmarks, such as those published by the Transaction Processing Performance Council (TPC). In particular, the dbt2 test tool is a free (but uncertified) implementation of the TPC-C OLTP test. We used to use it a lot, but we have developed purpose-built tools for MySQL that we now use instead.
Percona’s TPCC-MySQL Tool
We have created a fair-usage implementation of a benchmark similar to the TPC-C test, with tools specifically designed for benchmarking MySQL. This is the tool we use most often for evaluating how MySQL behaves on nontrivial workloads. (For simpler benchmarks, we usually usesysbench instead.) The source code is available at https://launchpad.net/perconatools, and there is brief usage documentation in the source repository.
sysbench
sysbench (https://launchpad.net/sysbench) is a multithreaded system benchmarking tool. Its goal is to get a sense of system performance, in terms of the factors important for running a database server. For example, you can measure the performance of file I/O, the OS scheduler, memory allocation and transfer speed, POSIX threads, and the database server itself. sysbench supports scripting in the Lua language (http://www.lua.org), which makes it very flexible for testing a variety of scenarios. It is our favorite all-around benchmarking tool for MySQL, operating system, and hardware performance.
MYSQL’S BENCHMARK() FUNCTION
MySQL has a handy BENCHMARK() function that you can use to test execution speeds for certain types of operations. You use it by specifying a number of times to execute and an expression to execute. The expression can be any scalar expression, such as a scalar subquery or a function. This is convenient for testing the relative speed of some operations, such as seeing whether MD5() is faster than SHA1():
mysql> SET @input := 'hello world';
mysql> SELECT BENCHMARK(1000000, MD5(@input));
+---------------------------------+
| BENCHMARK(1000000, MD5(@input)) |
+---------------------------------+
| 0 |
+---------------------------------+
1 row in set (2.78 sec)
mysql> SELECT BENCHMARK(1000000, SHA1(@input));
+----------------------------------+
| BENCHMARK(1000000, SHA1(@input)) |
+----------------------------------+
| 0 |
+----------------------------------+
1 row in set (3.50 sec)
The return value is always 0; you time the execution by looking at how long the client application reported the query took. In this case, it looks like MD5() is faster. However, using BENCHMARK() correctly is tricky unless you know what it’s really doing. It simply measures how fast the server can execute the expression; it does not give any indication of the parsing and optimization overhead. And unless the expression includes a user variable, as in our example, the second and subsequent times the server executes the expression might be cache hits.[19]
Although it’s handy, we don’t use BENCHMARK() for real benchmarks. It’s too hard to figure out what it really measures, and it’s too narrowly focused on a small part of the overall execution process.
[19] One of the authors made this mistake and found that 10,000 executions of a certain expression ran just as fast as 1 execution. It was a cache hit. In general, this type of behavior should always make you suspect either a cache hit or an error.
Benchmarking Examples
In this section, we’ll show you some examples of actual benchmarks with tools we mentioned in the preceding sections. We can’t cover each tool exhaustively, but these examples should help you decide which benchmarks might be useful for your purposes and get you started using them.
http_load
Let’s start with a simple example of how to use http_load. We’ll use the following URLs, which we saved to a file called urls.txt:
http://www.mysqlperformanceblog.com/
http://www.mysqlperformanceblog.com/page/2/
http://www.mysqlperformanceblog.com/mysql-patches/
http://www.mysqlperformanceblog.com/mysql-performance-presentations/
http://www.mysqlperformanceblog.com/2006/09/06/slow-query-log-analyzes-tools/
The simplest way to use http_load is to simply fetch the URLs in a loop. The program fetches them as fast as it can:
$ http_load -parallel 1 -seconds 10 urls.txt
19 fetches, 1 max parallel, 837929 bytes, in 10.0003 seconds
44101.5 mean bytes/connection
1.89995 fetches/sec, 83790.7 bytes/sec
msecs/connect: 41.6647 mean, 56.156 max, 38.21 min
msecs/first-response: 320.207 mean, 508.958 max, 179.308 min
HTTP response codes:
code 200 - 19
The results are pretty self-explanatory; they simply show statistics about the requests. A slightly more complex usage scenario is to fetch the URLs as fast as possible in a loop, but emulate five concurrent users:
$ http_load -parallel 5 -seconds 10 urls.txt
94 fetches, 5 max parallel, 4.75565e+06 bytes, in 10.0005 seconds
50592 mean bytes/connection
9.39953 fetches/sec, 475541 bytes/sec
msecs/connect: 65.1983 mean, 169.991 max, 38.189 min
msecs/first-response: 245.014 mean, 993.059 max, 99.646 min
HTTP response codes:
code 200 - 94
Alternatively, instead of fetching as fast as possible, we can emulate the load for a predicted rate of requests (such as five per second):
$ http_load -rate 5 -seconds 10 urls.txt
48 fetches, 4 max parallel, 2.50104e+06 bytes, in 10 seconds
52105 mean bytes/connection
4.8 fetches/sec, 250104 bytes/sec
msecs/connect: 42.5931 mean, 60.462 max, 38.117 min
msecs/first-response: 246.811 mean, 546.203 max, 108.363 min
HTTP response codes:
code 200 - 48
Finally, we emulate even more load, with an incoming rate of 20 requests per second. Notice how the connect and response times increase with the higher load:
$ http_load -rate 20 -seconds 10 urls.txt
111 fetches, 89 max parallel, 5.91142e+06 bytes, in 10.0001 seconds
53256.1 mean bytes/connection
11.0998 fetches/sec, 591134 bytes/sec
msecs/connect: 100.384 mean, 211.885 max, 38.214 min
msecs/first-response: 2163.51 mean, 7862.77 max, 933.708 min
HTTP response codes:
code 200 -- 111
MySQL Benchmark Suite
The MySQL Benchmark Suite consists of a set of Perl benchmarks, so you’ll need Perl to run them. You’ll find the benchmarks in the sql-bench/ subdirectory in your MySQL installation. On Debian GNU/Linux systems, for example, they’re in /usr/share/mysql/sql-bench/.
Before getting started, read the included README file, which explains how to use the suite and documents the command-line arguments. To run all the tests, use commands like the following:
$ cd /usr/share/mysql/sql-bench/
sql-bench$ ./run-all-tests --server=mysql --user=root --log --fast
Test finished. You can find the result in:
output/RUN-mysql_fast-Linux_2.4.18_686_smp_i686
The benchmarks can take quite a while to run—perhaps over an hour, depending on your hardware and configuration. If you give the --log command-line option, you can monitor progress while they’re running. Each test logs its results in a subdirectory named output. Each file contains a series of timings for the operations in each benchmark. Here’s a sample, slightly reformatted for printing:
sql-bench$ tail −5 output/select-mysql_fast-Linux_2.4.18_686_smp_i686
Time for count_distinct_group_on_key (1000:6000):
34 wallclock secs ( 0.20 usr 0.08 sys + 0.00 cusr 0.00 csys = 0.28 CPU)
Time for count_distinct_group_on_key_parts (1000:100000):
34 wallclock secs ( 0.57 usr 0.27 sys + 0.00 cusr 0.00 csys = 0.84 CPU)
Time for count_distinct_group (1000:100000):
34 wallclock secs ( 0.59 usr 0.20 sys + 0.00 cusr 0.00 csys = 0.79 CPU)
Time for count_distinct_big (100:1000000):
8 wallclock secs ( 4.22 usr 2.20 sys + 0.00 cusr 0.00 csys = 6.42 CPU)
Total time:
868 wallclock secs (33.24 usr 9.55 sys + 0.00 cusr 0.00 csys = 42.79 CPU)
As an example, the count_distinct_group_on_key (1000:6000) test took 34 wall-clock seconds to execute. That’s the total amount of time the client took to run the test. The other values (usr, sys, cursr, csys) that added up to 0.28 seconds constitute the overhead for this test. That’s how much of the time was spent running the benchmark client code, rather than waiting for the MySQL server’s response. This means that the figure we care about—how much time was tied up by things outside the client’s control—was 33.72 seconds.
Rather than running the whole suite, you can run the tests individually. For example, you might decide to focus on the insert test. This gives you more detail than the summary created by the full test suite:
sql-bench$ ./test-insert
Testing server 'MySQL 4.0.13 log' at 2003-05-18 11:02:39
Testing the speed of inserting data into 1 table and do some selects on it.
The tests are done with a table that has 100000 rows.
Generating random keys
Creating tables
Inserting 100000 rows in order
Inserting 100000 rows in reverse order
Inserting 100000 rows in random order
Time for insert (300000):
42 wallclock secs ( 7.91 usr 5.03 sys + 0.00 cusr 0.00 csys = 12.94 CPU)
Testing insert of duplicates
Time for insert_duplicates (100000):
16 wallclock secs ( 2.28 usr 1.89 sys + 0.00 cusr 0.00 csys = 4.17 CPU)
sysbench
The sysbench tool can run a variety of “tests” (benchmarks). It was designed to test not only database performance, but also how well a system is likely to perform as a database server. In fact, Peter and Vadim originally designed it to run benchmarks specifically relevant to MySQL performance, even though they aren’t actually all MySQL benchmarks. We’ll start with some tests that aren’t MySQL-specific and measure performance for subsystems that will determine the system’s overall limits. Then we’ll show you how to measure database performance.
We highly recommend getting familiar with sysbench. It is one of the most useful tools in a MySQL user’s bag. And although there are many other tools that perform some of the functions it can do, those tools aren’t always reliable and the results aren’t always relevant to MySQL performance. For example, you can test I/O performance with iozone, bonnie++, and a number of other tools, but it requires a lot of care to make them test I/O in a similar fashion to the way InnoDB exercises the disks. On the other hand, sysbench behaves a lot like InnoDB, so its fileiotest is relevant out-of-the-box.
The sysbench CPU benchmark
The most obvious subsystem test is the CPU benchmark, which uses 64-bit integers to calculate prime numbers up to a specified maximum. We run this on two servers, both running GNU/Linux, and compare the results. Here’s the first server’s hardware:
[server1 ~]$ cat /proc/cpuinfo
...
model name : AMD Opteron(tm) Processor 246
stepping : 1
cpu MHz : 1992.857
cache size : 1024 KB
And here’s how to run the benchmark:
[server1 ~]$ sysbench --test=cpu --cpu-max-prime=20000 run
sysbench v0.4.8: multithreaded system evaluation benchmark
...
Test execution summary: total time: 121.7404s
The second server has a different CPU:
[server2 ~]$ cat /proc/cpuinfo
...
model name : Intel(R) Xeon(R) CPU 5130 @ 2.00GHz
stepping : 6
cpu MHz : 1995.005
Here’s its benchmark result:
[server1 ~]$ sysbench --test=cpu --cpu-max-prime=20000 run
sysbench v0.4.8: multithreaded system evaluation benchmark
...
Test execution summary: total time: 61.8596s
The result simply indicates the total time required to calculate the primes, which is very easy to compare. In this case, the second server ran the benchmark about twice as fast as the first server.
The sysbench file I/O benchmark
The fileio benchmark measures how your system performs under different kinds of I/O loads. It is very helpful for comparing hard drives, RAID cards, and RAID modes, and for tweaking the I/O subsystem. It emulates how InnoDB uses the disks in some important ways.
The first stage in running this test is to prepare some files for the benchmark. You should generate much more data than will fit in memory. If the data fits in memory, the operating system will cache most of it, and the results will not accurately represent an I/O-bound workload. We begin by creating a dataset:
$ sysbench --test=fileio --file-total-size=150G prepare
This creates files in the current working directory, which the run step will read and write. The second step is to run the benchmark. Several options are available to test different types of I/O performance:
seqwr
Sequential write
seqrewr
Sequential rewrite
seqrd
Sequential read
rndrd
Random read
rndwr
Random write
rndrw
Combined random read/write
The following command runs the random read/write access file I/O benchmark:
$ sysbench --test=fileio --file-total-size=150G --file-test-mode=rndrw/
--init-rng=on --max-time=300 --max-requests=0 run
Here are the results:
sysbench v0.4.8: multithreaded system evaluation benchmark
Running the test with following options:
Number of threads: 1
Initializing random number generator from timer.
Extra file open flags: 0
128 files, 1.1719Gb each
150Gb total file size
Block size 16Kb
Number of random requests for random IO: 10000
Read/Write ratio for combined random IO test: 1.50
Periodic FSYNC enabled, calling fsync() each 100 requests.
Calling fsync() at the end of test, Enabled.
Using synchronous I/O mode
Doing random r/w test
Threads started!
Time limit exceeded, exiting...
Done.
Operations performed: 40260 Read, 26840 Write, 85785 Other = 152885 Total
Read 629.06Mb Written 419.38Mb Total transferred 1.0239Gb (3.4948Mb/sec)
223.67 Requests/sec executed
Test execution summary:
total time: 300.0004s
total number of events: 67100
total time taken by event execution: 254.4601
per-request statistics:
min: 0.0000s
avg: 0.0038s
max: 0.5628s
approx. 95 percentile: 0.0099s
Threads fairness:
events (avg/stddev): 67100.0000/0.00
execution time (avg/stddev): 254.4601/0.00
There’s a lot of information in the output. The most interesting numbers for measuring the I/O subsystem are the number of requests per second and the total throughput. In this case, the results are 223.67 requests/sec and 3.4948 MB/sec, respectively. The timing information, especially the approximate 95th percentile, is also valuable. These values provide a good indication of disk performance.
When you’re finished, you can run a cleanup to delete the files sysbench created for the benchmarks:
$ sysbench --test=fileio --file-total-size=150G cleanup
The sysbench OLTP benchmark
The OLTP benchmark emulates a simple transaction-processing workload. We show an example with a table that has a million rows. The first step is to prepare a table for the test:
$ sysbench --test=oltp --oltp-table-size=1000000 --mysql-db=test/
--mysql-user=root prepare
sysbench v0.4.8: multithreaded system evaluation benchmark
No DB drivers specified, using mysql
Creating table 'sbtest'...
Creating 1000000 records in table 'sbtest'...
That’s all you need to do to prepare the test data. Next, we run the benchmark in read-only mode for 60 seconds, with eight concurrent threads:
$ sysbench --test=oltp --oltp-table-size=1000000 --mysql-db=test --mysql-user=root/
--max-time=60 --oltp-read-only=on --max-requests=0 --num-threads=8 run
sysbench v0.4.8: multithreaded system evaluation benchmark
No DB drivers specified, using mysql
WARNING: Preparing of "BEGIN" is unsupported, using emulation
(last message repeated 7 times)
Running the test with following options:
Number of threads: 8
Doing OLTP test.
Running mixed OLTP test
Doing read-only test
Using Special distribution (12 iterations, 1 pct of values are returned in 75 pct
cases)
Using "BEGIN" for starting transactions
Using auto_inc on the id column
Threads started!
Time limit exceeded, exiting...
(last message repeated 7 times)
Done.
OLTP test statistics:
queries performed:
read: 179606
write: 0
other: 25658
total: 205264
transactions: 12829 (213.07 per sec.)
deadlocks: 0 (0.00 per sec.)
read/write requests: 179606 (2982.92 per sec.)
other operations: 25658 (426.13 per sec.)
Test execution summary:
total time: 60.2114s
total number of events: 12829
total time taken by event execution: 480.2086
per-request statistics:
min: 0.0030s
avg: 0.0374s
max: 1.9106s
approx. 95 percentile: 0.1163s
Threads fairness:
events (avg/stddev): 1603.6250/70.66
execution time (avg/stddev): 60.0261/0.06
As before, there’s quite a bit of information in the results. The most interesting parts are:
§ The transaction count
§ The rate of transactions per second
§ The timing statistics (minimal, average, maximal, and 95th percentile time)
§ The thread-fairness statistics, which show how fair the simulated workload was
The example we’ve given is applicable to version 4 of sysbench, which is available in prebuilt binaries from SourceForge.net. However, if you’re willing to compile sysbench from the source code on Launchpad (it’s easy and tastes great!), you can take advantage of a lot of improvements in version 5. You can run benchmarks against multiple tables instead of a single table, and you can observe throughput and response time at regular intervals, such as every 10 seconds. These metrics are very important for understanding system behavior.
Other sysbench features
The sysbench tool can run several other system benchmarks that don’t measure a database server’s performance directly:
memory
Exercises sequential memory reads or writes.
threads
Benchmarks the thread scheduler’s performance. This is especially useful to test the scheduler’s behavior under high load.
mutex
Measures mutex performance by emulating a situation where all threads run concurrently most of the time, acquiring mutex locks only briefly. (A mutex is a data structure that guarantees mutually exclusive access to some resource, preventing concurrent access from causing problems.)
seqwr
Measures sequential write performance. This is very important for testing a system’s practical performance limits. It can show how well your RAID controller’s cache performs and alert you if the results are unusual. For example, if you have no battery-backed write cache but your disk achieves 3,000 requests per second, something is wrong, and your data is not safe.
In addition to the benchmark-specific mode parameter (--test), sysbench accepts some other common parameters, such as --num-threads, --max-requests, and --max-time. See the documentation for more information on these.
dbt2 TPC-C on the Database Test Suite
The Database Test Suite’s dbt2 tool is a free implementation of the TPC-C test. TPC-C is a specification published by the TPC organization that emulates a complex online transaction-processing load. It reports its results in transactions per minute (tpmC), along with the cost of each transaction (Price/tpmC). The results depend greatly on the hardware, so the published TPC-C results contain detailed specifications of the servers used in the benchmark.
NOTE
The dbt2 test is not really TPC-C. It’s not certified by TPC, and its results aren’t directly comparable with TPC-C results. Also note that the authors have created what we consider to be a better tool than dbt2 for MySQL; see the next section.
Let’s look at a sample of how to set up and run a dbt2 benchmark. We used version 0.37 of dbt2, which is the most recent version we were able to use with MySQL (newer versions contain fixes that MySQL does not fully support). The following are the steps we took:
1. Prepare data.
The following command creates data for 10 warehouses in the specified directory. The warehouses use a total of about 700 MB of space. The amount of space required will change in proportion to the number of warehouses, so you can change the -w parameter to create a dataset with the size you need:
# src/datagen -w 10 -d /mnt/data/dbt2-w10
warehouses = 10
districts = 10
customers = 3000
items = 100000
orders = 3000
stock = 100000
new_orders = 900
Output directory of data files: /mnt/data/dbt2-w10
Generating data files for 10 warehouse(s)...
Generating item table data...
Finished item table data...
Generating warehouse table data...
Finished warehouse table data...
Generating stock table data...
2. Load data into the MySQL database.
The following command creates a database named dbt2w10 and loads it with the data we generated in the previous step (-d is the database name and -f is the directory with the generated data):
# scripts/mysql/mysql_load_db.sh -d dbt2w10 -f /mnt/data/dbt2-w10/
-s /var/lib/mysql/mysql.sock
3. Run the benchmark.
The final step is to execute the following command from the scripts directory:
# run_mysql.sh -c 10 -w 10 -t 300 -n dbt2w10/
-u root -o /var/lib/mysql/mysql.sock-e
************************************************************************
* DBT2 test for MySQL started *
* *
* Results can be found in output/9 directory *
************************************************************************
* *
* Test consists of 4 stages: *
* *
* 1. Start of client to create pool of databases connections *
* 2. Start of driver to emulate terminals and transactions generation *
* 3. Test *
* 4. Processing of results *
* *
************************************************************************
DATABASE NAME: dbt2w10
DATABASE USER: root
DATABASE SOCKET: /var/lib/mysql/mysql.sock
DATABASE CONNECTIONS: 10
TERMINAL THREADS: 100
SCALE FACTOR(WARHOUSES): 10
TERMINALS PER WAREHOUSE: 10
DURATION OF TEST(in sec): 300
SLEEPY in (msec) 300
ZERO DELAYS MODE: 1
Stage 1. Starting up client...
Delay for each thread - 300 msec. Will sleep for 4 sec to start 10 database
connections
CLIENT_PID = 12962
Stage 2. Starting up driver...
Delay for each thread - 300 msec. Will sleep for 34 sec to start 100 terminal
threads
All threads has spawned successfuly.
Stage 3. Starting of the test. Duration of the test 300 sec
Stage 4. Processing of results...
Shutdown clients. Send TERM signal to 12962.
Response Time (s)
Transaction % Average : 90th % Total Rollbacks %
------------ ----- ----------------- ------ --------- -----
Delivery 3.53 2.224 : 3.059 1603 0 0.00
New Order 41.24 0.659 : 1.175 18742 172 0.92
Order Status 3.86 0.684 : 1.228 1756 0 0.00
Payment 39.23 0.644 : 1.161 17827 0 0.00
Stock Level 3.59 0.652 : 1.147 1630 0 0.00
3396.95 new-order transactions per minute (NOTPM)
5.5 minute duration
0 total unknown errors
31 second(s) ramping up
The most important result is this line near the end:
3396.95 new-order transactions per minute (NOTPM)
This shows how many transactions per minute the system can process; more is better. (The term “new-order” is not a special term for a type of transaction; it simply means the test simulated someone placing a new order on the imaginary ecommerce website.)
You can change a few parameters to create different benchmarks:
-c
The number of connections to the database. You can change this to emulate different levels of concurrency and see how the system scales.
-e
This enables zero-delay mode, which means there will be no delay between queries. This stress-tests the database, but it can be unrealistic as real users need some “think time” before generating new queries.
-t
The total duration of the benchmark. Choose this time carefully, or the results will be meaningless. Too short a time for benchmarking an I/O-bound workload will give incorrect results because the system will not have enough time to warm the caches and start to work normally. On the other hand, if you want to benchmark a CPU-bound workload, you shouldn’t make the time too long, or the dataset might grow significantly and become I/O-bound.
This benchmark’s results can provide information on more than just performance. For example, if you see too many rollbacks, you’ll know something is likely to be wrong.
Percona’s TPCC-MySQL Tool
Although it’s great for simple tests and comparisons, the workload that sysbench generates is not really relevant to any real-world application. The TPC-C benchmark is much better for that. Although the dbt2 tool shown in the previous section is one fair-use implementation of that benchmark, it has some drawbacks. These prompted the authors of this book to create another TCP-C-like benchmark tool better suited to running a lot of very large benchmarks. The code is available through Launchpad at https://code.launchpad.net/~percona-dev/perconatools/tpcc-mysql, and there is a brief README file that explains how to build and use the tool. It is quite simple to use. For large numbers of warehouses, you might want to consider using the parallel data loading utility included with the tool, because otherwise it can take a long time to generate the dataset.
To use the tool, you need to create the database and table structures, load the data, and then execute the benchmark. The database and table structures are simple SQL scripts included with the source code, and the data loading is accomplished through the tpcc_load C program, which you must compile. This will run for a while and produce a great deal of output. (You should always redirect program output to files for documentation purposes, but here you really need to do so, or you might even lose your scrollback history.) Here is an example setup, creating a small (five warehouses) dataset in a database named tpcc5:
$ ./tpcc_load localhost tpcc5 username p4ssword 5
*************************************
*** ###easy### TPC-C Data Loader ***
*************************************
<Parameters>
[server]: localhost
[port]: 3306
[DBname]: tpcc5
[user]: username
[pass]: p4ssword
[warehouse]: 5
TPCC Data Load Started...
Loading Item
.................................................. 5000
.................................................. 10000
.................................................. 15000
[output snipped for brevity]
Loading Orders for D=10, W= 5
.......... 1000
.......... 2000
.......... 3000
Orders Done.
...DATA LOADING COMPLETED SUCCESSFULLY.
Next, you need to execute the benchmark, which requires the tpcc_start C program. Again there is a lot of output, which should be redirected to a file. Here is a very short sample run that runs five threads against the five warehouses, warming up for 30 seconds and then benchmarking for 30 seconds:
$ ./tpcc_start localhost tpcc5 username p4ssword 5 5 30 30
***************************************
*** ###easy### TPC-C Load Generator ***
***************************************
<Parameters>
[server]: localhost
[port]: 3306
[DBname]: tpcc5
[user]: username
[pass]: p4ssword
[warehouse]: 5
[connection]: 5
[rampup]: 30 (sec.)
[measure]: 30 (sec.)
RAMP-UP TIME.(30 sec.)
MEASURING START.
10, 63(0):0.40, 63(0):0.42, 7(0):0.76, 6(0):2.60, 6(0):0.17
20, 75(0):0.40, 74(0):0.62, 7(0):0.04, 9(0):2.38, 7(0):0.75
30, 83(0):0.22, 84(0):0.37, 9(0):0.04, 7(0):1.97, 9(0):0.80
STOPPING THREADS.....
<RT Histogram>
1.New-Order
2.Payment
3.Order-Status
4.Delivery
5.Stock-Level
<90th Percentile RT (MaxRT)>
New-Order : 0.37 (1.10)
Payment : 0.47 (1.24)
Order-Status : 0.06 (0.96)
Delivery : 2.43 (2.72)
Stock-Level : 0.75 (0.79)
<Raw Results>
[0] sc:221 lt:0 rt:0 fl:0
[1] sc:221 lt:0 rt:0 fl:0
[2] sc:23 lt:0 rt:0 fl:0
[3] sc:22 lt:0 rt:0 fl:0
[4] sc:22 lt:0 rt:0 fl:0
in 30 sec.
<Raw Results2(sum ver.)>
[0] sc:221 lt:0 rt:0 fl:0
[1] sc:221 lt:0 rt:0 fl:0
[2] sc:23 lt:0 rt:0 fl:0
[3] sc:22 lt:0 rt:0 fl:0
[4] sc:22 lt:0 rt:0 fl:0
<Constraint Check> (all must be [OK])
[transaction percentage]
Payment: 43.42% (>=43.0%) [OK]
Order-Status: 4.52% (>= 4.0%) [OK]
Delivery: 4.32% (>= 4.0%) [OK]
Stock-Level: 4.32% (>= 4.0%) [OK]
[response time (at least 90% passed)]
New-Order: 100.00% [OK]
Payment: 100.00% [OK]
Order-Status: 100.00% [OK]
Delivery: 100.00% [OK]
Stock-Level: 100.00% [OK]
<TpmC>
442.000 TpmC
The very last line is the benchmark result: the number of transactions per minute that the benchmark achieved.[20] If you see aberrant results in the lines immediately preceding this, such as the constraint check lines, you can examine the response-time histograms and other verbose output for clues about what was going wrong. Of course, you should have used scripts such as those we showed earlier in this chapter as well, so you should also have detailed diagnostic and performance data about what the server was doing during the benchmark run.
[20] We ran this benchmark on a laptop for demonstration purposes only. Real servers should perform much faster.
Summary
Everyone who uses MySQL has reasons to learn the basics of benchmarking it. Benchmarking is not just a practical activity for solving business problems, it’s also highly educational. Learning how to frame a problem in such a way that a benchmark can help provide an answer is analogous to working from word problems to setting up equations in a math course. Phrasing the question correctly, choosing the right benchmark to answer the question, selecting the benchmark duration and parameters, running the benchmark, collecting the data, and analyzing the results will all make you a much better MySQL user.
If you haven’t done so yet, we recommend at least getting familiar with sysbench. Learn how to use its oltp and fileio benchmarks, if nothing else. The oltp benchmark is very handy for quickly comparing different systems. Filesystem and disk benchmarks, on the other hand, are invaluable for troubleshooting and isolating misbehaving components when there are system performance problems. We’ve used such benchmarks many times to prove that despite the administrator’s claims, a SAN really did have a failed disk, or a RAID controller’s cache policy wasn’t actually configured as the utility claimed it was. And when you’re benchmarking a single disk and it claims to be able to execute 14,000 random reads per second, you know that you’ve either made a mistake or something is seriously wrong or misconfigured.[21]
If you’ll be benchmarking systems often, it’s a good idea to make a discipline of it. Pick a few benchmark tools that suit your needs, and learn them well. Build up a library of scripts to help you set up benchmarks, capture the output and system performance and status information, and analyze it afterward. Get comfortable with a plotting utility such as gnuplot or R—don’t waste your time on spreadsheets; they are far too cumbersome and slow. Plot early and plot often, to discover problems and failures in your benchmarks and systems. Your eyes are more sophisticated than any script or tool for discovering anomalies.
[21] A single spinning disk can perform only a couple hundred operations per second, due to seek and rotation times.
All materials on the site are licensed Creative Commons Attribution-Sharealike 3.0 Unported CC BY-SA 3.0 & GNU Free Documentation License (GFDL)
If you are the copyright holder of any material contained on our site and intend to remove it, please contact our site administrator for approval.
© 2016-2026 All site design rights belong to S.Y.A.