JMP Essentials: An Illustrated Guide for New Users, Second Edition (2014)
Preface
JMP Essentials was written for the new user of JMP software who needs to get the right results right away. If you have data and problems to solve, JMP will help you make sense of them to gain understanding and arrive at a good decision. It is the goal of this book to help you with this task.
We often find new users of JMP simply trying to complete a specific task with their data. Perhaps you just need to generate a certain graph for a Microsoft PowerPoint presentation or to quickly see how patterns in your data will lead you to an important discovery. If these scenarios sound close to home, you’ve come to the right place. This book is task-oriented and will help you access your data, identify that graph or statistic you need, and quickly and easily create and share it with others.
JMP software is built around the workflow of the problem solver. One of its outstanding features is that it consistently provides the correct graphs and statistics for the data you’re working with (something we refer to as JMP’s smart interface). JMP will lead you down the right path to the right result, provided your data is properly classified and you have an idea of what questions you’re trying to answer.
JMP is easy to use. In most cases, generating a graph or result will take you seconds, maybe minutes, to complete but never hours or days. Much of this efficiency is due not only to the small number of steps required but to the ability to navigate intuitively toward the right solution quickly, rather than through repetitive and time-consuming trial-and-error. This book provides you with the essential knowledge to get to your solution even faster.
Though JMP contains state-of-the-art visualization and advanced statistical and data mining tools, we also believe it is the right tool for the user who might be less confident in his or her analytic abilities. While there is a time and place for every feature in JMP, we have tried to include only those topics that a typical new user—a manager or analyst, for example—would need. If it’s been a while since you’ve studied statistics or dealt with its terminology, do not worry. We will present the key ideas and fill in the gaps as needed.
Audience
While this second edition of JMP Essentials is designed for new users, we have also focused on the most fundamental and commonly used features of JMP so that it may also serve as a valuable reference to the occasional user too. This focus is what we like to think of as the 20% of JMP that is used 80% of the time. Throughout the book, we have provided the necessary instruction to generate results quickly. Each key step in this process is illustrated with screenshots to help you see the result and develop your confidence in using JMP. We don’t assume any formal background in statistics. Instead we emphasize the intuition of concepts over statistical theory. If you require deeper statistical understanding, we recommend the documentation included in JMP and some excellent textbooks in the Bibliography.
Most new users of JMP have one or more of the following distinct needs:
1. They need to get their data into an appropriate and structured format so it may be effectively analyzed or visualized. (See Chapter 2).
2. They have a good idea of what graph they need and recognize it by its illustration or name and simply want to create it (see Chapter 3).
3. They really don’t know what the data will say, and need help exploring or summarizing it (see Chapter 4).
4. They need to interpret or answer some specific questions about the data they have (see Chapters 5 and 6).
We also believe that the complete book is well suited as a reference guide to the following groups of users:
• Spreadsheet users who are looking for a convenient way to produce nice visualizations of their data or to supplement a spreadsheet’s statistical capabilities. JMP reads and writes data from a variety of programs including Microsoft Excel. This book provides a quick and easy way to make your spreadsheet data come alive and allows you to fully and interactively explore that data.
• Students enrolled in introductory statistics courses who may need JMP instruction. JMP is the ideal tool for students because its navigation reinforces the basic assumptions taught in an introductory course. This book provides an overview of the JMP tools needed in most first-year courses.
• SAS users who want to take advantage of JMP’s data visualization tools. We’ve provided Appendix A to illustrate the features of how JMP integrates with SAS.
Approach and Features
We have found that the best way to learn JMP is by using it and getting value out of it quickly. Our goal is to present the materials in this book in the most user-oriented approach possible. So, we have made every effort to organize the presentation around the new user’s common needs and questions and the most direct and concise means to answer them. We also recognize that the most basic use of data is in generating graphs of data rather than performing more complex statistical analyses. The following features are included for this purpose:
• We present the material with a show-and-tell approach. In most cases, we show you what the results look like alongside the conditions and steps required to produce them. We think this approach is especially useful for JMP users who have a good idea of what they want from JMP and just need the steps to create it.
• When appropriate, we provide an example-driven context for each JMP platform that explains its use, value, and general application to problems. We have tried to distill these contexts down to typical or easy-to-understand cases.
• We organize the contents into easily manageable chunks of information. While the entire book is designed to cover a fairly complete overview of the basics, each chapter represents one family of tasks (such as importing data, creating graphs, and sharing graphs).
• We hope you will keep this book near your computer. Within each chapter or tab, we have designed each page—whenever possible—to be self-contained (beginning and ending a task in a page or page spread), allowing you to quickly find and execute the required steps you’re looking for without having to flip pages.
• No matter what your professional background, this book assumes only that you have a basic working knowledge of Microsoft Windows. Virtually all of the information in this book applies to using JMP on the Macintosh operating system, but only the Windows version of JMP is used in the examples.
Software Used to Develop This Content
This edition of JMP Essentials was developed with JMP 11 and pre-release versions of JMP 12. Users of JMP Pro, JMP Student Edition or earlier releases of JMP will find nearly all of the instructions in this book suitable for their needs.
Organization
This book is designed like a cookbook. Find what you need, and follow the steps. We have organized the contents of this book to reflect both the process of analyzing data (getting data, analyzing it, and sharing the results) and the progression from the very basic features in JMP to more specialized ones. We hope this organization offers the most value to the reader. Much of our judgment in this regard comes from our experience working one-on-one with new JMP users.
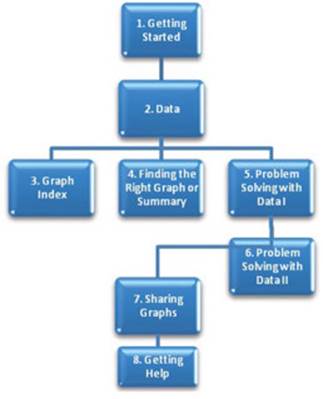
• Chapter 1 covers the preliminary material you’ll need for the rest of the book. The chapter identifies the conventions we use and introduces you to JMP menus, windows, and preferences.
• Chapter 2 covers the first step in any analysis: getting your data into JMP. With the exception of some material in Chapter 2, other chapters are self-contained, and you can read them in any order.
• Chapters 3 through 6 cover graphing and analysis:
◦ Chapter 3 is for the user who knows what graph he or she wants.
◦ Chapter 4 is for the user who does not know what the data says and needs to explore it to find an appropriate graph or summary. This chapter introduces maps.
◦ Chapters 5 and 6 are for the user who needs to solve a problem and answer questions using analytics and graphs.
• Chapter 7 covers topics related to sharing your graphs or results in a presentation, document, or through a browser.
• Chapter 8 covers additional resources that are available within JMP, online, and from outside resources, such as training, books, and user groups.
Figure 1 Chapter Organization
New to the Second Edition
It is gratifying to hear that the first edition has been useful to many new users of JMP. Our goal in writing this second edition is two-fold; first, to improve upon the core features of the first edition and to that end, we have made many refinements, corrections and additions throughout the book based on feedback from users, colleagues and reviewers. Secondly, in the 4 years since the first edition was published, JMP has added several important new features that we believe are Essential to the new user. While the first edition still works fine for most of its content, JMP has developed many new and useful features for the new or occasional users that we thought should be included. We have added 8 new sections to the book in addition to many subsections:
• Elements of Using JMP (Section 1.3). This new section provides an overview of the 4 common components to most JMP analyses.
• The Excel Add-In (Section 1.6). The JMP add-in for Excel is an optional means to launch common JMP platforms from within Microsoft Excel environment.
• Filtering Data (Section 2.5). This section covers the important subject of drilling down and filtering data with the concept of Row States.
• Shape Files & Background Maps (Section 2.7). Creating maps is easy when you understand a little bit about how the underlying data works. This section covers the essentials of the special data files and columns you need to create them.
• Creating Maps (Section 3.2). Our section about Interactive Maps illustrates the steps required to create thematic maps and utilizing background maps
• Using Graph Builder to Create Maps (Section 4.2). This section illustrates the steps required to visualize data on street-level maps.
• Informative Missing (Section 6.2). We’ve thoroughly revised section 6.2 to introduce the important concept of Informative Missing which is now included in the Partition platform (and many other modeling platforms in JMP Pro). If your rows contain missing values, this feature can help you use these rows to yield better models.
• Sharing Dynamic Graphs with HTML 5 (Section 7.4). HTML 5 is an emerging standard for the purpose of sharing interactive graphs with people who don’t have JMP.
• Combining Windows into Dashboards (Section 7.7). One of the great features of JMP is its dynamically linked graphs. You can now combine several different windows/platforms into one window or dashboard. These are referred to as Instant Applications in JMP.
All materials on the site are licensed Creative Commons Attribution-Sharealike 3.0 Unported CC BY-SA 3.0 & GNU Free Documentation License (GFDL)
If you are the copyright holder of any material contained on our site and intend to remove it, please contact our site administrator for approval.
© 2016-2026 All site design rights belong to S.Y.A.