Using JMP 12 (2015)
Chapter 2. Get Started
Introduction to Basic Features
To get you started with JMP, this chapter covers the following topics:
•learn about the initial windows that appear when you start JMP
•understand data tables
•open data files
•manage open windows
•learn about the anatomy of a typical JMP user session
Figure 2.1 The JMP Home Window on Windows

Contents
Manage JMP Files and Open Windows
JMP Home Window on Windows
JMP Home Window on Macintosh
JMP Starter Window
JMP Personalization Window
Data Tables
Data Table Panels
Data Grid
Open Data File Options
Close Multiple Files
Display and Arrange Open Windows
Preview JMP Files
Anatomy of a JMP Session
Manage JMP Files and Open Windows
The JMP Home Window provides instant access to open window and files.
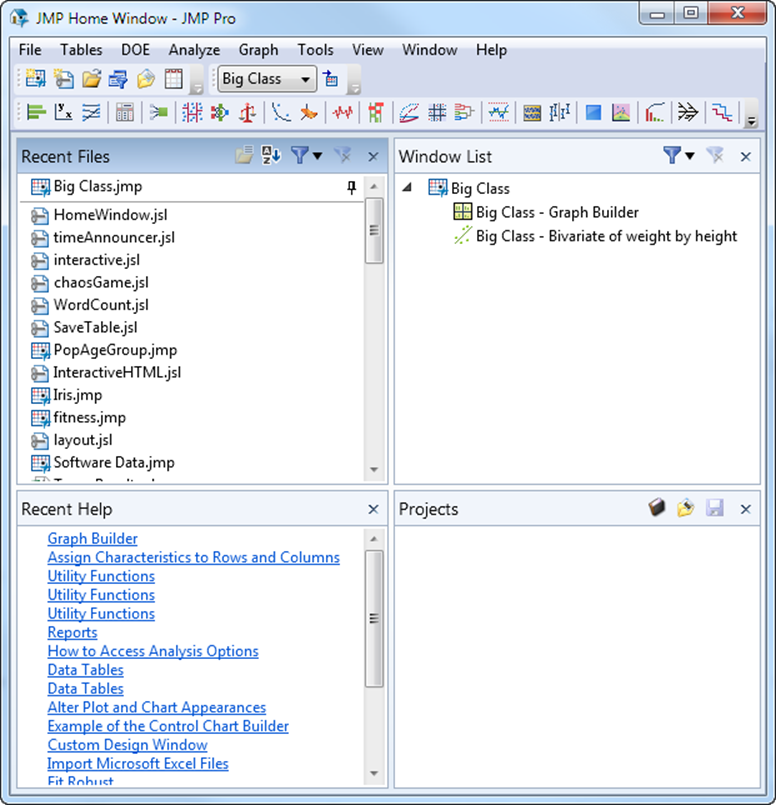
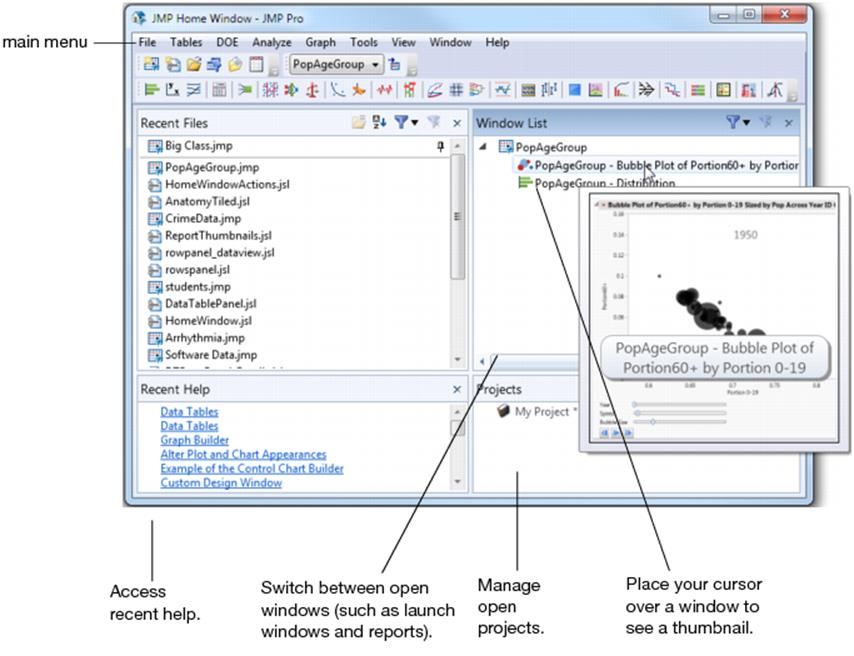
JMP Home Window on Windows
On Windows, the JMP Home Window appears when you open JMP.
•Recent Files: Shows recently opened files. See “Recent Files”.
•Window List: Shows open JMP windows. See “Window List”.
•Recent Help: Shows recently opened Help topics. Click on a topic to open it.
•Projects: Shows open JMP projects. See “Projects”.
Tip: If you close a panel and want to reopen it, select View > Home Window Panes and select the panel that you want to open.
If you re-arrange the Home Window panes and you want to return to the default layout, select View > Home Window Panes > Revert To Factory Layout.
Figure 2.2 Example of the JMP Home Window (Windows)
Open the JMP Home Window by selecting View > Home Window or clicking the JMP Home Window ![]() button in the lower right corner of most JMP windows. If you cannot see the JMP Home Window button, select View > Status Bars.
button in the lower right corner of most JMP windows. If you cannot see the JMP Home Window button, select View > Status Bars.
Tip: If you prefer to see the JMP Starter or the Window List upon start-up, you can specify that in the Preferences (Windows only). Select File > Preferences > General and select an option from the Initial JMP Window list.
JMP Home Window Buttons
The JMP Home Window panels can contain the following buttons:
![]() The Open Selected button opens the selected files in the Recent Files list.
The Open Selected button opens the selected files in the Recent Files list.
![]() The Sort By Name button sorts recent files alphabetically.
The Sort By Name button sorts recent files alphabetically.
![]() The Filter button filters the types of files that appear in the Recent Files and Window List panels.
The Filter button filters the types of files that appear in the Recent Files and Window List panels.
![]() The Clear Filter button clears any filters that are set in the Recent Files and Window List panels, showing all types of files and windows. If this button is dimmed, no filters are selected.
The Clear Filter button clears any filters that are set in the Recent Files and Window List panels, showing all types of files and windows. If this button is dimmed, no filters are selected.
![]() The New Project button creates a new project.
The New Project button creates a new project.
![]() The Open Project button opens a project file.
The Open Project button opens a project file.
![]() The Save Selected Project button saves the selected project.
The Save Selected Project button saves the selected project.
![]() The Close button closes the panel.
The Close button closes the panel.
Recent Files
The Recent Files list provides quick access to files that you recently opened.
Keep your favorite files at the top of the list for quick access. Place your cursor over the filename and click the pin icon ![]() . To unpin a file, click the pin icon
. To unpin a file, click the pin icon![]() .
.
You can drag and drop files from the Recent Files list, as follows:
•Into a JMP project to add the file
•Into the JMP Window List to open the file
•Into a Windows folder or on to your desktop to create a copy of the file
•Into applications such as Notepad or Microsoft Word to edit the file
Right-click files to access the following options:
•Open a file
•Copy the location path to a file
•Open a file within the folder that contains it
•Sort files alphabetically by name or by most recent
•Remove a file (alternatively, you can select files and press the DELETE key)
•(JSL scripts) Edit, run, or debug a script
•(Text files) Change the import method or open as plain text
•(SQL queries) Run an SQL query that you saved in Query Builder.
•Run or edit a JMP application
When you open a non JMP file from the Recent Files list, JMP applies your import preferences to arrange the data. You can right-click on a text file to change the import method or to open the file in a text editing window. Your import preference is bolded in the right-click menu.
Window List
The Window List shows open JMP windows, such as data tables, reports, and scripts. You can open, close, rearrange, and hide JMP windows.
•If you place your mouse pointer over a file in the Window List, a thumbnail appears.
•To open the Window List in its own window, select View > Window List.
•To display windows side-by-side, right-click the selected windows and select Arrange.
•To always automatically display the Window List inside maximized windows, select File > Preferences > Windows Specific and select Dock the Window List in maximized windows.
Right-click files to access the following options:
•View a window
•Close a window (alternatively, you can select files and press the DELETE key)
•Close all windows except the currently selected window (if the selected window is a report window, the dependent data table also remains open)
•Move a window to the back
•Hide or unhide a window (hides the window from the Windows taskbar)
•Select all windows, or clear all selections
Projects
In the Projects panel, you can use the project buttons to create a new project, open an existing project, and save a project. Right-click a project to add items to the project and customize the project. For details about projects, see “JMP Projects (Windows Only)” in the “Save and Share Data” chapter.
Tip: Select View > Projects to open the project list in a new window.
Rearrange Panels in the Home Window
To rearrange the panels in the Home Window, click and drag the title bar of the panel. Drop the title bar onto a top, bottom, left, or right arrow to position the panel. A blue box indicates where the panel will be placed. To turn the panels into tabs, drag and drop any panel into the middle of the Home Window.
Tip: To put the Home Window back into its original order, select View > Home Window Panes > Revert to Factory Layout.
JMP Home Window on Macintosh
Use the JMP Home window to quickly access JMP files and open windows.
•Open recent files in the Recent Files list.
•Open or close active JMP windows in the Window List.
•Add a recent file to the Favorites pane. Select the file in the Recent Files list, press Control, and select Add to Favorites. Select the favorite file, press Control, and select Remove from Favorites to remove the file from the list.
•Set an open data table as the current data table by selecting it from the Set Active Table list.
•Open the log.
The two buttons in the upper left corner of the JMP Home window let you manage recent files and favorites.
Click ![]() to show or hide the Favorites list.
to show or hide the Favorites list.
Click ![]() to remove files from the Recent Files list.
to remove files from the Recent Files list.
Open the JMP Home window on Macintosh by selecting Window > JMP Home (Figure 2.3). To view the window each time you open JMP, select JMP > Preferences > General > Home Window.
Figure 2.3 Example of the JMP Home Window (Macintosh)
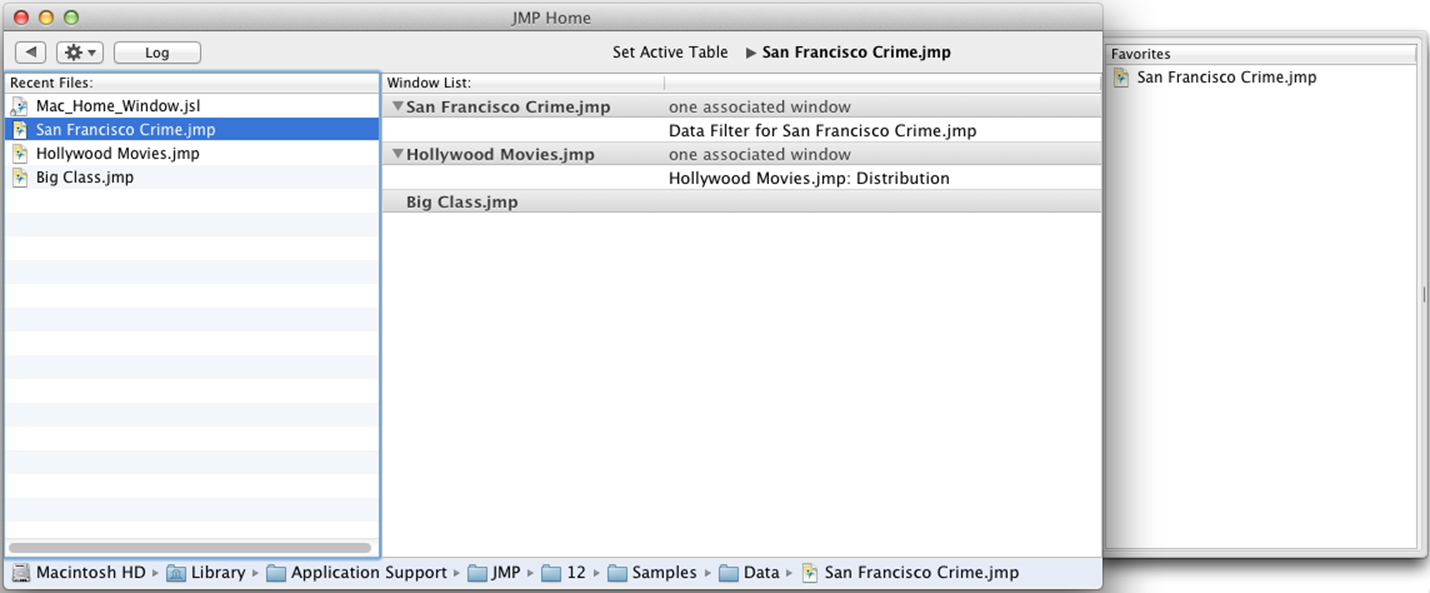
Tip: The Status bar area shows the path for the currently selected file. You can click on a folder to open the folder to view its contents.
Recent Files
The Recent Files list provides quick access to files that you recently opened.
You can drag files from the Recent Files list, as follows:
•into the Window List to open the file
•into the Favorites pane to save the file as a favorite
•outside the Favorites pane to remove it from the Favorites list
Press the Control key and select a file to access other options. For example, you can run or debug a JSL script by holding down the Control key and selecting Run Script or Debug Script.
Window List
The Window List shows open JMP windows, such as data tables, reports, and scripts.
•Press the Control key and click to close a window.
If the selected window is a parent to one or more children, a dialog appears, prompting you to Close, Cancel or Close All windows. Select Close All to close the parent and all its children windows.
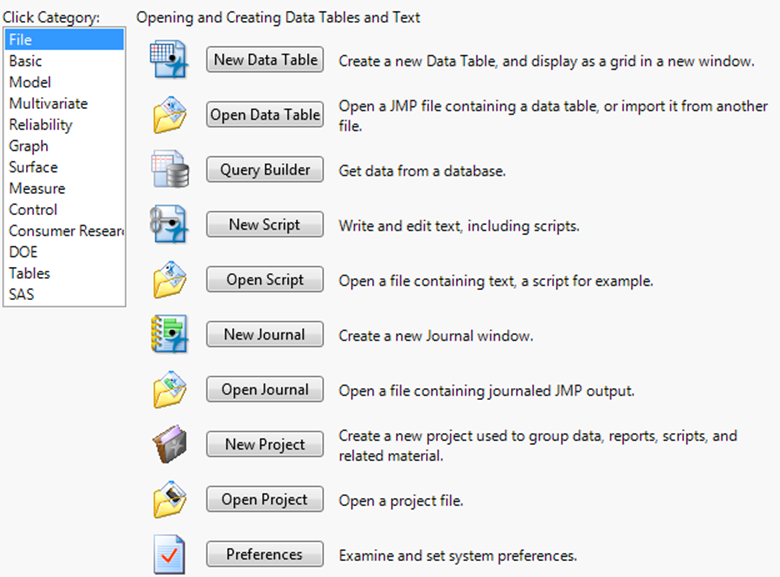
JMP Starter Window
The JMP Starter window is a good place to begin if you are not familiar with JMP or data analysis. Options are categorized and described, and you launch them by clicking a button. The JMP Starter window covers many of the options found in the Analyze, Graph, Tables, and File menus.
•To open the JMP Starter window, select View (Window on the Macintosh) > JMP Starter.
•To display the JMP Starter automatically when you open JMP on Windows, select File > Preferences > General, and then select JMP Starter from the Initial JMP Window list. On Macintosh, select this option on the JMP > Preferences > General page.
Figure 2.4 shows the JMP Starter window for Windows. The Macintosh JMP Starter window is identical.
Figure 2.4 The JMP Starter Window (Windows)
JMP Personalization Window
The very first time that you open JMP, the Personalization window appears. This window also appears if you re-install JMP and you do not have an existing preference file.
Figure 2.5 Personalization Window
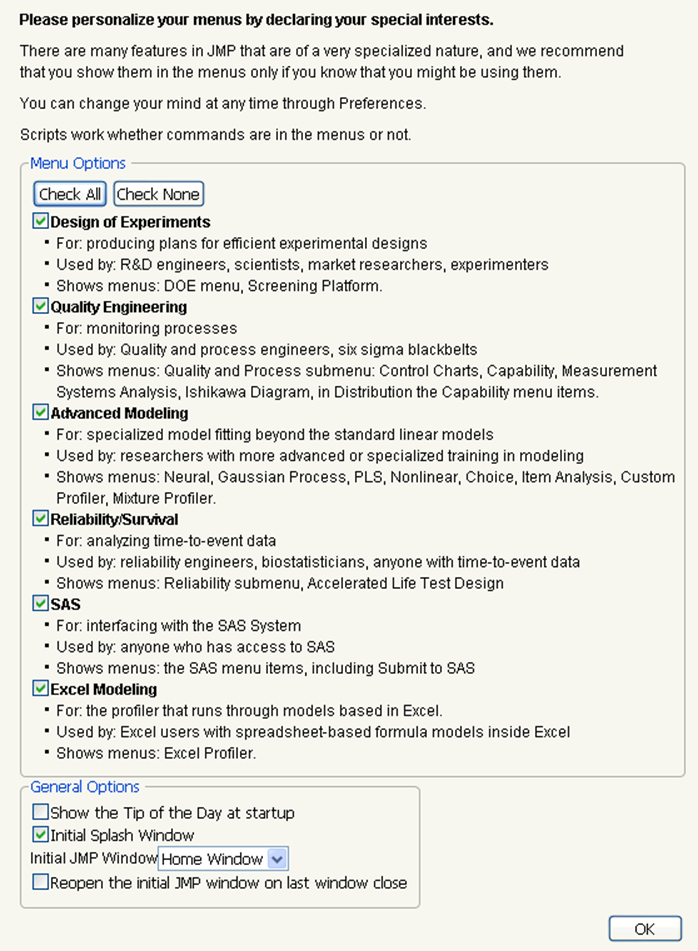
This window contains two panels:
Menu Options
Deselect any menu options that you want to hide from your JMP view.
General Options
Select from common general preferences. For more information about these preferences, see “General” in the “JMP Preferences” chapter.
Data Tables
In JMP, data points are organized into rows and columns referred to as the data table. A data table has two parts: the data table panels at left and the data grid at right.
Figure 2.6 Parts of a Data Table
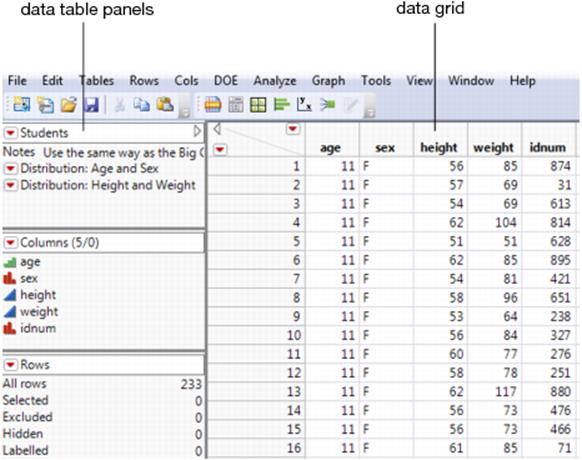
The data table has the following characteristics:
•Column names can contain any keyboard character, including spaces, and can be up to 255 characters long.
•The maximum length of the data table’s name depends on your computer’s operating system.
•Change the default size and font for names and values selecting File > Preferences > Fonts. (On the Macintosh, select JMP > Preferences > Fonts.)
•Column names automatically wrap in the column name area to accommodate the column width that you specify.
•Move column boundaries and enlarge the column to view long values. Adjust widths of all selected columns at once by pressing the Alt key as you drag the double arrow cursor on any of the selected column boundaries.
•The number of rows and columns in a data table is limited only by your computer’s memory.
Data Table Panels
Data tables contain three panels:
•Table panel
•Columns panel
•Rows panel
These panels are located on the left of the data grid. They contain information about the table and its contents. Each panel has interactive areas. See Figure 2.7.
Figure 2.7 Interacting with the Data Table Panels
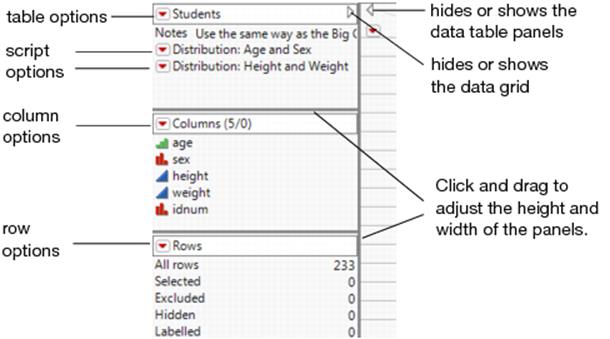
Table Panel
The Table panel contains the following elements:
•Name of the data table
•Icons indicating the table state
•Red triangle menus containing table and script options
•(Optional) Table variables
•(Optional) Table scripts
Figure 2.8 Example of a Table Panel
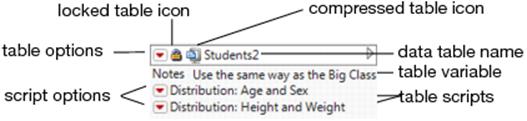
Table Options
Clicking on the red triangle menu next to the data table name shows these options:
Tables
Contains the same options as the Tables menu. See “Reshape Data” chapter.
New Table Variable
Creates a new table variable, which can be text or any other constant character value that you always want to be available in the data table. Table variables are normally used to document tables. Using the Formula Editor, you can incorporate table variables into formulas or JSL scripts. See“Use Table Variables” in the “Enter and Edit Data” chapter for more information.
Note: To rename a table variable, double-click on it and enter a new name in the Name field.
New Script
Creates a JSL script to save with the data table. Using the Formula Editor, you can incorporate these scripts into formulas. After selecting this command, name the script and type in the value (the JSL commands). After you click OK, the new script is listed in the Table panel and you can click its red triangle menu to run, edit, or delete it. See “Create and Save Scripts” in the “Enter and Edit Data” chapter.
Suppress Formula Eval
Turns off the feature that automatically evaluates formulas. You can turn off evaluation and build sections of a formula, and then turn evaluation on to test the formula.
Lock Data Table
Locks the data table so that data and column properties cannot be edited or added. You can still run analyses, assign characteristics, add rows and columns, and so on. See “Lock Tables” in the “Enter and Edit Data” chapter.
Compress file when saved
Compresses the data table when it is saved. After the data table is saved, a compressed file icon ![]() appears next to the data table name in the table panel. See “Compress Tables” in the “Enter and Edit Data” chapter.
appears next to the data table name in the table panel. See “Compress Tables” in the “Enter and Edit Data” chapter.
Tip: You can also configure JMP to always use GZ compression when saving tables by selecting Preferences > General > Save Data Table Columns GZ Compressed.
Note: The Compress file when saved option only decreases the file size. This command does not affect the memory required to analyze the data. To reduce both the file size and memory required for analyzing, use Cols > Utilities > Compress Selected Columns. See“Compress Selected Columns” in the “Enter and Edit Data” chapter.
Disable Undo
Removes all actions from the undo history and does not record future actions. Undos are disabled only while the data table is open; the setting is not saved with the data table. This option prevents memory overruns when you delete rows and perform other tasks in the data table.
Copy Table Script
Copies the script that re-creates the table. To re-create the table, paste the script into a new script and run it.
Rerun Formulas
Re-evaluates all columns containing formulas within the data table.
Script Options
Clicking on the red triangle menu next to a script name shows these options:
Run Script
Runs the script.
Tip: Run multiple table scripts at once by holding down the Control key, while selecting the table scripts you want to run. Then, right-click inside the empty area under the list of table scripts, and select Run Script.
Debug Script
Opens the script in the JSL Debugger.
Edit
Opens most scripts in the script editor so that you can edit it. Opens a JMP application script in Application Builder.
Delete
Deletes the script.
Copy
Copies the script. You can then paste it into the Table panel of another data table.
Additional Options
In the Table panel, you can also do the following actions:
•Double-click a table variable or script name to edit the name and content.
•Click and drag on a table variable or script to rearrange it.
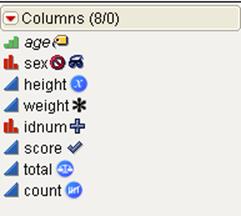
Columns Panel
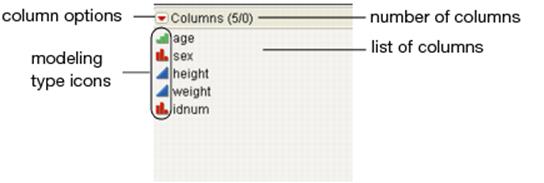
The Columns panel contains the following information:
•Column options (same options as the Cols menu)
•Total number of columns and number of columns selected in the data table
•A list of columns found in the data table
•Icons indicating each column’s modeling type (see “About Data Types and Modeling Types” in the “The Column Info Window” chapter)
•Icons representing characteristics and properties assigned to the columns (not shown, see Figure 2.10)
Figure 2.9 Example of a Columns Panel
Icons Representing Column Characteristics and Properties
Icons to the right of each column name indicate characteristics and properties the columns contain.
Figure 2.10 Icons Indicating Column Characteristics and Properties
Note: Italics indicate that the column is locked into place. When you scroll horizontally, the column remains visible.
Icons that can appear in the Columns panel are described as follows:
![]() Indicates that points on plots corresponding to the column are labeled by the value instead of the row number. See “Label Rows and Columns” in the “Enter and Edit Data” chapter.
Indicates that points on plots corresponding to the column are labeled by the value instead of the row number. See “Label Rows and Columns” in the “Enter and Edit Data” chapter.
![]() Indicates that the column is excluded from the calculations. See “Exclude Rows and Columns” in the “Enter and Edit Data” chapter.
Indicates that the column is excluded from the calculations. See “Exclude Rows and Columns” in the “Enter and Edit Data” chapter.
![]() Indicates that the column is not included in graphs. See “Hide Rows and Columns” in the “Enter and Edit Data” chapter.
Indicates that the column is not included in graphs. See “Hide Rows and Columns” in the “Enter and Edit Data” chapter.
![]() Can be X or Y. Indicates that the column has been assigned the preselected role of x or y. See “Assign a Preselected Analysis Role” in the “The Column Info Window” chapter.
Can be X or Y. Indicates that the column has been assigned the preselected role of x or y. See “Assign a Preselected Analysis Role” in the “The Column Info Window” chapter.
![]() Indicates that the column contains one or more properties. Click to reveal a list of properties the column contains.
Indicates that the column contains one or more properties. Click to reveal a list of properties the column contains.
![]() Indicates that the values in the column result from a formula. When formula evaluation is suppressed, the icon appears gray. Double-click to view and edit the formula. See “Use Formula Editor Options” in the “Formula Editor” chapter.
Indicates that the values in the column result from a formula. When formula evaluation is suppressed, the icon appears gray. Double-click to view and edit the formula. See “Use Formula Editor Options” in the “Formula Editor” chapter.
![]() Indicates that the range check or the list check option is turned on. Click to view and edit the range or list. See “Range Check” in the “The Column Info Window” chapter and “List Check” in the “The Column Info Window” chapter.
Indicates that the range check or the list check option is turned on. Click to view and edit the range or list. See “Range Check” in the “The Column Info Window” chapter and “List Check” in the “The Column Info Window” chapter.
![]() Indicates that the column has been assigned the preselected role of weight. See “Assign a Preselected Analysis Role” in the “The Column Info Window” chapter.
Indicates that the column has been assigned the preselected role of weight. See “Assign a Preselected Analysis Role” in the “The Column Info Window” chapter.
![]() Indicates that the column has been assigned the preselected role of frequency. See “Assign a Preselected Analysis Role” in the “The Column Info Window” chapter.
Indicates that the column has been assigned the preselected role of frequency. See “Assign a Preselected Analysis Role” in the “The Column Info Window” chapter.
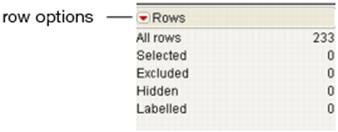
Rows Panel
The Rows panel contains the following information:
•Row options (same options as the Rows menu)
•Total number of rows
•Number of selected (highlighted), excluded, hidden, and labeled rows
Figure 2.11 Example of a Rows Panel
Right-click the categories in the Rows panel to select rows, clear the selection, or to create a data view.
A data view creates a linked subset of the main data table. For example, if several rows are marked hidden, you might want to open a window that shows you only the hidden rows. Right-click Hidden in the Rows panel and select Data View.
Figure 2.12 Creating a Data View from the Rows Panel
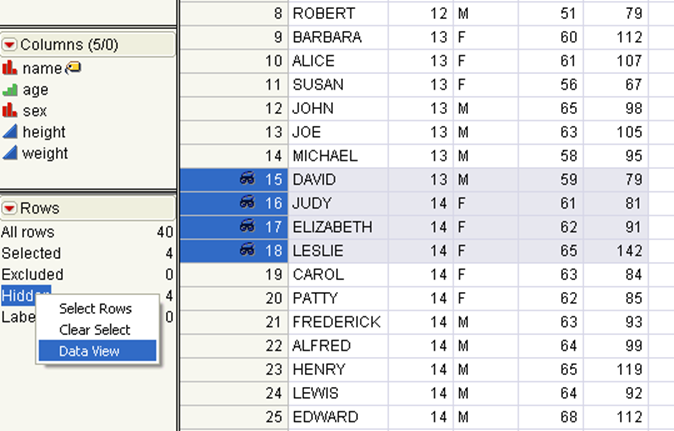
When using a data view, continue to do most of your editing in the main data table. When you make changes in either the main data table or in the data view, the changes are reflected in both. You can make minor changes (such as changing some data or adding a column) in the data view. However, if you want to make major changes (like adding a formula) you must make those changes in the main data table.
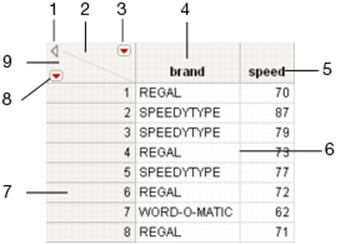
Data Grid
The data grid is the main part of the data table that contains your data. Figure 2.13 illustrates how to interact with the data grid. See also “Select Rows” in the “Enter and Edit Data” chapter.
Figure 2.13 Interacting with the Data Grid
|
No. |
Description |
|
1 |
Hides or shows the data table panels. |
|
2 |
Click to deselect any selected columns. To select all columns, hold down the Shift key and click. |
|
3 |
Shows the columns menu. |
|
4 |
Click to select the column. Double-click to view the Column Info window. See “The Column Info Window”. Right-click for column options. See “Context Menu for Columns”. |
|
5 |
Double-click the column name to edit it in the Column Info window, or select the column name and press Enter. |
|
6 |
Click and drag to adjust the width of the column. To simultaneously adjust the widths of all of the selected columns, hold down the Alt key as you click and drag. |
|
7 |
Click to select the row. Double-click to open the Row Editor. See “Use the Row Editor” in the “Enter and Edit Data” chapter. Right-click for row options. See “Context Menu for Rows”. |
|
8 |
Shows the rows menu. |
|
9 |
Click to deselect all selected rows. To select all rows, hold down the Shift key and click. |
Context Menu for Columns
Right-clicking in a column heading shows these options:
Column Info
Opens the Column Info window. See “The Column Info Window”.
Standardize Attributes
Assigns the same attributes or properties to all of the selected columns. See “Standardize Attributes and Properties across Columns” in the “The Column Info Window” chapter.
Column Properties
Contains a list of column properties. Select one to open the Column Info window and apply it to the column. This list is also available from the Column Info window. See “Column Properties” in the “The Column Info Window” chapter.
Modeling Type
Contains a list of modeling types. Select one to apply it to the column. See “About Data Types and Modeling Types” in the “The Column Info Window” chapter.
Preselect Role
Contains a list of roles. Select one to apply it to the column. See “Assign a Preselected Analysis Role” in the “The Column Info Window” chapter.
Formula
Opens the Formula Editor. See the “Formula Editor” chapter.
New Formula Column
Converts the column to a formula column. See “Make New Formula Column” in the “Enter and Edit Data” chapter for details.
Color Cells
Provides a color palette. Select a color to apply it to the selected cells in the column. To revert back to the original color, select black.
Use Value Labels
(Applicable only if the Value Labels property is set) Shows or hides value labels in the data table.
Label/Unlabel
Labels or unlabels selected columns in all plots. See “Label Rows and Columns” in the “Enter and Edit Data” chapter.
Scroll Lock/Unlock
Scroll lock locks a column in place so that when you scroll horizontally, the column remains visible. See “Lock Columns in Place” in the “Enter and Edit Data” chapter.
Hide/Unhide
Hides or shows selected columns in all plots and graphs. See “Hide Rows and Columns” in the “Enter and Edit Data” chapter.
Exclude/Unexclude
Excludes or includes selected columns from analyses. See “Exclude Rows and Columns” in the “Enter and Edit Data” chapter.
Data Filter
Opens the Data Filter. See “The Data Filter” in the “JMP Platforms” chapter.
Sort
Sorts all of the rows in the table by the values in the selected column. You can choose to sort the rows in ascending or descending order.
Delete Columns
Deletes all selected columns.
Copy Column Properties
Copies all of the column properties for the selected column.
Paste Column Properties
Pastes all of the copied column properties into the selected column.
Copy Multi Columns Properties
Copies all of the column properties for the selected columns. Supports adjacent and non-adjacent columns.
Paste Multi Columns Properties
Pastes all of the copied column properties into the selected adjacent or non-adjacent columns. For example, select column one and column two and then select Copy Multi Column Properties. Select column three and column five and then select Paste Multi Column Properties. Column one properties are pasted into column three. Column two properties are pasted into column five.
Context Menu for Rows
Right-clicking in a row heading shows these options:
Hide and Exclude
Hides the selected rows in all plots and graphs and excludes them from analyses. See “Hide and Exclude Rows” in the “Enter and Edit Data” chapter.
Exclude/Unexclude
Excludes or includes selected rows from analyses. See “Exclude Rows and Columns” in the “Enter and Edit Data” chapter.
Hide/Unhide
Hides or shows selected rows in all plots and graphs. See “Hide Rows and Columns” in the “Enter and Edit Data” chapter.
Label/Unlabel
Labels or unlabels selected rows in all plots. See “Label Rows and Columns” in the “Enter and Edit Data” chapter.
Colors
Provides a color palette. Select a color to apply it to the selected rows. The color is used in plots and graphs. See “Assign a Color to Rows” in the “Enter and Edit Data” chapter.
Markers
Provides a palette of markers or symbols. Select a marker to apply it to the selected rows. The marker is used in plots and graphs instead of points. See “Add Markers to Rows” in the “Enter and Edit Data” chapter.
Color Rows by Row State
Colors the row the same as the current row state color. For more details, see “Assign Colors or Markers to Rows Based on Column Values” in the “Enter and Edit Data” chapter.
Select Matching Cells
Selects rows in the active data table with values that match the selected row(s).
Invert Selection
Selects all previously deselected rows, and deselects all currently selected rows.
Clear Row States
Clears all active row states in the data table. All rows become included, visible, unlabeled, and show in plots as black dots. It does not affect row states saved in row state columns.
Add Rows
Adds the specified number of rows to the data table. See “Add Rows” in the “Enter and Edit Data” chapter.
Delete Rows
Removes all selected rows from the data table. Use the Undo command on the Edit menu to undo an accidental deletion. See “Delete Rows and Columns” in the “Enter and Edit Data” chapter.
Cursor Forms
The cursor takes different forms, depending on its location in the data grid.
Arrow Cursor ![]()
The standard arrow cursor appears in the following locations:
‒In the panels area to the left of the data table
‒In the triangular rows and columns area, located in the upper left corner of the data grid
‒In the middle or bottom of a column heading
You can perform the following actions with the arrow cursor:
‒To select a column using the arrow cursor, click its name in the Columns panel.
‒Double-click a column name in the Columns panel to edit it. Or, in the column heading, double-click on the column name to edit it.
‒Click the triangular areas in the upper left corner of the data grid to deselect rows and columns.
Selection (Large Plus) Cursor ![]()
When the cursor is at the top of a column heading, or in a row number area, it becomes a large plus, indicating that you can select rows or columns. When you click, that row or column is selected and highlighted. Click and drag to select multiple rows or columns, and hold down the Control key and click to select discontiguous rows or columns.
‒Double-click a column heading area to see the Column Info window for that column.
‒Select a column to change the column name. The column highlights. Begin typing (if it is not in a locked column or locked data table).
‒Double-click the row number area to edit the rows using the Row Editor.
I-beam Cursor ![]()
When you select editable text, the cursor becomes a standard I-beam. To edit text, position the I‑beam within highlighted text. Click to mark an insertion point, or drag to select text for replacement.
Double Arrow Cursor ![]()
The cursor changes to a double arrow when it is on a column or a panel boundary. Drag this cursor left or right to change the width of a column or panel. Changing the width of a column does not affect the column field width specified in the Column Info window (accessed by double-clicking a column name).
Tip: You can adjust widths of all selected columns at once by pressing the Alt key as you drag the double arrow cursor on any of the selected column boundaries.
List Check Cursor ![]()
The cursor changes form when you move the mouse over values in columns that have data validation in effect. It becomes a small, downward-pointing arrow on a column with list checking. When you click, the value is highlighted and the cursor becomes the I-beam. Enter or edit data as usual with any values defined as valid text or valid numbers. See “List Check” in the “The Column Info Window” chapter, for details.
Pointer Cursor ![]()
The cursor changes to a pointer over these objects:
‒Red triangle menus for options
‒Triangular disclosure buttons that open or close panels
‒Data table titles for editing
‒Table script titles for opening
‒Modeling type icons for changing
Open Data File Options
Note: For more details about opening files, see the “Import Your Data” chapter.
To open a data file, select File > Open and select the file type. Some file types have additional features and options that appear in the Open Data File window. See Table 2.1.
Tips:
•Windows only: To open the same file type every time, select the Select this filter the next time this window is invoked check box.
•Open a file by dragging it onto the JMP Home Window.
•To change which directory the File > Open command looks in, see “File Locations” in the “JMP Preferences” chapter.
|
Table 2.1 File > Open Options by File Type |
|
|
File Type |
Additional Features and Options |
|
JMP Data Tables |
Table notes, the number of columns (Cols), and the number of rows appear. Use the Select Columns option to select which columns are imported into the data table. On Windows, click the arrow next to Open and then use the Select Columns option to specify which columns are imported into the data table. On Macintosh, you can select which columns to import after you click Open. |
|
Excel Files |
•Import the file in the Excel Import Wizard by default to customize the layout and preview the data before you import it. •Click the arrow next to Open and then select one of the options. Convert the first spreadsheet row into column headings. |
|
Text Files |
•To automatically determine data arrangement, select one of the following options: ‒Open as data using preferences ‒Open as data using a best guess ‒(Windows only) Open as plain text into a script window •To manually specify data arrangement, select the Data with preview option. See “Text Import Preview Options” in the “Import Your Data” chapter. |
|
SAS Data Sets (options are for Windows only) |
•Use SAS variables for column names •Enter a password when you open a password-protected data set. •(SAS Transport files only) Select columns before opening |
|
SPSS Data Files |
Use SPSS variable or label names for column names. |
|
All Files |
•To automatically determine data arrangement, select one of the following options: ‒Open as data using preferences ‒Open as data using a best guess ‒(Windows only) Open as plain text into a script window •To manually specify data arrangement, select the Data with preview option. •(Windows only) To open text files using your computer’s default text editor, select Use default program to open. |
Close Multiple Files
On Windows, close several files at once from the JMP Home Window. Select the files, right-click, and select Close.
On Macintosh, select File > Close Multiple and then select the files that you want to close.
Display and Arrange Open Windows
In JMP, typically you have several windows open at once (for example, data tables, reports, and the JMP Home Window). JMP provides several ways to arrange and display these open windows.
On Windows:
•Press the Control and Tab keys to switch between windows.
•Use the Reveal feature (F9 or Window > Reveal). See “Using the Reveal Feature”.
•Use the options in the Window menu. Note that Arrange options are also available using the Arrange Menu in the bottom right corner of most windows.
•To display the JMP Home Window, click the JMP Home Window button in the lower right corner of most windows, or hold down Control and press 1.
•To show the data table for a report, click View Associated Data button in the bottom right corner of the report.
Tip: If you cannot see the Arrange Menu, JMP Home Window, and View Associated Data buttons, select View > Status Bars.
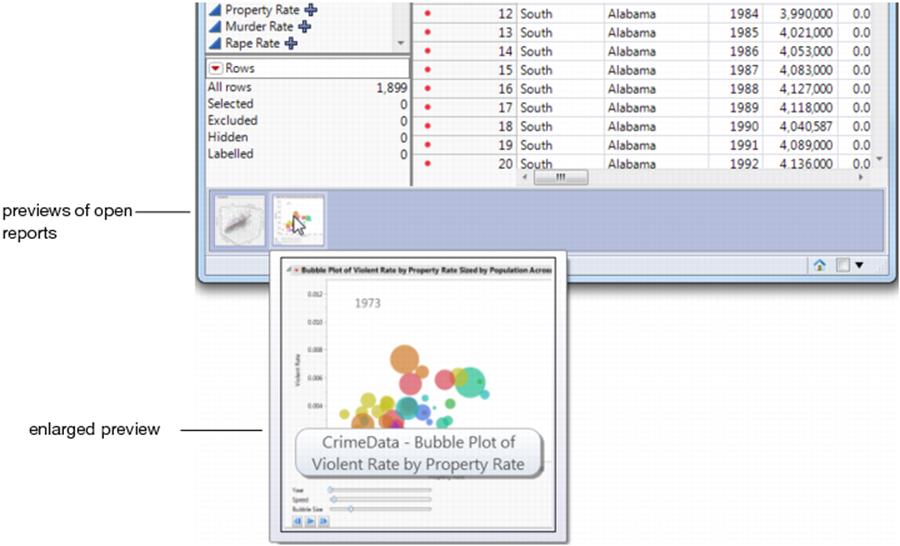
•To open an associated report when you are viewing a data table, double-click the thumbnail preview of the report in the bottom pane. To enlarge the preview, place your cursor over the thumbnail. See Figure 2.14.
Figure 2.14 Thumbnail Previews of Open Reports
On Macintosh:
•Use the options in the Window menu.
•Use the Expose feature (F9 or F3).
Using the Reveal Feature
On Windows, press F9 to use the Reveal feature. The Reveal feature shows a top-level window with thumbnails of all open JMP windows.
•Click on a window to activate it.
•Press the spacebar to turn on Preview mode, where a full-sized view of the thumbnail under the cursor appears in the center of the screen.
•By default, the windows are ordered to match the original ordering on the screen in a top-down, left-to-right order. Press S to sort the thumbnails by name.
•To exit the Reveal feature, press F9, Esc, or Alt and Tab and then select another application.
Preview JMP Files
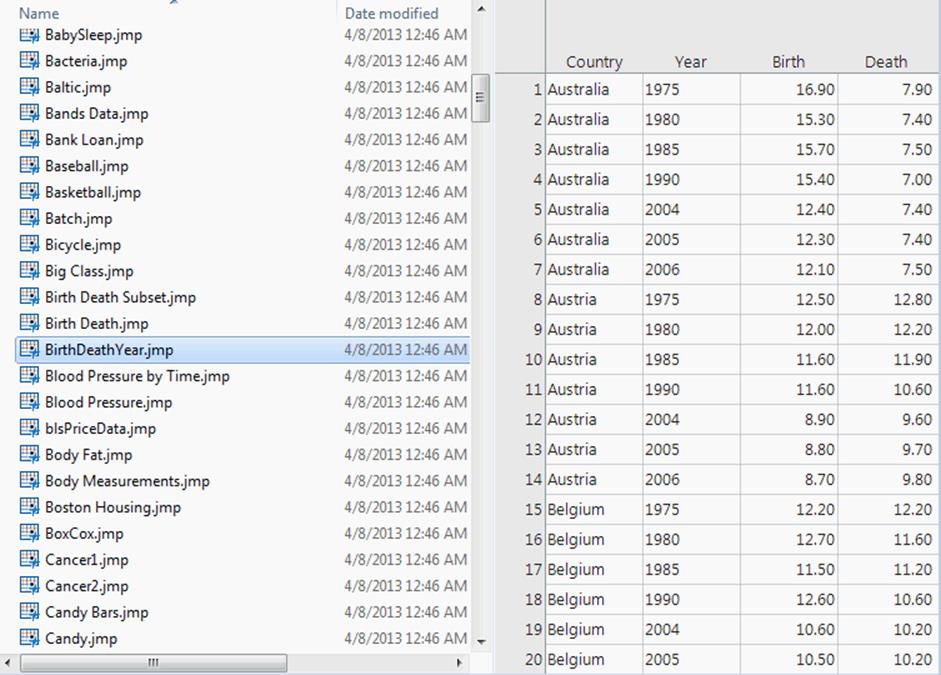
For some JMP file types, you can use Windows Explorer or the Macintosh Finder to view a portion of the selected file. Windows supports a preview of JMP data tables, journals, and scripts. Macintosh supports a preview of data tables and scripts.
To preview a JMP file
1.In Windows Explorer or the Macintosh Finder, select the file that you want to preview.
2.In Windows Explorer, select theShow the preview panebutton in the upper right corner. Support in e-mail programs varies.
In the Macintosh Finder, select the file and press the spacebar, or select the Quick Look option on the context menu or File menu. In Mail, select the Quick Look Attachment option on the context menu or File menu.
The preview pane shows a portion of the selected file.
Figure 2.15 Data Table Preview Pane (Windows)
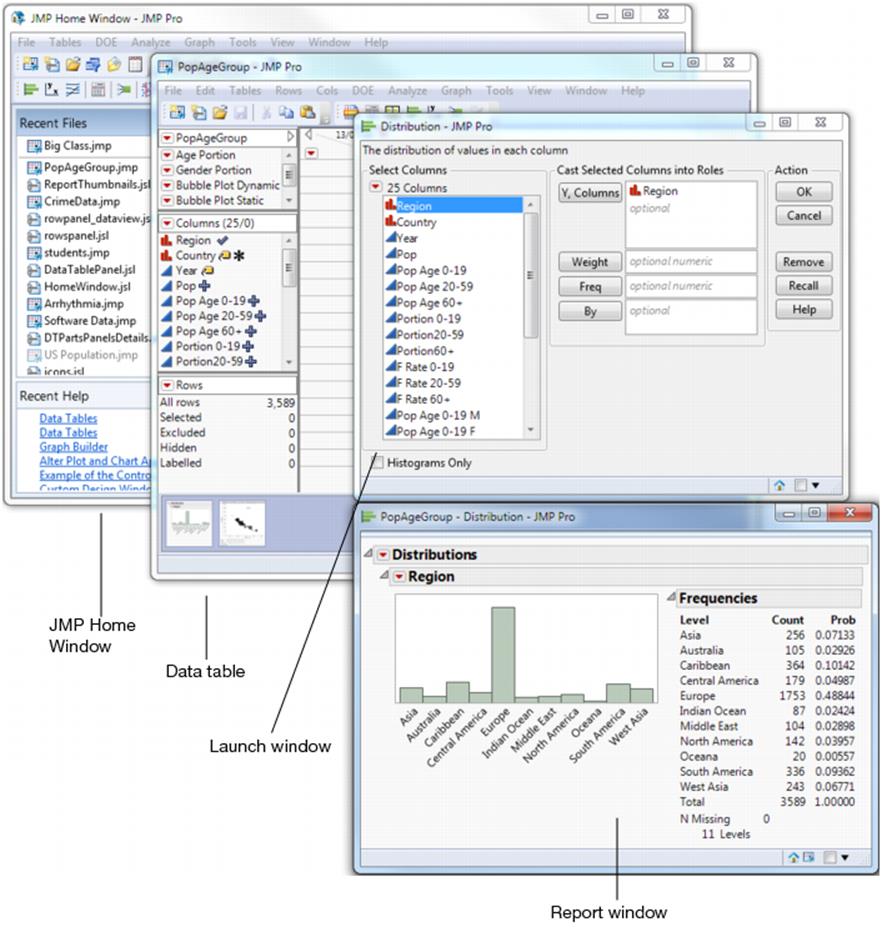
Anatomy of a JMP Session
Figure 2.16 Anatomy of a Typical JMP Session on Windows
JMP Home Window Actions
Your files, windows, projects, and recent help can be accessed and managed from the Home Window. See “Manage JMP Files and Open Windows”.
Figure 2.17 JMP Home Window Actions
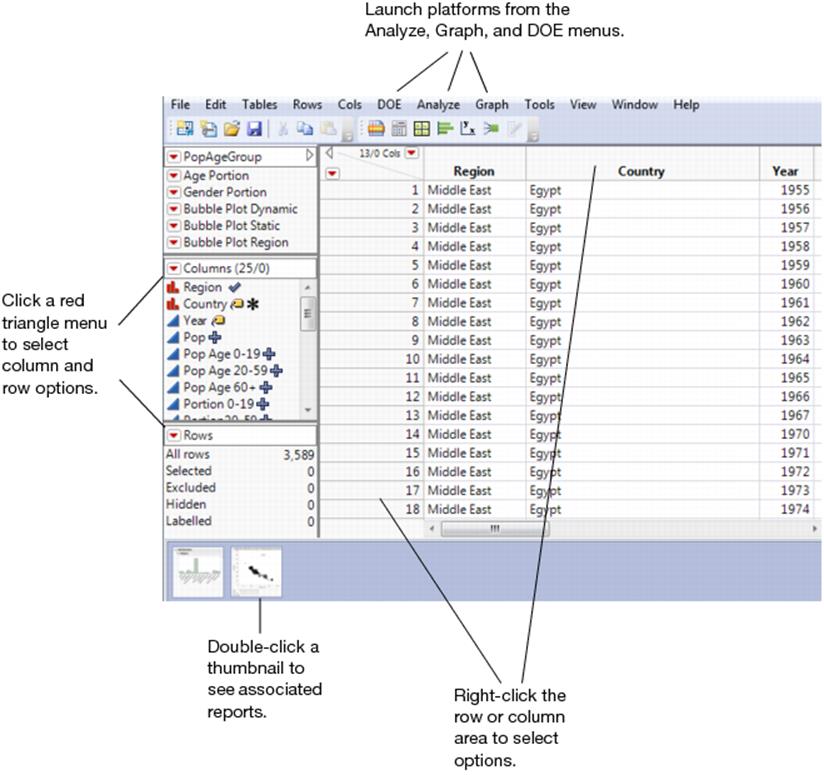
Data Table Actions
You can enter, view, edit, and manipulate data using data tables. In a data table, each variable is a column, and each observation is a row. See “Data Tables”.
Figure 2.18 Data Table Actions
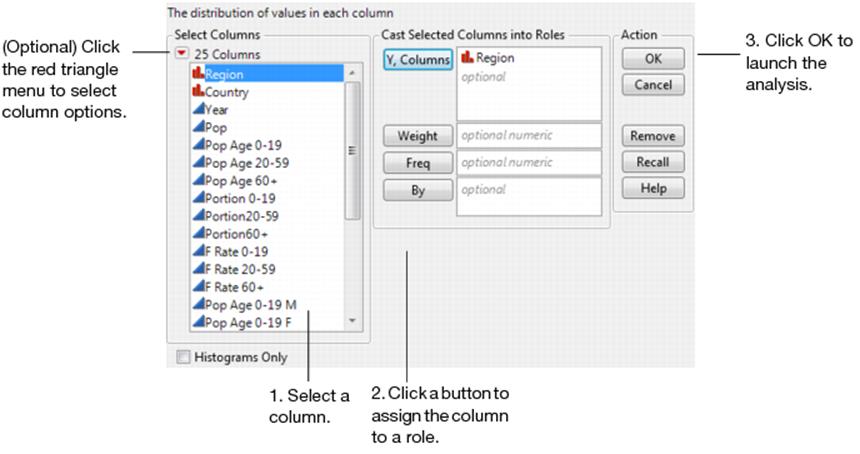
Launch Window Actions
Specify your analysis using the launch window for the type of analysis that you want to run. For example, Figure 2.16 shows the Distribution launch window. See “Launch Windows” in the “JMP Platforms” chapter.
Figure 2.19 Launch Window Actions
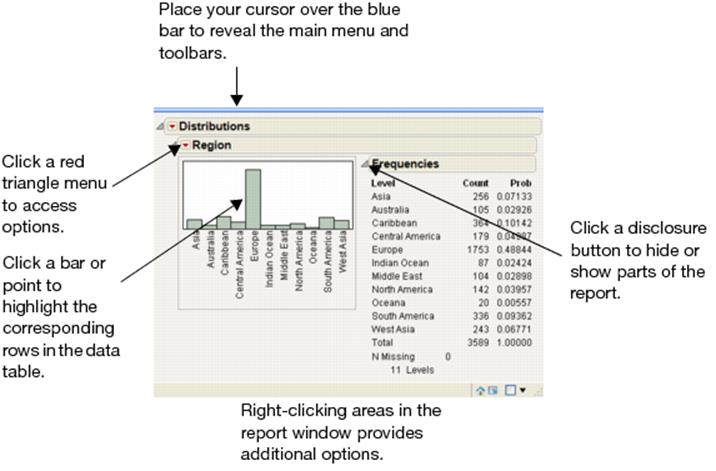
Report Window Actions
Once you launch your analysis, the report window appears. The report window shows the output of your analysis using interactive graphs and text reports. See the “JMP Platforms” chapter.
Figure 2.20 Report Window Actions
All materials on the site are licensed Creative Commons Attribution-Sharealike 3.0 Unported CC BY-SA 3.0 & GNU Free Documentation License (GFDL)
If you are the copyright holder of any material contained on our site and intend to remove it, please contact our site administrator for approval.
© 2016-2026 All site design rights belong to S.Y.A.