MariaDB Cookbook (2014)
Chapter 8. Performance and Usage Statistics
In this chapter, we will cover the following recipes:
· Installing the Audit Plugin
· Using the Audit Plugin
· Using engine-independent table statistics
· Using extended statistics
· Enabling the performance schema
· Using the performance schema
Introduction
There are several ways of tracking and measuring our usage of MariaDB. Some, such as the MariaDB Audit Plugin, come from third parties. Others, such as the performance schema, are built in. All of this helps us know what is happening on our server so that we can track our current usage better, analyze long term performance trends, and plan for our future needs.
The recipes in this chapter introduce several auditing and tracking features that we can enable in MariaDB.
Installing the Audit Plugin
There are many third-party tools that can enhance our MariaDB server. The Audit Plugin from SkySQL is one of them. This plugin is used by organizations to comply with government regulations that require the tracking and auditing of access to sensitive data.
Getting ready
Locate the plugin directory on your local machine. This can be done by connecting to MariaDB using the mysql command-line client and then running the following command:
SHOW GLOBAL VARIABLES LIKE 'plugin_dir';
The directory displayed is our local MariaDB plugin directory.
How to do it...
1. Download the appropriate version of the MariaDB Audit Plugin (either Windows or Linux) from the SkySQL downloads page available at http://www.skysql.com/downloads/.
2. On Windows, navigate to the location where we downloaded the plugin ZIP file and unpack it by right-clicking on the file in Windows Explorer and choosing Extract all....
3. On Linux, navigate to the location where we downloaded the plugin TAR file and unpack it either by right-clicking on the file and choosing Extract Here in our file manager or by using the tar command in a terminal window using the following command:
4. tar -zxvf server_audit-1.1.5.tar.gz
5. When the file is unpacked, there will be a directory corresponding to the name of the file. Inside the directory, there are subdirectories for 32-bit and 64-bit computers and for debug versions of the plugin. Navigate to the non-debug directory that corresponds to our machine. Most likely, this will be 64-bit. Inside the directory, there will be a file named server_audit.so or server_audit.dll. This is the plugin for Linux and Windows respectively.
6. Copy the plugin to our local MariaDB plugin directory. On Windows, we could select the file, copy it with Ctrl + C, navigate to the plugin directory, and paste it with Ctrl + V. On Linux, we can use the following command (altered to point at wherever our local plugin directory is):
7. sudo cp -avi server_audit.so /usr/lib64/mysql/plugin/
8. With the plugin in place, we now open the mysql command-line client and run the following command to install and activate the plugin:
9. INSTALL PLUGIN server_audit SONAME 'server_audit.so';
10. Run the SHOW PLUGINS; command to verify that the audit plugin is present in the list of installed plugins.
How it works...
The Audit Plugin is not included with MariaDB, so we need to download and install it manually. The procedure we use in this recipe also applies to installing other third-party plugins. Some plugins that we may choose to use will come as source code that we need to compile before we can install them. Other plugins, such as the Audit Plugin, come precompiled and are ready to use once we've copied them to the correct location.
After the plugin is in the plugin directory, we need to let MariaDB know that it exists and we want to use it. We do this with the INSTALL PLUGIN command, just as we would for plugins that ship with MariaDB and are not activated by default.
Finally, we verify that MariaDB has loaded the plugin by running the SHOW PLUGINS; command. If the plugin appears in the output, then we know that it has been installed.
There's more...
If we want to remove the server_audit plugin, we will use the following command:
UNINSTALL PLUGIN 'server_audit';
If we are using the Audit Plugin to comply with a regulation, we may want to restrict the ability to uninstall the plugin. To do this, we add the following code to the [mysqld] section of our my.cnf or my.ini file:
plugin-load=server_audit=server_audit.so
server_audit=FORCE_PLUS_PERMANENT
Once we have added the code, we need to restart MariaDB to activate the change. Once we do so, any attempt to uninstall the plugin will result in an error, and the plugin will remain installed.
See also
· The full documentation of the MariaDB Audit Plugin is available from SkySQL or in the MariaDB Knowledge Base at https://mariadb.com/kb/en/mariadb-audit-plugin/
· The following Using the Audit Plugin recipe covers configuring and using the plugin
Using the Audit Plugin
Installing the MariaDB Audit Plugin, as described in the previous recipe, doesn't do a whole lot for us. In order to get the most out of this plugin, we need to configure it. That is what this recipe is about.
Getting ready
Complete the Installing the Audit Plugin recipe described earlier in this chapter to install the Audit Plugin, prior to using the Audit Plugin.
How to do it...
1. Connect to MariaDB using the mysql command-line client with a user that has the SUPER privilege.
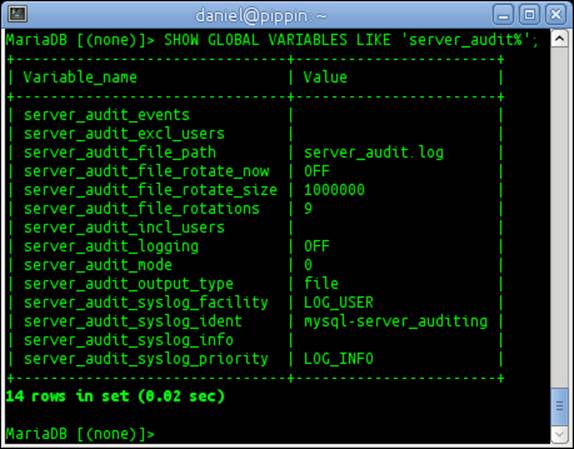
2. Show the Audit Plugin variables with the following command:
3. SHOW GLOBAL VARIABLES LIKE 'server_audit%';
The preceding command displays an output similar to the following screenshot:
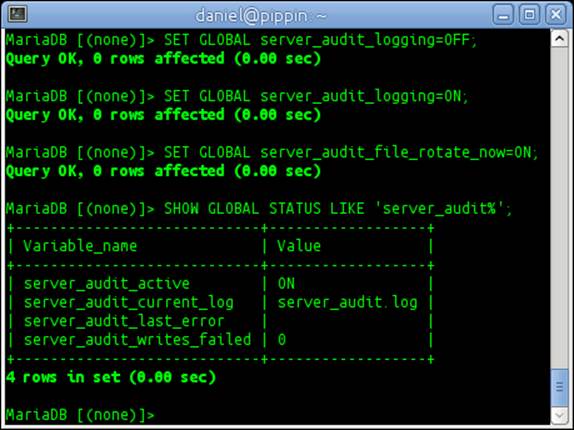
4. Turn off the audit logging with the following command:
5. SET GLOBAL server_audit_logging=OFF;
6. Turn on the audit logging with the following command:
7. SET GLOBAL server_audit_logging=ON;
8. Force the audit logfile to rotate immediately with the following command:
9. SET GLOBAL server_audit_file_rotate_now=ON;
10. Show the location of the current logfile, whether the plugin is active (ON), and whether there are any errors with the following command:
11.SHOW GLOBAL STATUS LIKE 'server_audit%';
The preceding command displays an output similar to the following screenshot:
12. Add the untrusted_user and untrusted_user2 users to the list of users to audit and then check that they were added with the following commands:
13.SET GLOBAL server_audit_incl_users = 'untrusted_user';
14.SET GLOBAL server_audit_incl_users =CONCAT(@@global.server_audit_incl_users, ',untrusted_user2');
15.SHOW GLOBAL VARIABLES LIKE 'server_audit_incl_users';
The preceding commands display an output similar to the following screenshot:

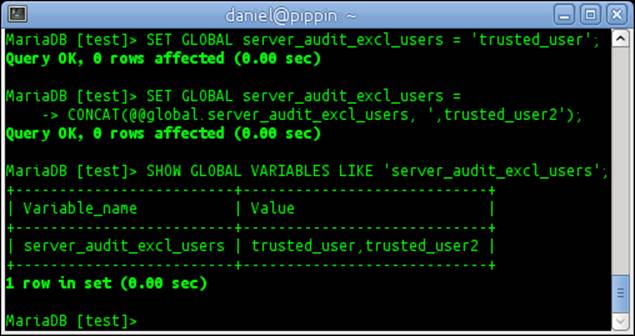
16. Exclude the trusted_user and trusted_user2 users from audit logging and then verify that they are excluded with the following commands:
17.SET GLOBAL server_audit_excl_users = 'trusted_user';
18.SET GLOBAL server_audit_excl_users = CONCAT(@@global.server_audit_excl_users, ',trusted_user2');
19.SHOW GLOBAL VARIABLES LIKE 'server_audit_excl_users';
The preceding commands display an output similar to the following screenshot:
How it works...
Configuring the Audit Plugin is similar to configuring any other feature of MariaDB. Like many variables, the Audit Plugin variables can be set dynamically while the server is running. To make our settings permanent, we need to add them to the [mysqld] section of our my.cnf or my.ini file.
By default, the Audit Plugin will track all users. We can limit the plugin to just track certain users by using the server_audit_incl_users variable. Likewise, we can exclude specific users from being audited by using the server_audit_excl_users variable.
When we use these variables, the Audit Plugin tracks the users listed without regard to the user's hostname. This is because for auditing and regulatory purposes, where the user is connecting from is not as important as what they are doing while connected. The location of users is still tracked, but if we, for example, add the untrusted_user to the server_audit_incl_users variable, all the following users will be tracked:
· untrusted_user@'localhost'
· untrusted_user@'192.168.1.%'
· untrusted_user@'%'
There's more...
If a user appears in both the server_audit_incl_users and server_audit_excl_users variables, the user will be logged. This is because the include variable has priority over the exclude variable.
See also
· The full documentation of the Audit Plugin is available from SkySQL or in the MariaDB Knowledge Base at https://mariadb.com/kb/en/mariadb-audit-plugin/
· The previous Installing the Audit Plugin recipe covers downloading and installing the plugin
Using engine-independent table statistics
MariaDB includes a facility to gather statistics on all tables, no matter what storage engine those tables use. The MariaDB optimizer can use these statistics to better calculate the optimum query plans.
How to do it...
1. Connect to MariaDB using the mysql command-line client with a user that has the SUPER privilege.
2. Run the following command:
3. SET GLOBAL use_stat_tables=complementary;
4. Force an update of the table statistics for a table with the following command (change table_name to the name of an existing table):
5. ANALYZE TABLE table_name;
6. View the collected table, index, and column statistics with the following commands:
7. SELECT * FROM mysql.table_stats;
8. SELECT * FROM mysql.index_stats;
9. SELECT * FROM mysql.column_stats;
How it works...
How MariaDB uses the engine-independent table statistics is controlled by the use_stat_tables variable. There are three valid values: never means that MariaDB will not use the statistics, complementary means that MariaDB will use the statistics if similar statistics are not provided by the storage engine, and preferably means that MariaDB will always use the statistics and only fall back on the statistics provided by the storage engine if they don't exist elsewhere.
We can force an update of the table's statistics using the ANALYZE TABLE command. If the table's statistics are already up to date when we force an update, the output of the ANALYZE TABLE command will say so.
Full table and index scans are used when collecting statistics. Depending on the size of our table or index and how busy our server is, this could be an expensive operation. Often, the benefits outweigh the cost, but it is something to keep in mind.
In certain cases, it may be preferable to only collect statistics on certain columns or indexes. The ANALYZE TABLE command in MariaDB allows this. For example, to only gather statistics on certain columns and indexes of a table, the following syntax is used:
ANALYZE TABLE table_name PERSISTENT FOR
COLUMNS (column_1,column_2,...)
INDEXES (index_1,index_2,...);
There's more...
The use_stat_tables variable also controls the behavior of the ANALYZE TABLE command. When the variable is set to never, the command will only update the statistics provided by the storage engine, and engine-independent statistics will not be gathered. If the variable is set to either complementary or preferably, then both the engine-independent and storage-engine-provided statistics will be updated when the ANALYZE TABLE command is run.
See also
· The full documentation of engine-independent table statistics is available at https://mariadb.com/kb/en/engine-independent-table-statistics/
Using extended statistics
MariaDB includes a powerful feature for collecting extended user statistics. These statistics can be used to better understand how our server is behaving and to locate and identify the sources of our server's load.
How to do it...
1. Connect to MariaDB using the mysql command-line client with a user that has the SUPER privilege.
2. Enable statistics collection with the following command:
3. SET GLOBAL userstat=1;
4. Run the following commands to show the statistics collected since collection was enabled:
5. SHOW CLIENT_STATISTICS;
6. SHOW INDEX_STATISTICS;
7. SHOW TABLE_STATISTICS;
8. SHOW USER_STATISTICS;
9. Run the following commands to flush the statistics by resetting the statistics counters to zero:
10.FLUSH CLIENT_STATISTICS;
11.FLUSH INDEX_STATISTICS;
12.FLUSH TABLE_STATISTICS;
13.FLUSH USER_STATISTICS;
How it works...
Extended statistics collection is off by default so that it does not cause unnecessary or unwanted load on the server. Enabling it is easy though and if desired, statistics gathering can be turned on and off at will. This can be very useful for gathering statistics on a busy server while minimizing the impact on that server.
There are four types of statistics that are collected: CLIENT, INDEX, TABLE, and USER statistics. The statistics are stored in the information_schema database in the CLIENT_STATISTICS, INDEX_STATISTICS, TABLE_SATISTICS, and USER_STATISTICS tables respectively. The SHOWcommand provides an easy way to view the collected statistics, but we can also directly query the tables in the information_schema database if we want a custom view of the data.
The type of data gathered includes features such as the total number of connections; the number of simultaneous (concurrent) connections; the number of bytes sent and received; the number of rows read, sent, or deleted; and so on.
There's more...
To turn on extended statistics so that it is always on, we need to add the following code to the [mysqld] section of our my.cnf or my.ini file:
userstat = 1
Keeping the extended statistics collection on all the time is OK if our database server is not very busy. However, if it is very busy and we need to gather statistics so that we know how the server is being used, we should only enable the statistics collection manuallyand then only for brief periods.
See also
· The full documentation of the user statistics feature is available at https://mariadb.com/kb/en/user-statistics/
Enabling the performance schema
The performance schema is a tool that we can use to monitor our server performance. It is disabled by default, but it can easily be enabled.
How to do it...
1. Open our my.cnf or my.ini file and add the following code to the [mysqld] section:
performance_schema
2. Restart MariaDB.
3. Connect to MariaDB using the mysql command-line client.
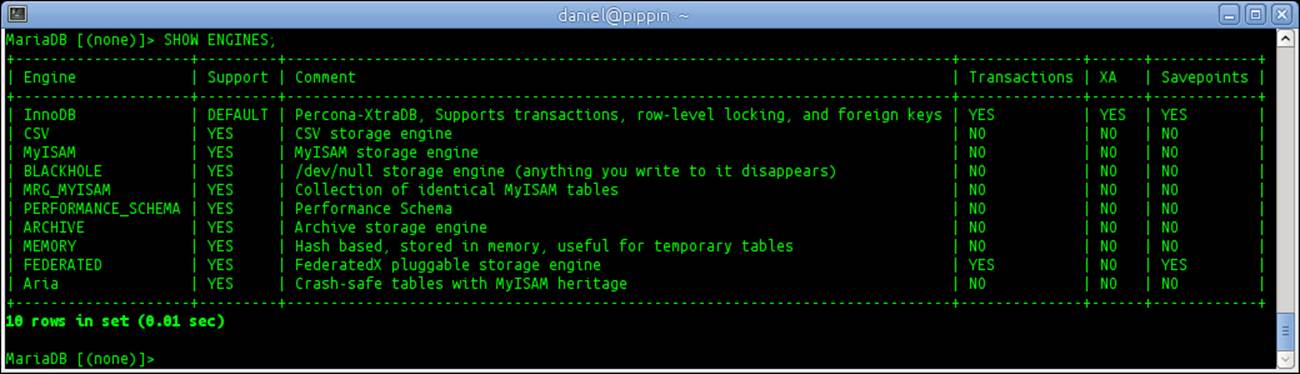
4. Run the SHOW ENGINES; command and verify that PERFORMANCE_SCHEMA is listed. The performance schema entry will look similar to the following screenshot:
5. Switch to the performance_schema database using the following command:
6. USE performance_schema;
7. Show the performance schema tables using the following command:
8. SHOW TABLES;
How it works...
The performance schema is implemented as a storage engine. This is why it shows up alongside other storage engines when we use the SHOW ENGINES; command. However, it is not a storage engine for storing data. The purpose of the performance schema is to help us monitor server performance and when it is enabled, the performance schema creates a special performance_schema database that includes several tables that we can query to monitor our server performance.
There's more...
If we try to create a table with the performance schema as the engine, we will get the following error:
ERROR 1005 (HY000): Can't create table 'test'.'t1' (errno: 131 "Command not supported by database")
See also
· The full documentation of the performance schema is available at https://mariadb.com/kb/en/performance-schema/
Using the performance schema
Using the performance schema is similar to querying a table or set of tables.
Getting ready
Enable the performance schema as described in the Enabling the performance schema recipe earlier in this chapter.
How to do it...
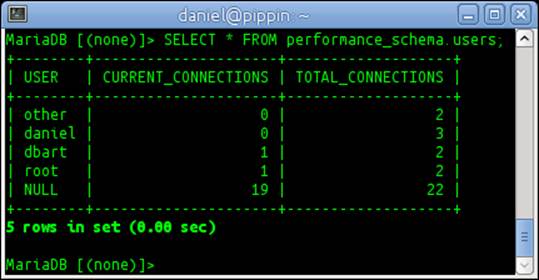
1. Connect to MariaDB using the mysql command-line client. List how many current connections the users have and how many connections they had in total (we might want to log in and out a few times with example users to populate this table):
2. SELECT * FROM performance_schema.users;
The preceding commands display an output similar to the following screenshot:
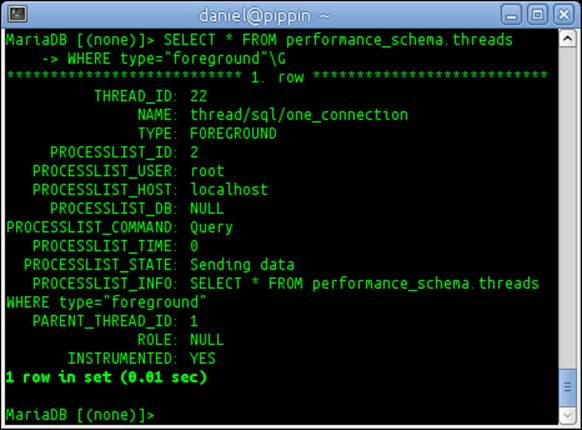
3. Look up for the detailed information on all of the currently running user connection threads:
4. SELECT * FROM performance_schema.threads
5. WHERE type="foreground"\G
The preceding commands display an output similar to the following screenshot:
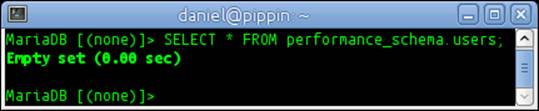
6. Add the following code to the [mysqld] section of our my.cnf or my.ini file and then restart MariaDB to disable the collection of user connection statistics:
7. performance_schema_users_size=0
8. Log in and out a few times with various users (real or example) and then rerun the command we ran in step 2 to look at the user connection statistics. Since we disabled the collection, the output of this information will look similar to the following screenshot:
9. Remove the performance_schema_users_size=0 line we added to our my.cnf or my.ini file in step 4 and then restart MariaDB.
10. Rerun the command from step 2 to verify that the user connection statistics are being collected again (there will be limited output because we just restarted MariaDB).
How it works...
Looking up the data in the performance schema is just like looking up the data in any other database table. We simply use the SELECT statements to query the performance schema for the information we are interested in.
Performance schema variables are not dynamic; this means that they can't be set while MariaDB is running. So, at any time, if we want to add or alter a performance schema variable, we need to add it to the [mysqld] section of our my.cnf or my.ini file and then restart MariaDB.
There's more...
Another way to set performance schema variables is to specify them on the command line when starting MariaDB. For example, to turn off the collection of user connection statistics on the command line, we will add the following line to our command to start themysqld server:
--performance_schema_users_size=0
While this is a valid way to do it, it is easier and better to just add the variable we want to set to our configuration file.
See also
· The full documentation of the performance schema is available at https://mariadb.com/kb/en/performance-schema/
· A full list of all the performance schema tables and links to detailed information on each one is available at https://mariadb.com/kb/en/list-of-performance-schema-tables/
All materials on the site are licensed Creative Commons Attribution-Sharealike 3.0 Unported CC BY-SA 3.0 & GNU Free Documentation License (GFDL)
If you are the copyright holder of any material contained on our site and intend to remove it, please contact our site administrator for approval.
© 2016-2026 All site design rights belong to S.Y.A.