Minitab Cookbook (2014)
Chapter 8. Measurement Systems Analysis
In this chapter, we will be covering the following recipes:
· Analyzing a Type 1 Gage study
· Creating a Gage R&R worksheet
· Analyzing a crossed Gage R&R study
· Studying a nested Gage R&R
· Checking Gage linearity and bias
· Expanding a Gage study with extra factors
· Studying a go / no go measurement system
· Using the Assistant tool for Gage R&R
· Attribute Gage study from the Assistant menu
Introduction
A measurement system's analysis tools used here are to assess the precision and accuracy of the measurement system. Commonly, tools such as Gage R&R are used to assess the precision of both the measurement device and the operators to the variation in the process.
The R&R in Gage R&R stands for repeatability and reproducibility. These terms indicate the variation in measurements by the measuring device when performing repeated measures on items and the variation between operators.
Accuracy can be assessed by using Type 1 Gage studies and linearity and bias studies. Typically, they can include calibration studies to ensure that a measurement device is recording the correct values.
Finally, attribute studies can be used to assess the ability of appraisers to make visual inspections.
Gage R&R studies performed on paper or in applications such as Excel can often be held in a very different format to that of the columns in Minitab. To resolve this problem, the crossed Gage R&R example covers steps to convert the table layout used in Excel into a column format in Minitab.
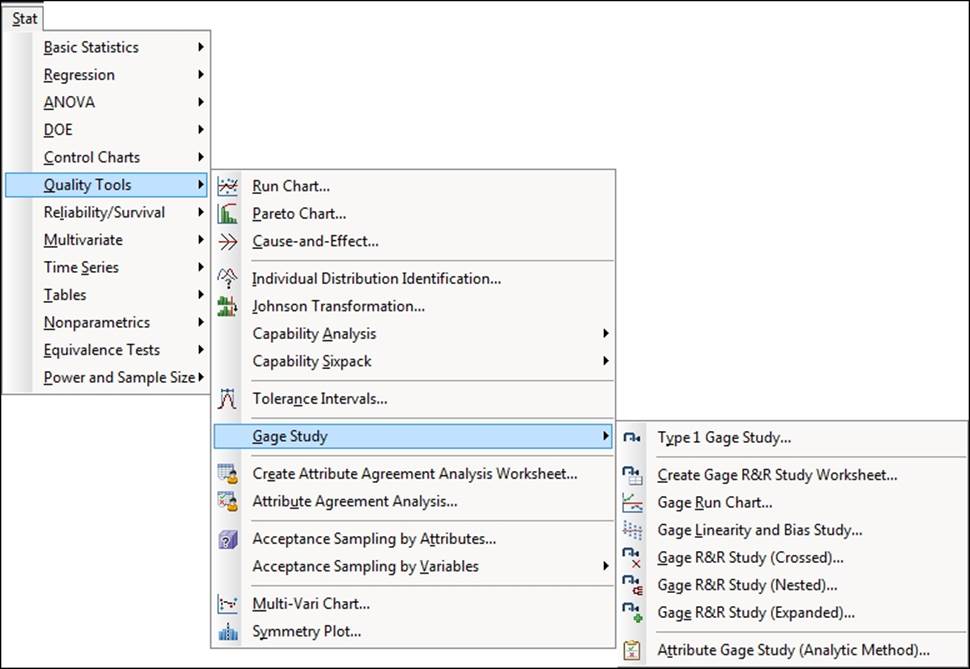
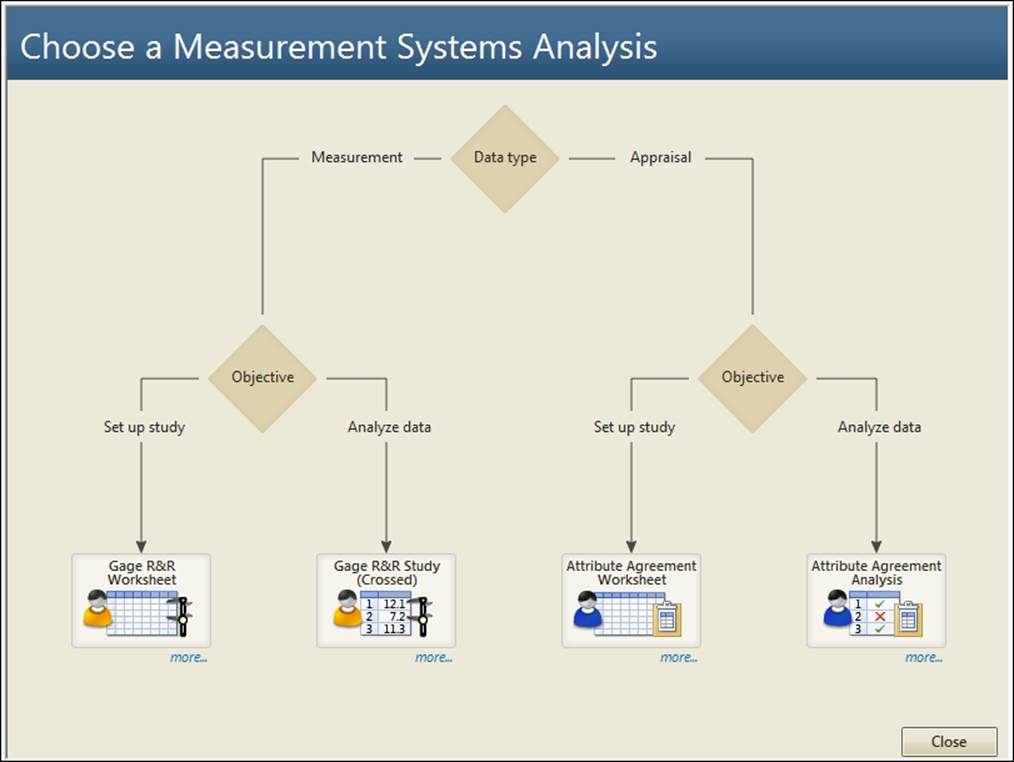
Most of the tools presented here can be found within the Quality Tools menu and the Gage Study option. See the following screenshot to locate these in Minitab:
Analyzing a Type 1 Gage study
A Type 1 Gage study is used to evaluate the bias and repeatability of a measurement device by repeatedly measuring a known reference sample a number of times. By comparing the measurements recorded to the reference, we can evaluate the bias and repeatability of the measurement system. This can be compared to the tolerance to check if the variation in the measurement device is small enough to be acceptable.
In this study, we will look at measurements on fill volumes. A known volume of 15 ml is measured 20 times. The specifications for the process are 14.25 and 15.75. The worksheet Type 1 Gage.mtw contains 20 measurements on this syringe in the Measure column.
How to do it…
1. Open the worksheet Type 1 Gage.mtw by using Open Worksheet… from the File menu.
2. Navigate to Stat | Quality Tools | Gage Study and click on Type 1 Gage Study.
3. Enter Measure in the Measurement data field.
4. Enter 15 in the Reference field.
5. Under Tolerance, enter 1.5 in Upper spec - lower Spec.
6. Click on OK.
How it works…
Type 1 Gage studies will output a Bias measure and a Capability measure, namely Cg and Cgk. A one-sample T-test is run on the mean of the measurements against the reference value to check for bias. The results of this data should show a significant bias with a mean of 14.916.
The run chart will display the measurements in the order they appear in the worksheet. The data should be presented in the collection order to allow a check for trends or patterns in the results.
The red lines plotted on the chart represent as 10 percent of the tolerance interval. Ideally, a good measurement device should have measurements well within the interval. Results exceeding the interval show a measurement device with too much variation. The measures displayed are as follows:
· Cg: This is calculated by dividing 20 percent of the tolerance width by the study variation: the width of the red lines divided by six times the standard deviation. The percent of the tolerance is given as 20 percent by default but can be changed within the Type 1 Gage study options.
· Cgk: This is calculated from the bias and the Gage variation. In this example, we should see that the results are close to, and cross the lower limit, causing Cgk to be much lower than Cg.
· %Var(Repeatability): This compares the gage repeatability to 20 percent of the tolerance.
· %Var(Repeatability and Bias): This compares both repeatability and bias with 20 percent of the tolerance.
Ideally, Cgk is above 1.33.
There's more…
The Type 1 study only checks the variation around one sample. As such, it only gives an indication of bias around the reference value. More in-depth checks of bias can be run with a Gage linearity and bias study, which checks the variation of the bias across a range of reference samples.
Usually, Type 1 studies are used as initial checks on a measurement device; uses, for example, might include assessing a new measurement device for suitability or assessing a current device for its suitability for use in a new application. One would then look at Gage R&R studies to examine operator variation, or bias and linearity studies to observe bias across a range.
See also
· The Analyzing a crossed Gage R&R study recipe
· The Checking Gage linearity and bias recipe
Creating a Gage R&R worksheet
Minitab contains a couple of methods to create a Gage R&R worksheet. They can be found either in the Stat menu under Quality Tools, or alternatively, with the Assistant Measurement Systems Analysis (MSA) section. Both are very easy to use and generate a worksheet for entering measurements. This can help produce worksheets ready for analysis of the data.
Here, we will create a Gage R&R study for two operators, 10 samples with two replicates on each sample by each operator, using the Create Gage R&R Study Worksheet option in the Stat menu.
How to do it…
The following instructions will create a new worksheet containing Operators and Sample columns ready to run Gage R&R study (Crossed):
1. Navigate to Stat | Quality Tools | Gage Study and click on Create Gage R&R Study Worksheet.
2. On the top of the dialog box are selections for Number of parts and Number of operators; change Number of Operators to 2.
3. In the table of operator, change the name for operator 1 to Robert and that for operator 2 to Helen.
4. Click on Options; check the box Store standard run order in worksheet.
5. Click on OK in each dialog box to create the worksheet.
How it works…
The worksheet creation tools are a quick way to generate a worksheet for a Gage R&R study (crossed). The default number of parts is 10, with three operators and two replicates—as suggested by the AIAG guidelines.
Note
The Automotive Industry Action Group (AIAG) develops recommendations and practices of quality and process improvement in the automotive industry. The AIAG publish a series of manuals governing standards for the use of techniques and tools for quality.
Although primarily concerned with the automotive industry, they are frequently cited in other industries as well.
Even though the suggested number of samples in the study is 10, it can be useful to increase the number of parts in the study if we do not know the historical variation of the process. The higher the number of samples collected, the better the estimate of the population variation of the samples will be.
Here, we chose to store the standard run order in the worksheet. The StdOrder column shows the default, unrandomized order the design is generated in. The RunOrder column shows the randomized order we are requested to run the design in.
By default, the RunOrder column is randomized for the sequence of parts within operators. We could change this to randomize the entire worksheet or the operator sequence.
There's more…
As Minitab prefers working with columns, the worksheet is set out for all the results to be entered in a new column at the end of the design. We will name this column and enter the measurements as collected in the random order suggested.
This layout is different to the structure that may be used in Excel or texts on Gage R&R. It may happen that Gage R&R will have a table structure similar to the following screenshot:
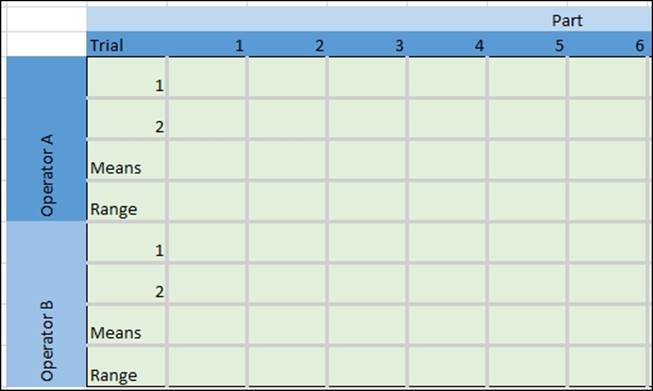
These tables are easy to use for hand calculation and are often entered into Excel in this format. They can be a quick way to work with the mean and range calculations to estimate variation from parts and operators. We will look at an example of converting a Gage R&R table like the one displayed back into a Minitab-preferred format. This is dealt with in the upcoming recipes.
See also
· The Analyzing a crossed Gage R&R study recipe
Analyzing a crossed Gage R&R study
For this recipe we will analyze the results of a crossed Gage R&R study. The data is initially in a format that we may typically find in an Excel worksheet. In the first column, we have Operator, in the second one we have Trial, and columns C3 to C12 have the measurements on each part. This format is mentioned in the AIAG manual on measurement systems analysis. These instructions will show us how to convert this tabular form into a preferred format for Minitab.
The third row contains the mean result for Helen, the seventh row contains the mean for Robert. The fourth and eight rows contain the ranges of each operator. This data has already been imported from Excel; for more on opening data in Excel, see Chapter 2, Tables and Graphs.
We will initially remove the rows of Means and Ranges and then stack the data. After stacking the data, we will recreate the column for operator names. Then, we will run Gage R&R Study (Crossed).
The specifications of 14.25 and 15.75 will also be entered into the study to generate percent tolerance and probabilities of misclassification.
Note
The worksheet Gage R&R stacked.mtw contains the data prepared in the Minitab format. We can skip steps 1 to 12 by using this dataset.
How to do it…
The following instructions take a table of results and format them into columns to analyze the columns with the Gage R&R Study (Crossed) option:
1. Open the worksheet Gage R&R.mtw by using Open Worksheet from the File menu.
2. Go to the Data menu and click on Delete Rows.
3. In Rows to delete, enter 3 4 7 8 to delete the rows of the means and ranges.
4. In the section Columns from which to delete these rows, select all the columns in the worksheet.
5. Click on OK.
6. Navigate to Data | Stack and click on Columns.
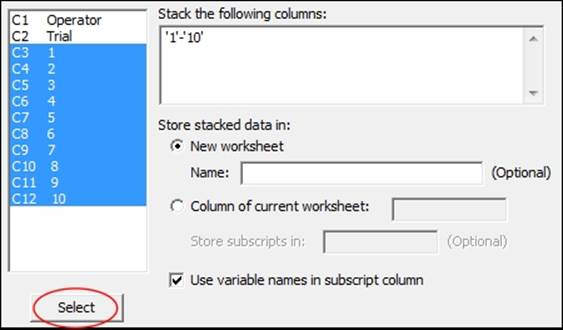
7. In the section Stack the following columns:, only enter the columns for the part numbers. The selection can be made easier by selecting columns C3 to C12. Then click on the Select button to move the columns across together as shown in the following screenshot:
8. In the section Name under New worksheet, enter Stacked Data.
9. Click on OK.
10. In the new worksheet, name column C1 as Parts and column C2 as Measure.
11. Navigate to Calc | Make Patterned Data and click on Text Values….
12. Enter data in the dialog box as shown in the following screenshot:
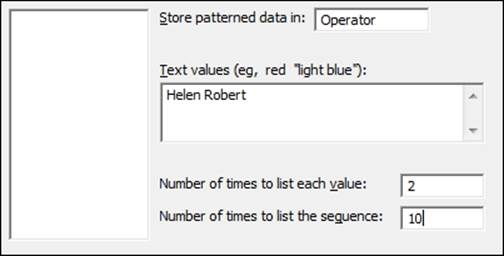
13. Click on OK to create the Operator column.
14. Navigate to Stat | Quality Tools | Gage Study and click on Gage R&R Study (Crossed).
15. Enter Parts in the section Part numbers.
16. Enter Operators in the section Operators.
17. Enter Measure in the section Measurement data.
18. Click on the Options button.
19. Enter the Lower spec as 14.25.
20. Enter the Upper spec as 15.75.
21. Check the Box Display probabilities of misclassification.
22. Click on OK in each dialog box.
How it works…
Steps 1 to 12 are used to prepare the worksheet as the format is initially in a tabular form. They are useful for anyone importing their data from other sources.
The delete rows command is used to remove the rows of means and ranges to avoid including these in the calculations later. Rows can also be deleted by right-clicking the row number to highlight the entire row and clicking on Delete in the drop-down menu that appears.
We used the stack columns command, but this cannot stack the operator alongside the part numbers. The Stack Blocks of Columns command can stack the part numbers and the operators in one step, but will only allow eight sets of data to be stacked in the dialog box. Here we have 10 sets of data that need to be stacked.
To recreate the information on Operator, we use the Make Patterned Data tools. These are great for expanding information into a column. When the measurements are stacked, we know that there are two results for each Operator: the first and the second measurements on a sample. We list each value twice to state an operator twice in a row. Then, we repeat the pattern of Helen Helen Robert Robert for the 10 parts in the study.
These steps would not be needed if the data had been entered in the worksheet as described in the the Creating a Gage R&R worksheet recipe.
The output of the Gage R&R uses the ANOVA method as the default method of analysis. Studies previously calculated by hand use the Xbar and R method as this is a simpler technique than calculating sums of squares. Xbar and R calculations will not find interaction terms in the results whereas the ANOVA method will.
Entering specifications into Options, we calculate the percent tolerance. This could be entered as a lower and/or upper specification or just a tolerance interval. Using the limits rather than an interval allows the calculation of probabilities of misclassification. These are found by comparing the variation of the process and the measurement system to the specifications. Joint probabilities give the probability of identifying bad parts as good and good parts as bad. Conditional probability is the probability of misclassifying a part that is known to be out of spec as good or known to be in spec as bad.
Joint probability is based on not knowing if the tested sample is in spec or not, whereas conditional probability says that we know the tested part is good or bad.
When historical standard deviations are used, the Gage study will generate percent process to compare the measurement system variation to the historical process variation.
The value of the study variation used in Minitab's Gage R&R is given as 6 standard deviations. Those familiar with Gage studies from past AIAG manuals may be used to a value of 5.15 standard deviations. The third edition of the AIAG manual on measurement systems analysis uses the value of 6 standard deviations rather than 5.15. The default value used in Minitab has been updated to reflect this change. Options… allows us to change the value of study variation if we need to.
One final option that can be useful is the inclusion of confidence intervals. These are switched on from the Conf int… subdialog box. One-sided or two-sided intervals can be selected here.
There's more…
The Stack Blocks of Columns command, when used with the session commands, will allow more than just the eight sets of data that the dialog box allows. For more on session commands and macros, see Chapter 11, Macro Writing.
How many parts and operators should we use in a Gage study? The automotive guidelines recommend at least 10 parts and three operators with two replicates to give a total of 60 results. Ideally, the goal of the parts in the study is to represent the variation in the process. If a historical standard deviation is unknown, then it is suggested that more samples are collected. For more information on number of samples, refer to the discussion of this topic on the Minitab website. This information can be found in the answers database at http://www.minitab.com/en-US/support/documentation/answers/NumberPartsOperatorsGageRR.pdf.
The Assistant tool for Gage R&R also contains advice on the number of samples. Here, the recommended number of samples to estimate the process variation is between 15 to 35.
For more information on the Assistant tools, see the Minitab knowledgebase and answer ID 2613 at
http://it.minitab.com/en-us/support/answers/answer.aspx?id=2613
If the study has no operators and the measurement system is part of an automated system, then we can run a crossed Gage R&R without operators. We only need to enter the column for parts and measurements.
Studies can also be more complicated; comparison between measurement devices with operators can also be investigated. With additional factors, we can analyze the results by using an expanded Gage R&R study. This is covered later in this chapter.
See also
· The Stacking several columns together recipe in Chapter 1, Worksheet, Data Management, and the Calculator
· The Stacking blocks of columns at the same time recipe in Chapter 1, Worksheet, Data Management, and the Calculator
· The Expanding a Gage study with extra factors recipe
· The Using the Assistant tool for Gage R&R recipe
Studying a nested Gage R&R
A nested Gage R&R can be useful for studying destructive measurements. As obtaining a measurement destroys the sample being measured, repeating and reproducing measurements on the same item is not possible.
A nested Gage study depends on the ability to be able to use groups of samples that, if not identical, are at least similar.
The worksheet Gage nested contains a dataset loosely based around breaking the strength of a block of chocolate. A block of chocolate is assumed to be homogenous and is split into three identical bars. 12 blocks of chocolate are divided among the two operators with six blocks per operator. Each operator measures all the bars within its set of six blocks.
We will use the Gage R&R Study (Nested) option to investigate the measurement system error and sample variation.
How to do it…
The following instructions will run the nested Gage R&R study on the data for a destructive test:
1. Open the file Gage nested.mtw by using Open Worksheet option from the File menu.
2. Navigate to Stat | Quality Tools | Gage Study and click on Gage R&R Study (Nested).
3. Enter Block in the Part or batch numbers field.
4. Enter Operator in the Operators field.
5. Enter Strength(N) in the Measurement data field.
6. Click on OK to run the study.
How it works…
The output from the nested Gage study will contain the same components as the crossed studies. We should have results that give us the percent study variable for the total Gage R&R, repeatability, reproducibility, part to part variation, and total variation.
We did not specify any tolerances or historical standard deviations, percent tolerance and percent process are not generated. As with the crossed studies, these could be entered from Options. See the Gage R&R Study (Crossed) option for more on these results.
The crossed Gage R&R estimates the reproducibility by comparing the results via the Operators field on the same samples. Differences by operator on a sample give reproducibility. In the nested design, operators measure different samples. In this case, we are estimating the operator effect on the difference between the means of all the measurements. This variation of the operator is found from a nested ANOVA, where the parts are nested within the operator.
There's more…
When using a nested study on destructive tests, variation within the batch or samples that should be identical will be confounded with the repeatability. As long as the variation within the batch is small, the study works fine. If the variation within the batch is high, then we cannot tell if the repeatability is due to variation within the sample or the measurement system.
See also
· The Analyzing a crossed Gage R&R study recipe
Checking Gage linearity and bias
Here, we will look at checking the accuracy of a measurement device over its range of measurements. The worksheet Gage Linearity has a study with five known reference samples, each measured 12 times. The actual result and the measured value are used to estimate the bias or linearity of the measurement device.
There is a historical process variation of two units that will be used to assess the size of the bias and linearity to the process variation.
How to do it…
The following instructions will check the accuracy for a range of standard samples:
1. Open the worksheet Gage Linearity.mtw by using the Open Worksheet… option from the File menu.
2. Navigate to Stat | Quality Tools | Gage Study and click on Gage Linearity and Bias Study.
3. Enter Part in the Part numbers field.
4. Enter Reference in the Reference values field.
5. Enter Result in the Measurement data field.
6. Enter the Process variation as 2.
7. Click on OK to run the study.
How it works…
The AIAG suggests a linearity and bias study should comprise five reference parts with 12 measurements. This is to gather information on the mean bias for each reference value.
The results will plot the bias, difference between the measured value and the actual value on the chart on the left along with the mean bias at each reference value and a regression line. The plotted result is shown in the following screenshot:
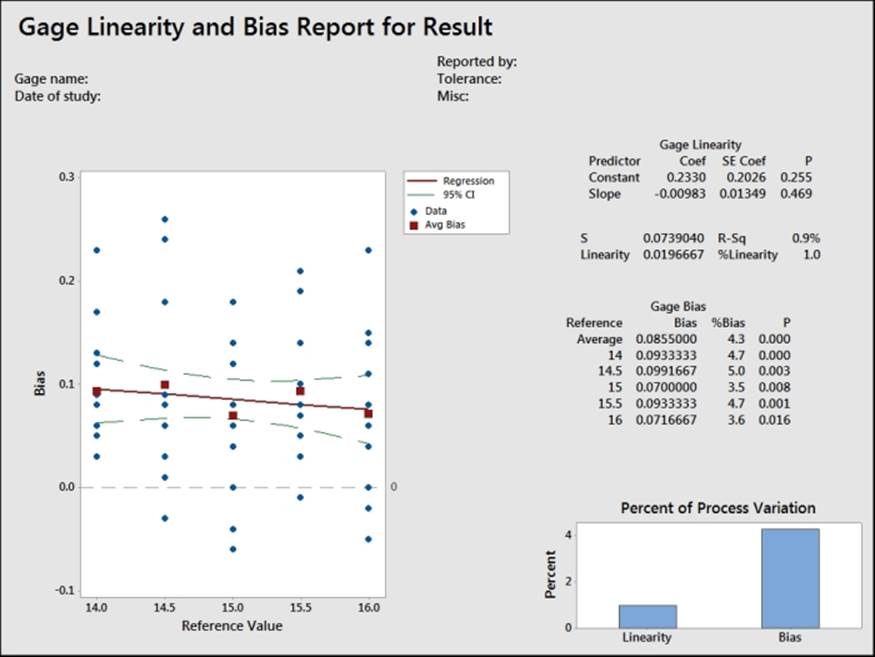
If the confidence interval of the regression line completely encloses the zero line, then our results can be judged as accurate. Should the confidence intervals not include the zero line completely, it could include a horizontal line so that we have a flat bias. Sloped lines would indicate that the measurement system has a changing bias across the results.
The output also includes P values on the bias and slope. The null hypothesis for these are 0 bias and 0 slope respectively.
There's more…
Quadratic problems with accuracy can also show up in this style of study; however, they can only be visually assessed.
See also
· The Analyzing a Type 1 Gage study recipe
Expanding a Gage study with extra factors
In expanded Gage studies, we are interested in including more than just an operator or part as factors in the Gage R&R. This is especially useful if the study is interested in investigating the differences across measurement devices, different labs, or even locations.
Here, we will look at a Gage R&R including one extra factor, a preparation method effect on the sample. In this recipe, the study looks at the force required to remove adhesive from a glass plate. The sample is a batch of adhesive, and the response is the force required to remove a test piece from a glass plate. Two operators prepare the samples and test the force of the adhesive.
Additionally, in this study, three different preparation methods are used to clean the glass plates before the adhesive is applied.
We will use the expanded Gage R&R to look at the effect of the preparation method, operator, and adhesive batch on the force measurements.
The worksheet contains the columns Preparation Method, Sample, Operator, and Force (N).
The preparation method will be identified as an additional component to the part-to-part variation.
How to do it…
1. Open the worksheet Gage R&R Expanded.mtw by using Open Worksheet from the File menu.
2. Navigate to Stat | Quality Tools | Gage Study and select Gage R&R Study (Expanded).
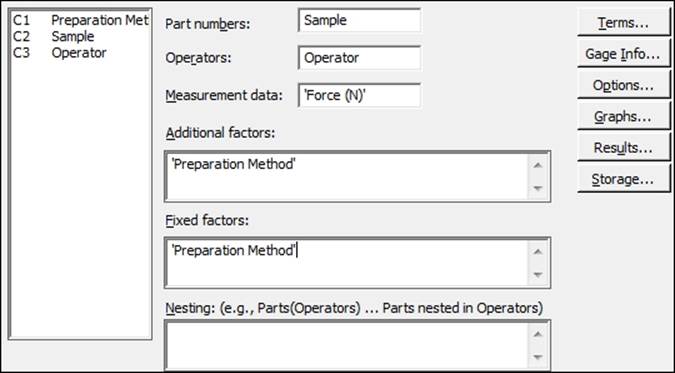
3. Enter the columns into the dialog box as shown in the following screenshot. Enter Sample in Part numbers, Operator in Operators:, 'Force (N)' in Measurement data, 'Preparation Method' should be entered into Additional factors and Fixed factors.
4. Click on the Terms button.
5. From the Include terms in the model up through order drop-down list, choose 2 to select all two-way interactions.
6. Click on the Part-to-Part Variation button.
7. Move Preparation Method and the Sample*Preparation Method interaction to the selected terms.
8. Click on OK.
9. Click on the Graphs button.
10. Enter 'Preparation Method' into both the sections for Plots of measurements by single factors and Plots of average measurements by two factors.
11. Click on OK in each dialog box to run the Gage R&R.
How it works…
By entering the preparation method as an additional factor, we look at the effect of the three preparation methods on the measurements. With the expanded Gage R&R tools, factors are by default set to random factors, unless defined as fixed. As the preparation method is a choice of the three techniques, we are interested in finding the mean effect of each preparation method rather than the variation from the population of methods. Hence, we define the preparation method as a fixed factor.
With parts in a study, these are expected to be random as these are a random selection of samples from the larger population. Operators are also by default set to random factors, as the operators are assumed to be a small selection of operators in the population, and we wish to find the variation across the population of operators. The expanded Gage R&R study allows us to define operators or parts as fixed, unlike the crossed or nested studies, although it is unlikely that parts in a Gage R&R will be fixed.
The option Terms is used to identify which terms to include in the study. By entering all two-way interactions, we can look at the effect of Sample*Operator, Preparation Method*Sample and Preparation Method*Operator.
The study will automatically remove interactions that have a P-value greater than 0.25, this Alpha to remove interaction can be changed from within the Options button if required.
As the preparation method may affect the sample, it has been included as a part-to-part variation. If we had additional factors that contribute to the measurement rather than to the sample, these would be left as measurement system variations.
We are also able to choose the charts to be displayed. The Graphs option is used to include the charts for Preparation Method and the two-factor interactions, including Preparation Method. Xbar-R charts can also be included for additional factors.
There's more…
The expanded study can allow us to include nested factors as well. Consider comparing measurements across two different laboratories; we would nest operators within each lab.
See also
· The Analyzing a crossed Gage R&R study recipe
· The Studying a nested Gage R&R recipe
Studying a go / no go measurement system
Studies to check the accuracy of go / no go measurements systems are run from the Attribute Gage Study (Analytic Method) option. This is found within the Gage Study submenu of Quality Tools.
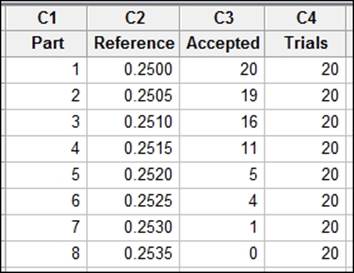
In this recipe, we will use data for a go / no go plug gage. The upper limit of the gage is 0.25 mm; 11 reference samples are checked 20 times against the gage and the accepted number is recorded.
We will type the data into the worksheet before running the Attribute Gage Study (Analytic Method) option.
Getting ready
Enter the data shown in the following screenshot into a new worksheet in Minitab:
How to do it…
1. Navigate to Stat | Quality Tools | Gage Study and click on Attribute Gage Study (Analytic Method).
2. Enter Part into the Part Numbers field.
3. Enter Reference into the Reference Values field.
4. Enter Accepted into the Summarized counts field.
5. Enter Trials into the Number of trials field.
6. Enter the Upper limit as 0.25.
7. Click on OK.
How it works…
The output will plot the probability of acceptance against each reference value.
Bias is calculated from the upper limit and intercept/slope. The slope is found from the regression of the probabilities of acceptance on the reference values.
The Options dialog box allows us to choose between an AIAG method and a regression method for the test of bias. The AIAG method requires one part with 0 acceptances, one part with 20 acceptances, and six parts with acceptances between 0 and 20. The regression method isn't limited to eight reference values and the restrictions of one part with 0 acceptances and one part with 20 acceptances.
The bias will show the difference between the limit specified and the 50th percentile from the regression line.
Repeatability is the difference between the 0.995 and 0.005 proportions from the fitted line divided by an adjustment factor of 1.08.
This can be a useful tool in understanding the performance of go / no go gages. The ideal scenario would be reference values within the specifications that are accepted all the time. Reference values that are outside the specifications should be rejected every time they are tested.
The sharper the slope, the better the gage, and the closer the 50th percentile is to the specification, the more accurate the gage. The problems in accepting parts out of specification, or rejecting items within specification, can show distortion in the gage.
Using the Assistant tool for Gage R&R
The Assistant menu's tools also include a crossed Gage R&R. They offer a simpler dialog use and guidance with interpretation of the results in exchange for fewer options compared to the Stat menu tools.
Here, we will use the same data as in the crossed Gage R&R study earlier as a comparison with the crossed study within the Stat menu.
The data is on measuring fill volumes; we have two operators, 10 parts, and two replicates. We will use specifications of 14.25 and 15.75.
The crossed Gage study in the earlier recipe shows stacking a dataset that is set out in a format more typical to Excel. Rather than repeating these instructions, we will open the data in the worksheet Gage R&R stacked.mtw. This holds the worksheet ready for Minitab.
How to do it…
The following instructions will step through the Assistant menu to lead us to the Gage R&R:
1. Open the worksheet Gage R&R stacked.mtw by using Open Worksheet from the File menu.
2. Go to the Assistant menu and click on Measurement Systems Analysis (MSA).
3. Follow the decision tree to the left, as shown in the following screenshot, for a data type of Measurement and an objective of Analyze data.
4. Select Gage R&R Study (Crossed).
5. Enter Operator in Operators.
6. Enter Parts in Parts.
7. Enter Measure in Measurements.
8. In the section for Process variation, choose the option to Estimate from parts in the study.
9. Enter the Lower spec: as 14.25 and the Upper spec: as 15.75.
10. Click on OK.
How it works…
The assistant Gage R&R offers an easier to use dialog box without all the options that are offered in the Gage R&R (Crossed) option in the Stat menu. This makes it easier to use and offer guidance on the reports. There are four report cards generated for the Gage R&R.
The Summary report will indicate if the measurement system can assess process performance and tolerance. Process performance is judged by historical process variation if this report is used, and percent study is judged by percent process or study variation if the historical variation is not entered.
The adequacy of the gage is judged by the AIAG guidelines as follows: less than 10 percent is ideal, 10 percent to 30 percent is marginally acceptable, and greater than 30 percent is unacceptable.
The assistant Gage R&R will only use the ANOVA method for the analysis, not the Xbar-R method.
For more control over what output is displayed or what options to select (for example, the Xbar-R method and the number of standard deviations for the study variation) we should use the Gage R&R tools from the Stat menu.
There's more…
Like the crossed Gage R&R, the assistant will run an attribute agreement analysis. The attribute agreement analysis is shown in the next recipe.
See also
· The Attribute Gage study from the Assistant menu recipe
· The Analyzing a crossed Gage R&R study recipe
Attribute Gage study from the Assistant menu
The attribute studies are used where, instead of a measurement device, operators or appraisers make a judgment on the acceptability of items. The study here is used to assess the appraisers' ability to agree with themselves and the standards in a study.
For this recipe, we will use data for an inspection on car bumpers. The appraisers inspect the bumpers to check for a color match with the vehicle they are to be fitted to.
A total of 30 samples are tested by three appraisers with two replicates. A standard was identified for the results in the study, and this is given in the sixth column. We will use the attribute study to compare the ability of appraisers to agree with their own results and to the standards.
Here, we will use the Assistant menu to run the attribute studies; a similar study can be run from the Stat menu and Quality Tools.
How to do it…
Here, the instructions will show us how to navigate the assistant decisions and lead us to the attribute gage study. Then, using the following steps, we will produce results examining the consistency and accuracy of the appraisers' answers:
1. Open the worksheet Attribute gage study.mtw by using Open Worksheet from the File menu.
2. Go to the Assistant menu and select Measurement Systems Analysis (MSA).
3. Follow the decision tree to the right for a data type of Appraisal; the decision tree is shown in the previous recipe.
4. For the objective, follow Analyze data.
5. Select Attribute Agreement Analysis.
6. Enter Appraisers into the section Appraisers.
7. Enter Test Items into the section Test Items.
8. Enter Results into the section Appraisal Results.
9. Enter Standards into the section Known Standards.
10. Select Pass as the Value of good or acceptable items:.
11. Click on OK.
How it works…
The assistant attribute study will create four output cards. The first is a report card about the mix of items in the study and how the accuracy and error rates are calculated. The second shows a misclassification report. This indicates the appraisers' errors and samples that are misclassified.
The third page is a report on the accuracy of the appraisers and the accuracy of responding pass or fail.
The final page gives a summary report, indicating the overall percentage accuracy and error rates.
The assistant uses percentage accuracy and error to convey the ability of the appraisers to agree. If we are interested in producing Kappa statistics, then the Attribute agreement analysis, found in the Stat menu, and Quality Tools should be used.
The assistant study will only be able to use binomial responses, and needs a standard to compare the responses to.
Attribute agreement analysis from the Stat menu allows us to use ordinal or nominal data and does not need a standard to use. For ordinal data, the Stat menu tool can also output Kendall's coefficients.
There are also tools to create worksheet to generate attribute gage study worksheets in the Assistant and the Stat menu.
There's more…
We used the Assistant tool here for the attribute agreement studies, as the output is easily interpreted and very graphical. Should we have a study without a known standard, or a response that is not binomial, then the Attribute agreement analysis from within theStat menu, and Quality Tools provide an alternative study. This will generate Kappa or Kendall's coefficients.
Attribute gage studies are not recommended with fewer than 20 samples due to confidence intervals on results being large. Another consideration is that as the number of samples is reduced, the ability of the appraisers to be able to remember the given samples and results is higher. This can increase measurement bias if operators are able to remember details about the samples.
All materials on the site are licensed Creative Commons Attribution-Sharealike 3.0 Unported CC BY-SA 3.0 & GNU Free Documentation License (GFDL)
If you are the copyright holder of any material contained on our site and intend to remove it, please contact our site administrator for approval.
© 2016-2026 All site design rights belong to S.Y.A.