Learning OpenShift (2014)
Chapter 3. Application Maintenance
In both the previous chapters, we learned how to create applications as well as how to add additional cartridges to enhance the functionality of the platform. In this chapter, we are going to learn more tricks to maintain and manage the applications that we deploy to the OpenShift platform.
The first part of this chapter will focus on stopping and starting applications as well as cartridges and then progress to viewing logfiles of running gears. After that, we will learn how to back up and restore applications and then how to remotely connect to our application gears using SSH.
Stopping and starting applications
In the last chapter, we created an application named lampstack that included the phpMyAdmin management console as well as a MySQL database. There may be times when you want to stop a particular cartridge so that it is not consuming system resources while not in use.
1. Open your web browser and go to the URL of the phpMyAdmin cartridge that we embedded in the previous chapter.
2. Ensure the application is responding to requests as expected.
3. Once you have verified the application is up and running, issue the following command at your terminal prompt:
4. $ rhc cartridge stop phpmyadmin –a lampstack
4. Now, refresh the page for phpMyAdmin and you should see an error message stating that the service is temporarily unavailable. If you change the URL to point to the hellodb.php file we created in Chapter 2, Creating and Managing Applications, you will notice that the core application as well as the MySQL database is still running.
5. Now, let's stop the MySQL database to see how the hellodb.php script behaves when it cannot connect to the database using the following command:
6. $ rhc cartridge stop mysql-5.5 –a lampstack
6. Reload the hellodb.php page and you should see an error stating that the connection to MySQL could not be established.
7. While we are stopping services, let's go ahead and stop the core application server as well with the following command:
8. $ rhc app stop lampstack
8. Once the command is executed, you will see a confirmation message that the lampstack application has been stopped. To verify this, open up your web browser and navigate to the URL of your application. If the stop command was successful, you should see an error message indicating that the server is temporarily unavailable.
9. Go ahead and start the application back up using the following command:
10.$ rhc app start lampstack
Once the start command has executed, verify that the application is deployed and it is responding to requests by refreshing the application URL in your web browser.
Tip
When you start an application, all of the cartridges associated with the application are also started, including the ones that were stopped when the application was stopped. You can verify this by viewing the hellodb.php script.
Viewing application logfiles
Viewing the logfiles for an application is a critical task when trying to troubleshoot errors or to monitor the health of your application. Having access to these logs is an important part of the development life cycle and OpenShift makes viewing these files a straightforward task. The RHC toolset provides a command that will display all of the logfiles available for your application from the Shell prompt. To try this out, use the following syntax:
$ rhc tail lampstack
The previous example will open up a Linux tail command on the remote gear and display all information as it is logged into the appropriate logfiles.
Tip
To exit the rhc tail command, you must press Ctrl + c on your keyboard.
While you have the rhc tail command running, open your web browser and refresh the hellodb.php script. Once your browser makes the GET request to the web server, you will see the following line in the logs to indicate the action:
72.208.43.224 - - [16/Jan/2014:22:38:55 -0500] "GET /hellodb.php HTTP/1.1" 200 203 "-" "Mozilla/5.0 (X11; Ubuntu; Linux x86_64; rv:24.0) Gecko/20100101 Firefox/24.0"
Note
If you leave the tail command open, you will also see the Cron job that runs every minute, which we created in the previous chapter.
If you are familiar with the Linux tail command, the -f option is passed by default when viewing the logfiles. Since this is running the Linux command under the covers, you can also pass any option to the command just as you would if you were executing it on a local server. For example, to view the last 50 lines of the logfile, you can specify the -o argument:
$ rhc tail lampstack -o '-n 50'
Creating your own logfiles
Most software projects today will log activity to help troubleshoot problems in the application as and when they arise. As we have learned previously in this chapter, you can view the standard logfiles with a simple rhc tail command. This command will display all information in the standard log directories for your application. It is good practice to create your own logfiles instead of writing to the standard HTTP access logs. Let's modify the hellodb.php source file that we created in the previous chapter to add logging capabilities.
Tip
Most frameworks will include a standard convention for writing logfiles. It is good practice to follow the convention of the framework you are using.
Open up the source file and modify the contents to reflect the following source code:
$dbhost = getenv("OPENSHIFT_MYSQL_DB_HOST");
$dbuser = getenv("OPENSHIFT_MYSQL_DB_USERNAME");
$dbpassword = getenv("OPENSHIFT_MYSQL_DB_PASSWORD");
$dbname = getenv("OPENSHIFT_APP_NAME");
$logdir = getenv("OPENSHIFT_LOG_DIR");
$logfile = fopen($logdir."lampstacklog", 'a');
The first modification is the last two lines in the previous code, where we created a new variable named log that contains the path to our application's log directory. We then open a file named lampstacklog and set the parameter to append to the file:
mysql_connect($dbhost, $dbuser, $dbpassword) or die(mysql_error());
fwrite($logfile, date("m/d/Y h:i:s a", time())." Connected to database.\n");
The second modification will write a log entry to the file that contains the date and time as well as a message stating that we have successfully connected to the database:
mysql_select_db($dbname) or die(mysql_error());
$result = mysql_query("SELECT * FROM users") or die(mysql_error());
fwrite($logfile, date("m/d/Y h:i:s a", time())." Ran query SELECT * FROM users\n");
The third modification is made in another log statement that states we have successfully run the SQL query:
echo "<table border cellpadding=3>";
echo "<tr><td>Username</td>";
echo "<td>Email Address</td></tr>";
while($currentRow = mysql_fetch_array( $result ))
{
echo "<tr>";
echo "<td>".$currentRow['username']."</td>";
echo "<td>".$currentRow['email']."</td>";
echo "</tr>";
}
echo "</table>";
fwrite($logfile, date("m/d/Y h:i:s a", time())." Returned results to browser\n");
fclose($logfile);
The final modification contains a log statement, which indicates that the results have been returned to the browser. Then, we close the file.
Save the changes to the file and then deploy the changes using the standard workflow:
$ git commit –am "Adding logging to our application"
$ git push
Once your application has been deployed, run the following command:
$ rhc tail lampstack
Open up your web browser, load the hellodp.php file again, and view the contents of the tail command on your terminal prompt. You will see the following entries in the log:
==> app-root/logs/lampstacklog <==
01/17/2014 04:19:20 am Connected to database.
01/17/2014 04:19:20 am Ran query SELECT * FROM users
01/17/2014 04:19:20 am Returned results to browser
Viewing a single logfile
I often find that when I am troubleshooting an issue, I want to focus on one logfile. By default, the rhc tail command will display all entries for every file that our application is using. If we want to narrow down the scope of the files that we view, we can use the -f option of the command while specifying the logfile that we want to view. For example, to view only the lampstacklog logfile that we created for our application, enter the following command:
$ rhc tail -f app-root/logs/lampstacklog
You can also pass in wildcards as an option if you are interested in viewing all logfiles in a given directory:
$ rhc tail –f app-root/logs/*
Note
For a complete list of options you can pass to the command, you can run the following command:
$ rhc tail --help
Backing up and restoring applications
OpenShift Online does not keep or restore backups of a user's applications that developers have deployed to the platform. Due to security and privacy concerns, this task is left up to the user of the system to perform and maintain. Fortunately, the RHC toolset provides an easy-to-use utility to perform this function. In this section, we are going to take a snapshot of our application and then modify the source code that will break the database connection. We will then restore the snapshot to bring back the application to a working state.
Creating a snapshot
Create a new directory named backups under your code directory and change to the newly created directory using the following command:
$ cd ~/code
$ mkdir backups
$ cd backups
Once you are in this directory, you can create a snapshot of the lampstack application with the following command:
$ rhc snapshot save lampstack
This will create a new file on your local system that contains the complete snapshot of your application. This includes every piece of information that you need to get your application up and running, including your database. Having this snapshot makes it possible and extremely easy to recreate your application on OpenShift or to move it to a larger gear instance with more memory.
You will notice that, by default, the snapshot utility created a new file named lampstack.tar.gz when you make the snapshot. The next time you create a snapshot, this file will be overwritten with the contents of the new archive. With a little command-line jujitsu, we can modify the snapshot command to create a file with the current date and time for our backup. This is useful if you want to keep a history of snapshots for your application or if you want to set up a cron job that automatically creates a backup of your application.
Note
It is important to know when taking a snapshot of your application that the platform stops your gear while performing the back up. If you create a snapshot, your application will experience downtime while the snapshot is saving.
To create a new snapshot with a timestamp, execute the following command:
$ rhc snapshot save lampstack -f ./$( date '+%Y-%m-%d_%H-%M-%S' ).lampstack.tar.gz
Once the command is executed, you will see the following output on the screen to notify you that a new snapshot is being saved:
Pulling down a snapshot to ./2014-07-14_22-04-48.lampstack.tar.gz...
Creating and sending tar.gz
RESULT:
Success
Note
While the OpenShift Online platform is creating your snapshot, your application will be unavailable, as it stops all of the processes in order to get a clean backup.
Restoring a snapshot
Let's create a mock scenario where a critical source file was deleted from our application and it is necessary that we restore it. I am sorry to admit that this situation has happened to me in the past and I didn't have a backup of the missing file. Let's create this mock example by deleting thehellodb.php source file from the previous chapter. Open up your command line or file browser and delete the file. Once you have deleted the file, push the changes to the OpenShift servers using the standard workflow:
$ git commit -am "removing source file"
$ git push
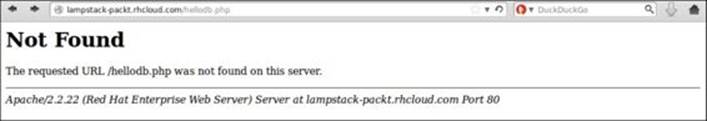
Verify that the file has been deleted on the server by opening the file in your web browser. If the file was deleted correctly, you should see a 404 error page, as shown in the following screenshot:
To restore the source file as well as the entire application to the last-known good backup state, change to the directory where you stored the last backup and issue the following command:
$ rhc snapshot restore -f lampstack.tar.gz -a lampstack
After entering the previous command, you will see the following output on the screen, which states the steps that are currently being taken to restore the application:
Restoring from snapshot lampstack.tar.gz to application 'lampstack' ...
done
Once the process has finished, refresh the hellodb.php page to ensure that the file has been restored and is able to display information from the database.
Note
The restore option also restores the database and all of its content to the information that was saved when taking the snapshot. This means that any data in the database that was saved between snapshots will be rolled back. Given this information, a good use case to restore a snapshot is if you accidentally drop a database table from the application.
It is important to understand that once you restore a snapshot, your current Git repository is out of date with the repository on the OpenShift server. This makes sense because the snapshot is a complete backup of the entire application gear, including the Git repository. Since we deleted thehellodb.php file and then committed the change to our local repository, it is ahead of the newly restored Git repository. You can correct this scenario in one of the following two ways:
· Remove your lampstack directory and recreate it using the following command:
· $ rhc git-clone lampstack
· Reset your local Git repository to match with the OpenShift server using the following commands:
· $ cd ~/code/lampstack
· $ git reset origin --hard
Secure shell and your application
When a developer creates an application on the OpenShift Online platform, a Linux user account is also created on the server that the application is deployed on. Having this user account on the system allows a developer to secure shell or SSH to the application gear. However, because OpenShift uses SELinux and Linux control groups, the user account is limited in what actions can be executed. For instance, you can't install new system packages on the server, but you do have access to view logfiles, securely copy files, and perform maintenance tasks for your application.
Let's start learning some of the things we can do while connected to the remote server via SSH by connecting to the lampstack application gear. This can be done using the RHC tool with the following command:
$ rhc ssh lampstack
Once you enter the previous command, you will be connected to the container that your application code is deployed to. You should see the following output confirming the SSH command was successful:

Now that you are connected to the remote server, I know the first instinct is to look around and see what permissions you have. Go ahead and take a few minutes to try some things out.
Back already? If you are like me, the first thing you probably tried was getting root level permissions with the following command:
$ sudo su
Once you entered the preceding command, you were notified that you don't have permission to the sudo command, as shown in the following command:
bash: /usr/bin/sudo: Permission denied
You probably also found out that your home directory is not in a standard location such as /home, but is located at /var/lib/openshift. Then, you tried to list all of the other applications that may be sharing the same server as your application code:
$ cd /var/lib/openshift
$ ls
At this point, you were greeted with another Permission denied error message as follows:
ls: cannot open directory .: Permission denied
Understanding and viewing the /etc/passwd file
If you are really devious, you probably tried viewing the /etc/passwd file to see all of the user accounts that exist on the system. If you didn't try that, you can do so now with the following command:
$ cat /etc/passwd
The /etc/passwd file is a text file that contains information about all users that can log in to the system. The file contains seven fields that are delimited by the : character. The fields in order are as follows:
· The username for the account.
· The hashed password for the account. In most modern use cases, this field is simply an x because the actual hashed password is stored in the /etc/shadow file.
· The user ID for the account.
· The group ID for the account.
· The descriptive identifier for the account to state the user's real name. All OpenShift accounts will have the real name of OpenShift Guest.
· The location of the user's home directory.
· The executable code that will be run every time the specified user logs in to the system. This is typically the Shell environment that the user will be working with such as Bash or Zsh. All OpenShift accounts will be running the oo-trap-user command.
You may be wondering why users have access to view the /etc/passwd file, while great lengths have been taken to ensure that applications are secure and not visible to other users on the system. One of the main reasons for visibility of this file is the expectation by some applications to have access to read information from this file (such as home directory) in order to function correctly.
Understanding and viewing cgroup information
OpenShift Online uses Linux control groups to manage availability of system resources for your application. In order to view the resources that your application is currently consuming as well as the resources the application has access to, we can use the oo-cgroup-read command. To list all of the information that we can view, issue the following command on the OpenShift Online server:
$ oo-cgroup-read all

We can then view detailed information for any item by specifying the item name in conjunction with the oo-cgroup-read command. For instance, if we want to view the current limit of memory that your application is allowed to consume, we can issue the following command:
$ oo-cgroup-read memory.limit_in_bytes
Go ahead and play around with some of the other items by viewing them with the oo-group-read command.
Setting the timeout parameter and viewing logfiles
While working on the remote server with SSH, you probably noticed that the system will automatically log you out after a period of time when no commands are entered. This was implemented to automatically disconnect users who may have forgotten they were connected to the remote server. While this is a good thing, it can also be annoying when you want to leave the session connected for longer periods of time. Fortunately, the parameter that specifies the amount of time before disconnecting a user is configurable by the user. To view the current value, you can issue the following command:
$ echo $TMOUT
The previous command will output the value of the TMOUT environment variable. This variable is used to determine how long a user can be inactive before automatically disconnecting the session. To modify this environment variable, issue the following command to change the value to 3600, which is 1 hour:
$ export TMOUT=3600
Alternatively, you can disable the timeout altogether with the following command:
$ unset TMOUT
Previously in this chapter, we learned how to view logfiles for the lampstack application by using the rhc tail command. You can also view logfiles while connected to the remote server via SSH. For example, to view the custom logfile that we created earlier in the chapter, issue the following command:
$ cat ~/app-root/logs/lampstacklog
Understanding environment variables
OpenShift Online brings a lot of convenience and flexibility to our applications by managing the hardware tier and even some of the software tier for us so that we can focus on the application development. However, having this convenience also changes the way you would typically address certain types of development tasks, such as where to store and retrieve authentication information for databases.
We saw how quickly you can spin up a Wordpress-based application with the database connection already configured for the application. Having this auto-wiring is crucial to reuse and redeploy a new instance of your application. A lot of this perceived magic is actually just system environment variables hard at work. The platform stores such things and IP addresses and database credentials as environment variables so that your application code can reference these variables without having to know the actual value. This is an extremely powerful concept because it makes your application code portable to another server without having to change a single line of code. It also allows the OpenShift platform to scale up the number of servers hosting your application without the developer having to modify the IP addresses associated with the application.
To better understand this concept, let's list all of the environment variables that contain information about the MySQL database that we added to our lampstack application. In order to do this, SSH to the lampstack application and then perform the env command. The steps are as follows:
$ rhc ssh lampstack
Once connected to the remote server, run the following command:
$ env |grep OPENSHIFT_MYSQL
The following output will be displayed on the screen:
OPENSHIFT_MYSQL_DIR=/var/lib/openshift/52d5d7c05973ca5f33000015/mysql/
OPENSHIFT_MYSQL_DB_PORT=3306
OPENSHIFT_MYSQL_DB_HOST=127.7.84.2
OPENSHIFT_MYSQL_DB_PASSWORD=JerElgadNgFP
OPENSHIFT_MYSQL_IDENT=redhat:mysql:5.1:0.2.6
OPENSHIFT_MYSQL_DB_USERNAME=adminRapRWMM
OPENSHIFT_MYSQL_DB_SOCKET=/var/lib/openshift/52d5d7c05973ca5f33000015/mysql//socket/mysql.sock
OPENSHIFT_MYSQL_DB_URL=mysql://adminRapRWMM:JerElgadNgFP@127.7.84.2:3306/
OPENSHIFT_MYSQL_DB_LOG_DIR=/var/lib/openshift/52d5d7c05973ca5f33000015/app-root/logs/
As you can see, all of the information that you would need to know in order to connect to the database is stored inside the environment variables. Most modern programming languages provide an API in order to read values that are stored as system environment variables. For example, in PHP, you would reference the OPENSHIFT_MYSQL_DB_URL environment variable with the following code:
$mysqlURL = getenv('OPENSHIFT_MYSQL_DB_URL');
The result of the previous syntax would be a variable named mysqlURL that contains mysql://adminRapRWMM:JerElgadNgFP@127.7.84.2:3306/ as the value.
Another popular environment variable that is used inside of application code is the ability to find out the full URL for the running application. This can be found by referencing the OPENSHIFT_APP_DNS environment variable with the following command:
$ env |grep OPENSHIFT_APP_DNS
If you just want to get the name of application that you are working with, you can run the following command:
$ env |grep OPENSHIFT_APP_NAME
For a complete list of all available environment variables, run the following command:
$env |grep OPENSHIFT
The output that you see from the previous command will look similar to the following screenshot:

Note
The usernames, passwords, and IP address information that is displayed for your application will be slightly different from the output shown in the previous screenshot to reflect the specific server and generated credentials that your application is using.
Setting your own environment variables
The OpenShift Online platform allows developers to set their own environment variables that can be referenced from their application code. One use case might be to set a logging level variable that your application code reads to determine the amount of logging to perform. To illustrate this particular use case, we are going to modify the hellodb.php file to read an environment variable that will determine the logging level we want to use.
The first thing we need to do is to create, set an environment variable named OPENSHIFT_LAMPSTACK_LEVEL, and set the value to DEBUG. We can do this by using the RHC tool that we have installed on our local machine. Open up your local terminal prompt and set the variable with the following command:
$ rhc set-env OPENSHIFT_LAMPSTACK_LOGLEVEL=DEBUG -a lampstack
Verify that the environment variable was set correctly by connecting to your application gear with SSH and viewing the contents of the variable:
$ rhc ssh lampstack
$ echo $OPENSHIFT_LAMPSTACK_LOGLEVEL
The output from the previous command should be DEBUG.
Now that the environment variable has been created on the remote server, let's modify the hellodb.php file to look like the following code:
<?php
$dbhost = getenv("OPENSHIFT_MYSQL_DB_HOST");
$dbuser = getenv("OPENSHIFT_MYSQL_DB_USERNAME");
$dbpassword = getenv("OPENSHIFT_MYSQL_DB_PASSWORD");
$dbname = getenv("OPENSHIFT_APP_NAME");
$logdir = getenv("OPENSHIFT_LOG_DIR");
$logDebug = getenv("OPENSHIFT_LAMPSTACK_LOGLEVEL") === "DEBUG" ? true : false;
The first modification we add is a new PHP variable that is set to true if the value of the OPENSHIFT_LAMPSTACK_LOGLEVEL environment variable is DEBUG. If it has any other value, or is not set, the $logDebug variable will be false:
$logfile = fopen($logdir."lampstacklog", 'a');
mysql_connect($dbhost, $dbuser, $dbpassword) or die(mysql_error());
if($logDebug) {fwrite($logfile, date("m/d/Y h:i:s a", time())." Connected to database.\n");}
The next modification, which we need to make to the source, will check if the value of the $logDebug variable is true. If it is, we will then print a message to indicate that a connection to the database was successfully established:
mysql_select_db($dbname) or die(mysql_error());
$result = mysql_query("SELECT * FROM users") or die(mysql_error());
if ($logDebug) {fwrite($logfile, date("m/d/Y h:i:s a", time())." Ran query SELECT * FROM users\n");}
The next modification we make is to only print the database query log message if the $logDebug variable is true:
echo "<table border cellpadding=3>";
echo "<tr><td>Username</td>";
echo "<td>Email Address</td></tr>";
while($currentRow = mysql_fetch_array( $result ))
{
echo "<tr>";
echo "<td>".$currentRow['username']."</td>";
echo "<td>".$currentRow['email']."</td>";
echo "</tr>";
}
echo "</table>";
if($logDebug) {fwrite($logfile, date("m/d/Y h:i:s a", time())." Returned results to browser\n");}
The next modification we make is to only print the log message indicating that results were returned to the browser if the $logDebug variable is true:
fclose($logfile);
Once you have made the previous changes and saved the source file, push your changes to the server using the following commands:
$ git commit -am "adding debug level log check"
$ git push
Once the changes have been deployed to your server, open up the logfile using the information you learned previously in this chapter with the following command:
$ rhc tail -f app-root/logs/lampstacklog
Try setting the environment variable to a different value and then refresh the hellodb.php file to ensure that information is not being logged. To do this, run the following commands:
$ rhc set-env OPENSHIFT_LAMPSTACK_LOGLEVEL=INFO -a lampstack
$ rhc app stop –a lampstack
$ rhc app start –a lampstack
The Apache process that serves PHP source code loads the system environment variables when the httpd server is started. When changing environment variables, you will need to stop and restart your application gear in order for Apache to pick up the new changes.
Summary
In this chapter, you learned some essential tools and commands that will help you maintain applications that you have deployed on the OpenShift platform. Specifically, you have learned key concepts such as how to stop and start applications, how to view logfiles (including ones that you create and write information to from your application code), how to back up and restore application snapshots, how to use SSH in order to connect to your application gears that are deployed to OpenShift Online, and learned about system environment variables and how to create and use them.
In the next chapter, we will take a break from the command line and application maintenance and dig a bit deeper into the application development aspect of the platform. We will focus on integrating OpenShift Online with integrated development environments.
All materials on the site are licensed Creative Commons Attribution-Sharealike 3.0 Unported CC BY-SA 3.0 & GNU Free Documentation License (GFDL)
If you are the copyright holder of any material contained on our site and intend to remove it, please contact our site administrator for approval.
© 2016-2026 All site design rights belong to S.Y.A.