Learning Pentaho CTools (2016)
Chapter 10. Embed, Deploy, and Debug
Usually, one of the request from customers is to embed dashboards in a third party application. Using RequireJS, doing so is simple and very flexible. You can build mini dashboards that you can easily embed into your application without interfering with the dashboard's default behavior. In this chapter, you will learn how to embed both CDF and CDE dashboards into third-party applications and will explore some considerations.
In all the earlier chapters, you learned how to build a dashboard using CDF and/or CDE. But when we are developing them, we may face some problems, and it would be great to know what should we be looking for. In this chapter, you will get information on how you can debug the dashboard using the developer tools in your browser.
One of the last phases of a project is delivery to the customer or internally to a department, or any other issue that you find. In this chapter, you will also learn some concepts that will help you deploy a project and you'll explore some considerations when delivering a project to a customer.
You may also know, if you've been paying close attention, that there are some CTools that have Pentaho support. If you are a Pentaho customer who has paid for support, you may raise a support case for CDA, CDF, CDE, and CGG, which are the supported tools. Otherwise, if you are a community user, you have other options that may not be as good and quick as support, but we will explore the options so you can find some help if you need it.
In this chapter, you will learn how to:
· Embed CDF and CDE dashboards
· Avoid cross-domain references problems
· Handle events from outside the dashboard
· Debug dashboards when developing them
Embedding dashboards
A frequent question or request that I get from customers is how to embed the dashboards in another application. To be honest, the process before RequireJS was introduced into CDF was quite hard and was not interesting. The possibilities, and I will not get into details of them, were to use an HTML iframe, but this came with a lot of problems later on, it was not really suitable for mobiles, and it was bad from the usability point of view. Another option would be to use html div integration, but that created conflicts in JavaScript libraries and in the CSS, so it might create a mess when styling your pages.
With the use of RequireJS, the process is much more simple and flexible, and does not cause big issues. Of course, you might find some minor issues, but they can be easily identified and fixed. The process of embedding a CDF and a CDE dashboard is different, even if the base concepts are quite similar.
Of course, the first step before embedding a dashboard, is to create that same dashboard. This is valid when embedding a CDE dashboard, because a CDF dashboard is created at the same time you are embedding it. The good news, which you should be expecting, is that you don't need to do anything different from what we've covered up to now to create a dashboard that can be embedded. A really good advantage is that you can embed the same dashboard multiple times in your application. And you may build a kind of mini dashboard that you can use multiple times.
Avoiding cross-domain requests
Before you start embedding your dashboards, you need to be aware of how to avoid cross-domain request issues.
When embedding dashboards in other applications and in earlier versions of CDF and CDE, you needed to have a reverse proxy working to avoid cross-domain request issues. Nowadays, the process is really simple. You can turn on an extra setting for CDF and CDE. To properly allow embedding, which usually requires cross-domain requests, you will need to add the following XML tag, and that's valid for both CDF and CDE.
Edit the settings.xml file of CDF and/or CDE, which you will find in your pentaho-solutions folder: system/pentaho-cdf-dd/settings.xml and system/pentaho-cdf/settings.xml. Then add the following property:
<allow-cross-domain-resources>true</allow-cross-domain-resources>
Depending on the configuration of your server, you may need to restart the server. If you don't know what I am talking about, just restart it and you will see it working without cross-domain request problems.
So now let's start embedding some dashboards.
Embedding a CDF dashboard
A CDF dashboard can be easily embedded in any HTML page hosted anywhere—you just need to include a script to embed CDF in your web page/application. The script will ask for CDF, and the request should be made to a Pentaho Server that has CDF installed. The script to include is as follows:
<script
type="text/javascript"
src="http://<server>/<webapppath>/plugin/pentaho-cdf/api/cdf-embed.js">
</script>
Where:
· <server>: This should be replaced by the server name or IP and the port number when different from 80.
· <webapppath>: This should be replaced by the web app name. By default, it's Pentaho, but this can be changed.
If your Pentaho server is hosted on the same machine as your application and the web app is the default one, your request would be:
<script
type="text/javascript"
src="http://localhost:8080/pentaho/plugin/pentaho-cdf/api/cdf-embed.js">
</script>
That's it …
Okay, you must be asking, but how do I include the dashboard in my application/site, because I only saw how to call CDF's embedded capabilities?
Well, a CDF dashboard is nothing more than JavaScript code you have built, so you can include it on your web page/application now and it will work. From the Chapter 3, Building the Dashboard Using CDF you must remember that we had at least two files, but one of them was just to be used by Pentaho.
The main one is the .xcdf file, which is an xml file that identifies the dashboard when you double-click on it. It reality, it will be rendering a web page with the dashboard inside. This file will point to two more files, both HTML pages.
The first one is the dashboard itself, which is an HTML page where you can also include scripts (JavaScript and CSS, among others) and it is where the code of your CDF dashboard should be. The second one is just a wrapper for the first one. If you want more details, please refer back to Chapter 3, Building the Dashboard Using CDF. Please check whether the code of your dashboard (the code that .xcdf is pointing to) is like the following:
<div id="sampleObject"></div>
<script type="text/javascript">
require(['cdf/Dashboard.Blueprint', 'cdf/components/SelectComponent'],
function(Dashboard, SelectComponent) {
var myDashboard = new Dashboard();
myDashboard.addParameter("region", "1");
var selectComponent = new SelectComponent({
name: "regionSelector",
type: "select",
parameters: [],
valuesArray: [["1","Lisbon"],["2","Dusseldorf"]],
parameter: "region",
valueAsId: false,
htmlObject: "sampleObject",
executeAtStart: true,
postChange: function() {
alert("You chose: " + myDashboard.getParameterValue(this.parameter));
}
});
myDashboard.addComponent(selectComponent);
myDashboard.init();
});
</script>
If so, the code of your web page/application should be like this:
<html>
<head>
<meta http-equiv="content-type" content="text/html; charset=utf-8" />
<title>mySample</title>
<script type="text/javascript"
src="http://localhost:8080/pentaho/plugin/pentaho-cdf/api/cdf-embed.js">
</script>
</head>
<body>
<div id="sampleObject"></div>
<script type="text/javascript">
require(['cdf/Dashboard.Blueprint', 'cdf/components/SelectComponent'],
function(Dashboard, SelectComponent) {
var myDashboard = new Dashboard();
myDashboard.addParameter("region", "1");
var selectComponent = new SelectComponent({
name: "regionSelector",
type: "select",
parameters: [],
valuesArray: [["1","Lisbon"],["2","Dusseldorf"]],
parameter: "region",
valueAsId: false,
htmlObject: "sampleObject",
executeAtStart: true,
postChange: function() {
var choice = myDashboard.getParameterValue(this.parameter);
alert("You chose: " + choice);
}
});
myDashboard.addComponent(selectComponent);
myDashboard.init();
});
</script>
</body>
</html>
As you can see, one of the ways to embed the dashboard is really simple—just embed CDF by calling it as a script and include the code to create your CDF dashboard.
You have a mini dashboard that you want to reuse, so you can wrap it with RequireJS and reuse it as many times as you need—just don't forget that you also need the HTML elements on the page. I believe that, at this time, you should be able to find a way to do it. You have all the concepts, or you just need some more JavaScript and RequireJS knowledge, but that's not really the purpose of this book.
Embedding a CDE dashboard
Embedding a CDE dashboard can be quite simple. You really need to create your own dashboard using CDE in Pentaho. When you have your dashboard working, you just need to request it.
To make it possible to embed a CDE dashboard, we first need to embed CDE, just like we saw for CDF, but this time we request CDE to be embedded:
<script
type="text/javascript"
src="http://localhost:8080/pentaho/plugin/pentaho-cdf-dd/api/renderer/cde-embed.js">
</script>
You can now embed a dashboard in one of two different ways. Using RequireJS in your web page/application, you will be able to include a dashboard as a module. The two ways to do this are:
1. Directly point to the getDashboard endpoint available in CDF:
2. '/pentaho/plugin/pentaho-cdf-dd/api/renderer/getDashboard?path=/public/dash/sample.wcdf'
3. Use the dash! RequireJS loader plugin:
4. 'dash!/public/dash/sample.wcdf'
So, let's explore how to use it. The first step is to create a CDE dashboard. Only after you have a dashboard, do you need to include the dashboard in your web page/application.
Your dashboard and/or web page/application just needs to include the following code:
require([
'/pentaho/plugin/pentaho-cdf-dd/api/renderer/getDashboard?path=/public/dash /sample.wcdf'
], function(SampleDash) {
var sampleDash = new SampleDash("content1");
sampleDash.render();
});
Or it could include:
require([
'dash!/public/dash/sample.wcdf'
], function(SampleDash) {
var sampleDash = new SampleDash("content1");
sampleDash.render();
});
If you look at both examples, you will notice a difference: the link to the module required. Both options will have a RequireJS module that contains a class for a specific dashboard. You can create new instances of that class, just to provide an element ID, or the element itself. The returned class extends the Dashboard class and adds some new methods:
· render(): This is used to render the dashboard, by first setting up the DOM, adding the components and parameters to the dashboard, and finally calling the init() function
· setupDOM(): This is used to set up a predefined layout inside its element
· renderDashboard(): This adds the components and the parameters to the dashboard, and then initializes it
You may use render() to render the dashboard; or, for better control, you may use setupDOM() followed by some logic of yours to manipulate the DOM, and finally call element.renderDashboard().
When embedding a CDE dashboard, your page does not need to provide all the HTML elements needed for the dashboard, because you have created them. You just need to have one element where all the other elements will be placed.
Dashboard, component, and parameter events
One interesting feature that embedded CDE provides is the ability to manage events from the outside. For instance, we can create a link between dashboards. The way to do this is using dashboard events.
Let's suppose you have one instance for each of two dashboards. Both dashboards have one parameter in common, productLine. The first dashboard has one selector that allows you to change a product line, and the second dashboard has a chart that is listening to a parameter with the same name. The parameters from each of the dashboards will not automatically be linked, so we need to specify that connection:
require([
'dash!/public/dash/selectorDash.wcdf'],
'dash!/public/dash/lineChartDash.wcdf'],
function(SelectorDash, LineChartDash) {
var selectorDash = new SelectorDash("selector");
selectorDash.render();
var lineChartDash= new LineChartDash("lineChart");
lineChartDash.render();
selectorDash.on("productLine:fireChange", function (evt) {
lineChartDash.fireChange("productLine", evt.value);
});
});
Looking at the code, you will see that, in the first dashboard, the productLine parameter is being watched, and a change is triggered by the fireChange function. For instance, when the user makes a selection, the code inside the function will trigger a change for the productLine parameter of the second dashboard. This creates a link between both dashboards.
This feature is nothing more than an extension of Backbone.Events, so you can learn to use it to the fullest at http://backbonejs.org/#Events.
The events can be triggered by the dashboard or by the components. The following events are available:
· The events triggered by dashboards are as follows:
· Parameter changes: When a parameter changes its value, the event <parameterName>:fireChange is triggered
· Dashboard pre-initialization: When the dashboard finishes running the pre-initialization scripts, the event cdf:preInit is triggered
· Dashboard post-initialization: When the dashboard finishes running the post-initializations scripts, the event cdf:postInit is triggered
· User not logged in error: When CDF detects that a user is no longer logged in, the event cdf:loginError is triggered
· Server error: If a call to the server returns an error, the event cdf:serverError is triggered
· The events triggered by components are as follows:
· Pre-execution of the component: After the call to the preExecution function, the event cdf:preExecution is triggered.
· Post-execution of the component: After the call to the postExecution function, the event cdf:postExecution is triggered.
· Error: If an error happens during the execution of the component, the event cdf:error is triggered. This can be applied for each one of the components.
Managing events is important inside the dashboard, but the ability to manage events outside the dashboard becomes very important when we are embedding dashboards.
Debugging
When we are developing a dashboard, we may face problems and we need to know where to look for solutions. Many of the problems we face when developing a dashboard can be identified using the developer tools in your browser.
I usually use Chrome, so the examples here are based on the developer tools of this browser. The version that was used while writing this was 46.0.2490.86 (64-bit). Anyhow, if you are using Firefox, you also have developer tools, or you can install Firebug, a developer tool that does not come installed by default. To be honest, I find the developer tools of Internet Explorer to be very poor, even if they are getting better in the latest versions of the browser. Anyhow, we must use them when we are debugging problems that only exist in this browser.
Do not forget to test your dashboard on all of the browsers.
Browser compatibility
Like any other web page, a dashboard can work in one browser and fail to execute in another browser. Every browser has an engine, and they can be quite different. To check what each browser supports and does not support, and for which version, you can use the following site: http://caniuse.com. For instance, if you want to check which ones support SVG images, just search for SVG and you will see something like this:
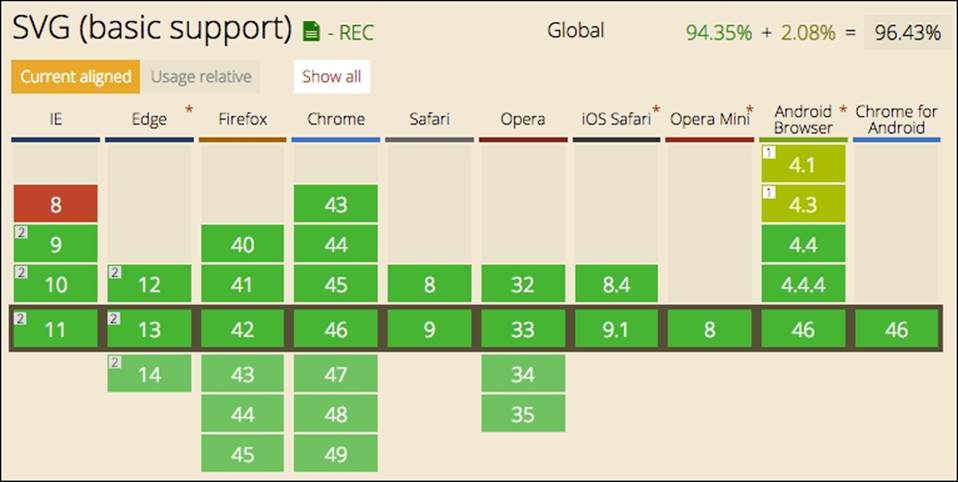
The preceding screenshot shows browsers and their versions; a red rectangle means that SVG is not supported and a green rectangle shows the versions that are supported.
Debugging with developer tools
Among other features, developer tools allow you to inspect, edit, and monitor CSS, HTML, JavaScript, and network requests in any web page. If you want to know more, the following links show how developer tools work:
· https://developer.chrome.com/devtools
· https://developer.apple.com/safari/tools/
· https://developer.mozilla.org/en-US/docs/Tools
· https://msdn.microsoft.com/en-us/library/dd565628.aspx
When a dashboard is rendered, the CSS and JavaScript files are minified; thus, when you are debugging the dashboard, you must add a parameter to your URL. The parameter to be added is debug and it needs to be set to true. You can add it as ?debug=trueif no other parameter exists or as &debug=true if another parameter already exists. Please look at the following two examples:
· http://localhost:8080/pentaho/api/repos/%3Apublic%3Asample.wcdf/generatedContent?debug=true
· http://localhost:8080/pentaho/api/repos/%3Apublic%3Asample.wcdf/generatedContent?paramcountry=Portugal&debug=true
Both examples will allows you to debug the dashboard the only difference is that one has a parameter and another one does not, so one uses the & to set the debug to true, and the other one uses a ? to set the debug mode to true.
This will make CDF and CDE return non-minified versions of the code, and you will be able to check and understand the code. It will even be possible to add some breakpoints.
It is not the purpose of this book to teach you how to use developer tools, but I will give you some hints about the main and basic concepts to start with. This doesn't mean you should forget about your need to have a better understanding of developer tools for different browsers. On Chrome, open the developer tools using Ctrl + Shift + I (or command + option + I on the Mac) to open them. You will get something like the following screenshot:
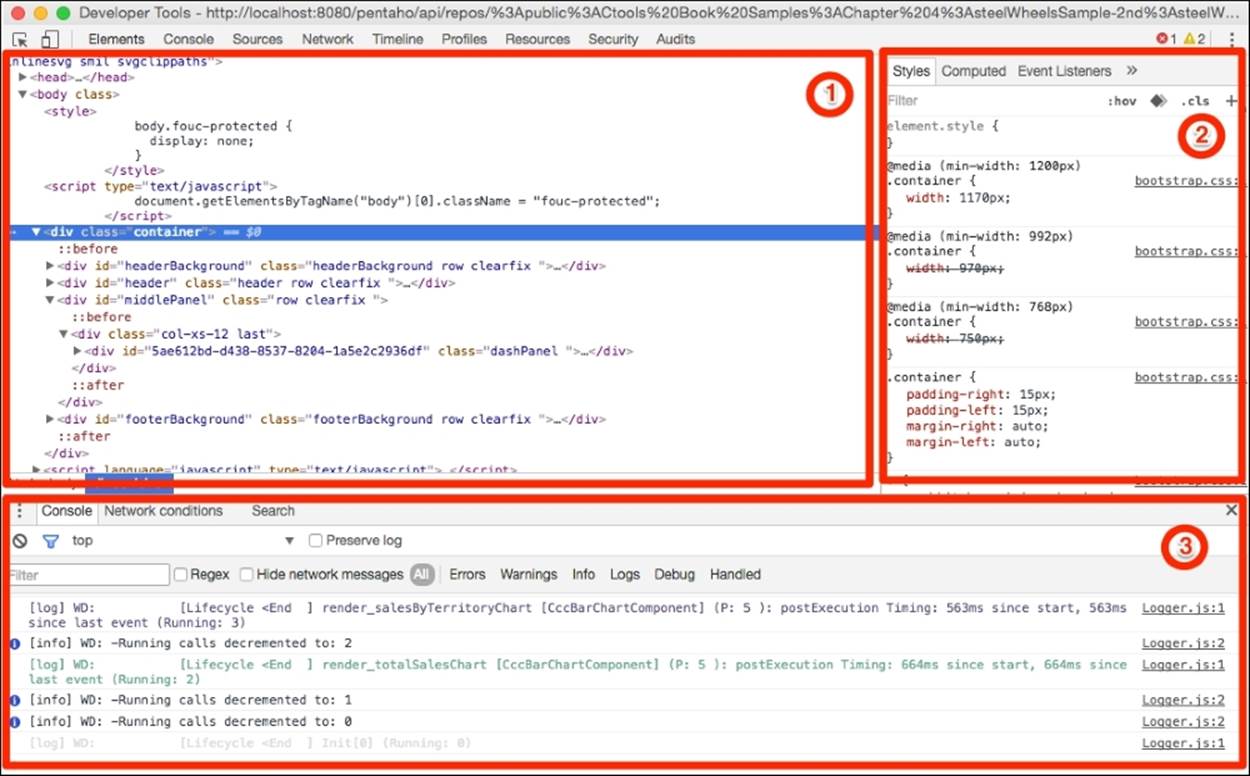
In the preceding screenshot, you can see three numbers:
1: This is where you can get details about HTML elements, the network, and sources.
2: This is where you display the CSS of each element you can select in panel 1 when you are in the Elements tab.
· When you're in the Elements tab, you can to evaluate HTML and CSS, and you can also change HTML and CSS and preview the changes in real time. The changes are not saved to the dashboard, nor to file.
· When you're in the Network tab, you can get information about the requests made to the server. On the highest level, there are two types of errors you can expect here when using developer tools: the front end and the back end. When you get errors executing queries, it means that something went wrong when executing queries. You should first look at the request that is being executed; if it all looks fine, then you need to find the errors on the server side, and here the browser's developer tools can't help you. In these cases, you need to look at the errors on the server side and, if you're not getting the necessary information, you might need to increase the log level, but on the server side.
· When you're in the Sources tab, you can display each of the files loaded and needed for the execution of the dashboard. This is where is you can add breakpoints and pause the execution so that you can evaluate the code at a specific time. When the errors happening in the dashboard are not at the back end, then the Source tab is where you might need to look and to also interpret the logs being showed in the Console shown in 3.
3: The console is where you can get the messages being sent from the dashboard. This is where you need to search for errors. If they're not shown, you can press on the Esc key. We covered some examples of logs in Chapter 8, Visualizations Using CCC.
Don't forget to learn a bit more about developer tools.
Short tips
Keep one eye on the console, as it provides you with a lot of information. You can see the order of execution of the components, which part of the dashboard is being executed, and even errors and which file we get the logged information from.
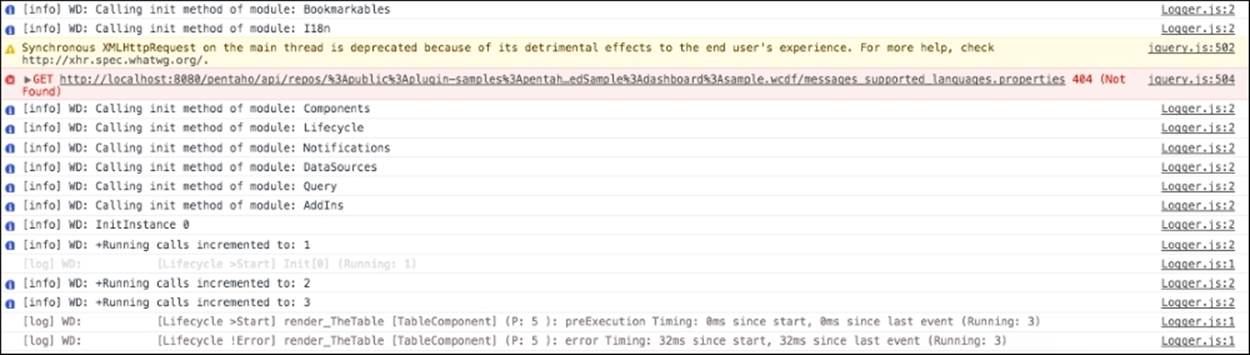
The previous screenshot also shows one error. If you click on the error, you will be redirected to the place where the error is coming from. If it's a JavaScript error, the code will be displayed in the source tab. If it's a network request, it will display details in the request. You can create a breakpoint there.
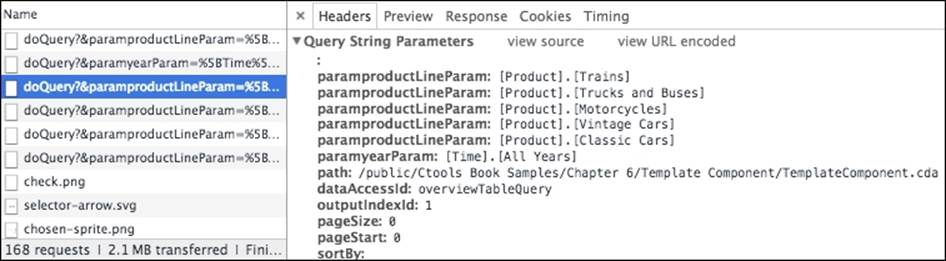
The preceding screenshot shows the details of one of the queries being executed. Before looking at the server-side logs, make sure all the parameters are correct, as the full request.
When using the Source tab, to create a breakpoint in the code you just need to click on the left side of the line where you want to stop. You will see a blue sign that identifies that there is a breakpoint, and the code execution will be stopped when that part of the code is being executed. You need to make sure that the code is executed so that the execution can be paused. You can then control the flow of the process by jumping into functions, to the next line, or to the next breakpoint. When hovering over the variable, its current value will be displayed.
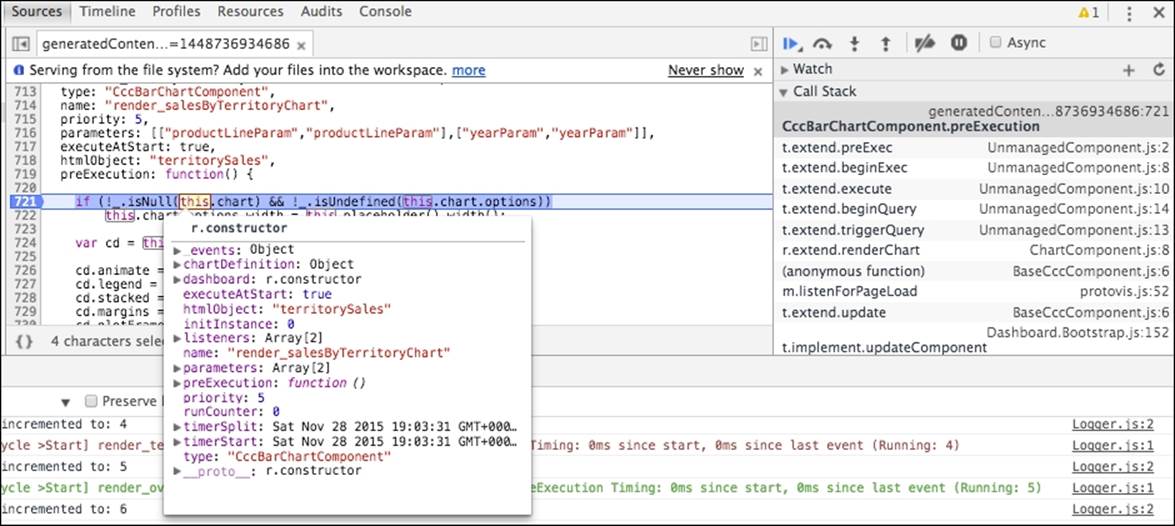
The preceding screenshot shows the code paused during the execution of the dashboard, and the mouse is hovering over the this variable, so we also see its value. In the top-right corner, you can see a toolbar, where you can jump to the next breakpoint, jump to the next line, jump into the next function, or jump out from current functions. You will also be able to disable breakpoints from pausing, among other options.
Delivering a solution
Before delivering a solution, you need to consider some aspects of the project. In reality, and as we saw earlier, they should be considered at the start of the project when everything is being planned. There are some phases of the project that are usually part of a successful project and can save you some time, but they can also help you create a better relationship with the customer and achieve a greater level of satisfaction. The documentation and knowledge transfer are two of those tasks, and another one is deploying a project and version control for our code.
Version control and deploying projects
You can't afford to lose your work, do you? Can you also spend most lots of lying changes for development to quality acceptance tests or production environment?
It's an important part of development that you keep all the code in a version control system. All content developed with or for Pentaho should be treated as a software artefact and tested and controlled as such. This is true even if we are talking about reports, such as the ones you can build with the standard Pentaho tools. For instance, a Pentaho Analyzer file is just an XML file that you can push into version control. The dashboards and CDA files that you produce with CTools are also files that you should push to the repository.
This also applies to the version of configuration files from your Pentaho system, and some custom extensions that are not deployed to the repository can be controlled via a external version control system. Finally, even though the DI repository does have version control, it lacks an advanced version control system (VCS) feature such as branching or tagging. For this reason, Pentaho recommends managing all artefacts with a VCS such as GIT or SVN.
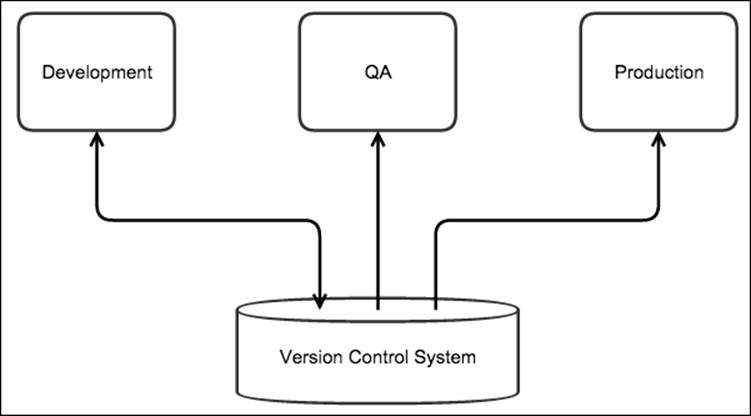
The following diagram shows a conceptual architecture to deploy and test in different environments. Developers have the complete Pentaho stack on their development systems, or they might be developing on top of the development server. As artefacts are created and developer-tested, they get checked into VCS.
Once a set of functionalities are completed and checked, they are pushed from development to the quality acceptance (QA) server that is used for integration and testing. When QA is done, the artefacts are checked into a production environment using VCS. Here, you can use a specific branch and/or tags for an upcoming version or a patch. Finally, when a production release is ready, the branch or tag can be used to check out all of the artefacts.
In order to isolate the developer work, it is useful to have a full copy of the development stack. Even some customers do not provide or allows to have a QA environment; the production and development environment should be exactly the same. Believe me, you won't deploy solutions from a development environment to QA or production if they do not match.
There is an issue with the way .cdfde files are saved to disk—the files are rewritten in such a way that the VCS will get confused and identify a lot of changes when in reality there was a small change. This can turn the process of merging files into a nightmare. When working as a team and working on the same file, there are merges that will be required, so be careful when committing changes and make sure you are doing the right thing.
Documentation
One important part of delivery to the customer is documentation. For you to be successful in your deliveries to the customer, you definitely need to include proper documentation. I agree that it's hard to create proper documentation, and that it's better to create interesting and useful stuff. Anyhow, it's not useful if people do not know how to make use of it or how to make it work.
You should train yourself to create documentation during some phases of the project. If you are not creating any documentation at the end of each completed phase of your work/tasks, you are doing something wrong. If you need to, you can break down your tasks into smaller tasks and schedule/spend some time building the documentation.
The truth is that it will save you time in the future, and it will also provide a better delivery for the customer, and enable you to reach the highest level of satisfaction for your customers. I'm sure you would prefer to select the most interesting projects and say, "I can't do it" or "I have no time" to a customer, rather than not being engaged again because the customer isn't truly happy with your work.
Knowledge transfer
Even if you are delivering proper documentation to the customer, it's possible and common that the customer will ignore it and archive it before even reading it. A good way to pass some knowledge is to make a knowledge transfer. And if you are asking why on earth you are building documentation, the answer is: because you are a good professional doing a great job and you wouldn't fail to deliver an important part of the project just because the customer probably won't give it any attention.
You won't need to spend a lot of time on the knowledge transfer, but you need to make sure that the customer has the necessary information to make proper use of your solutions and deliveries. This is a good opportunity to make it clear to the customer that the knowledge transfer does not replace the documentation and that reading the documentation is a prerequisite to the knowledge transfer. That said, we should never schedule a knowledge transfer before we can deliver the documentation.
I believe that it is also an advantage to request a list of questions regarding the documentation that the customer would like to be covered during the knowledge transfer. This removes their right to complain later about missing knowledge. Of course, that does not excuse you from creating proper documentation and preparing a proper knowledge transfer.
Some topics that you should cover during the knowledge transfer will be related to the project and the team you are delivering the project to. It's quite different when delivering a solution to an IT department than it is to a final customer, and your documentation and knowledge transfer should reflect this.
How to get help and help others
If you are an enterprise user, you have access to support (CDA, CDF, CDE, and CGG, which are the supported tools), but when you are not, how should you proceed? Well, you have multiple ways to solve your problem, and of course that will also be dependent on the problem you have found, the way you phrase the question, and how much information you are requesting. When you're not an enterprise user, you have some options. You will probably get a quick answer, but don't be disappointed if you don't—just try again.
For any and each of the ways to get help (even if it's enterprise support), you should always provide the most information you can. This includes the context of the problem that's happening. You should provide a good and clear description of the problem, a sample when ever possible (even if you need to create it with sample data), and/or screenshots when it makes sense to do so. You should also provide the configurations that are not there by default, because they might be important to replicate the problem.
You should always bear it in mind that people who are looking at your request or even trying to answer it might not guess what it's in your mind; alternatively, they may not be seeing the same as you. This might be the difference between getting a quick solution/response and not getting an answer.
When you want to get some help, you may want to ask the community, and you can use the forum to do so. You will find the forum at http://forums.pentaho.com and more specifically http://forums.pentaho.com/forumdisplay.php?80-Community-Tools-CTools.
The first step is to register as a user on the forum, so that you can create your own posts. First, you should search for your question/problem, which is also a good way to learn more. You might also want to search for JIRAs that are already closed and have a solution to your issue. If there is none, you can create a new post and wait for answers.
If you find some questions that you know the answer to, or have an idea how to solve them, you should reply with an answer, because you might be helping another user. This is the way you can help to build a strong community.
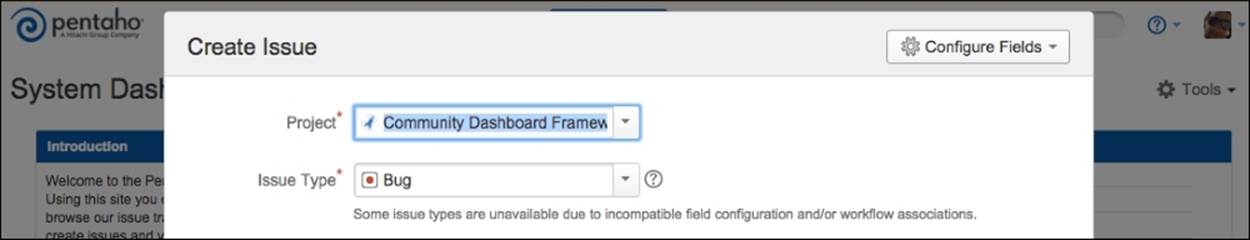
If you find that the problem is a bug, you should raise a JIRA. Go to http://jira.pentaho.com/secure/Dashboard.jspa and create a user. When you have a new issue, you need to select the project, so please ensure you select the right project. As said before, you should provide all the information that you are able to. You can see the selection of a project in the following screenshot:
The issues that you can create are not only bugs, but also improvements and new features. Improvements and new features are well received, and by suggesting these, you are contributing to a better product—a product that you are using.
For the JIRAs that you open, you will get notifications, so you will know their status. There is also a button that enables you to start watching some issues that you might be interesting on getting updates for.
You can also find some blogs that provide you with a lot of good content on how to use solutions and solve challenges. You should also be aware that having a good knowledge of the full Pentaho solution will be an advantage when trying to overcome some challenges. So don't discard any blog, help pages, or forums that might not be related to CTools, but that can provide information and knowledge about Pentaho, or even about front-end development, JavaScript, CSS, and so on.
A good way to get updates about new features or bug fixes is to look at the CTools change log at http://www.webdetails.pt/ctools-changelog. You will be redirected to the last change log, but you can select earlier versions. You can click on each of the lines displayed to get more information about it. You will even be able to get the code that was changed.
Summary
In this chapter, you learned how to embed CFD and CDE dashboards in third-party applications. You saw that we must first embed CDF or CDE and then embed the dashboards. When embedding a CDE dashboard, there are two ways to do it. When embedding, it might also be important to receive information from, and send it to, the dashboard or create links between dashboards, and for that we can make use of events.
We also talked about some aspects of the delivery of dashboards, which should also include documentation and knowledge transfers. Depending on who we are delivering the solution to, the technical level of the knowledge transfer and documentation might be quite different. Version control is an important part of the process when developing a dashboard; this is not part of the delivery, but it might be part of the deployment, so we discussed it in this chapter.
Finally, we covered where and how you can get help or a solution to your problems when developing dashboards using CTools. You can use the community to get help, report bugs, suggest improvements, and request new features.
Now that you have learned about CTools and how to create dashboards and Pentaho plugins, you should apply this knowledge to the dashboards that you already have, or just create new ones. Keep this book by your side while creating them, and you will see that it can be useful when you don't yet have a good knowledge of CTools.
You should go through the examples provided with the book, as this is important for you to get a better understanding of components, parameters, listeners, and so on. This book does not provides examples for all of the components, but now that you have an understanding of CDA, CDF, and CDE, you can take a look at the examples included when you install CDF and CDE. This way, you will develop knowledge of the available components, their properties, and how they can be used. You will also need to keep an eye on the backlog updates to the CTools, because they are getting better and better day by day, with new functionalities and improvements.
All materials on the site are licensed Creative Commons Attribution-Sharealike 3.0 Unported CC BY-SA 3.0 & GNU Free Documentation License (GFDL)
If you are the copyright holder of any material contained on our site and intend to remove it, please contact our site administrator for approval.
© 2016-2026 All site design rights belong to S.Y.A.