Learning Pentaho CTools (2016)
Chapter 3. Building the Dashboard Using CDF
There are two ways to build the community dashboards: using the Community Dashboards Framework (CDF) or the Community Dashboard Editor (CDE). You could leverage some of the work and do it faster when you are using the second option, but behind it, we will still be using CDF. You could choose not to read this chapter, but to have proper knowledge of how the CDE works, and to achieve better results, you should be able to understand the concepts behind the CDF API. In this chapter, you will get the chance to see the lifecycle of the dashboard and its components. Pentaho uses the CDF framework on the platform, so acquiring knowledge about how to use CDF can be an advantage when using other tools than CDE.
While covering CDF, we will present to you some of the most important and commonly used methods/functions available for this tool. Of course, we need to start covering the components and get them working. Sending parameters to the queries is an important part of the process, as you will definitely want to create interactive, and not static, dashboards. We will also cover how to work with filters and make components react to changes that the user makes to the dashboard.
To have a dashboard that could be rendered by any user in any part of the world, we should also provide our dashboards with the ability to change language, and the formatting of numbers and dates depending on the user's settings, which we can grab from the browser or from the Pentaho platform.
The main purpose of this chapter is for you to understand the lifecycle of dashboards and their components, to know what methods are available on the CDF API, and to see how to use them.
Understanding the basics of a CDF dashboard
We have already mentioned that CDF will work on the browser as a HTML page that will make use of the JavaScript and CSS languages, frameworks, and libraries.
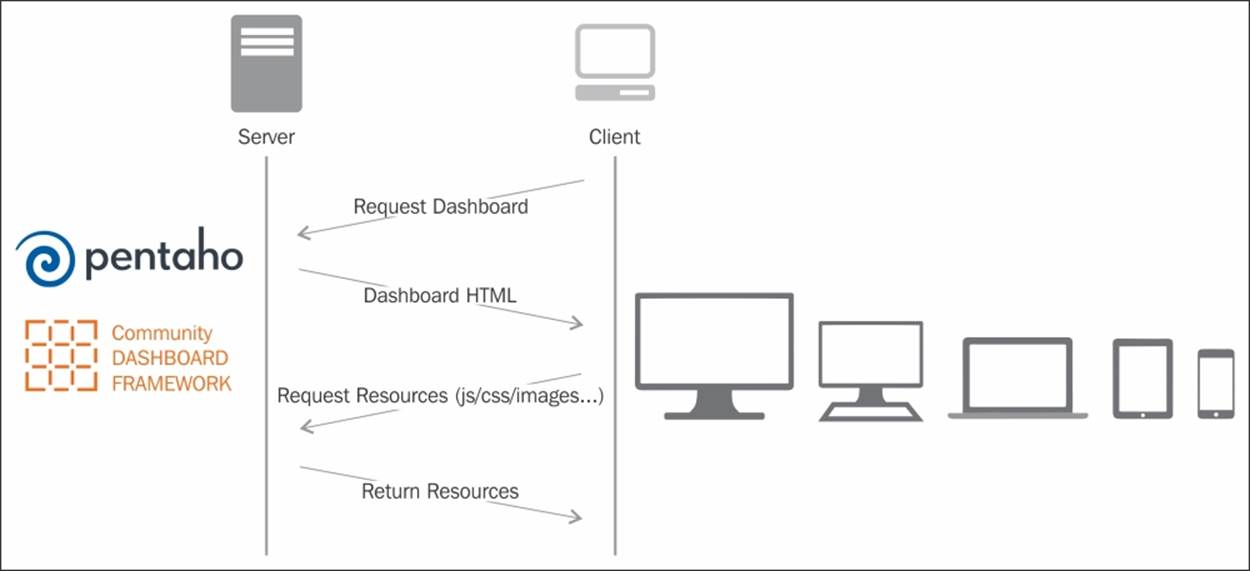
But how does CDF really work? When we are making a request to the Pentaho platform to get a dashboard, we make a request to a Pentaho plugin. That request is done through the Web API that the plugin is providing on the server side. This server-side code is written in Java, and by reading the dashboard's files, will send the HTML and JavaScript code to the browser for the execution of the dashboard on the client side (the browser). This code will include some scripts that are mandatory so that the plugins can execute themselves in the browser. The number of libraries may vary depending on the components included. The following image is a really simple diagram that should give you a clear understanding of how the requests to get the dashboards are handled:
Lifecycle of dashboards and components
The start of the lifecycle begins with the execution of the dashboard, when the request is made to the CDE or CDF. As we saw earlier, and to be more precise, the dashboard starts when the browser gets all the resources and starts executing the JavaScript code inside the dashboard. To start the execution of the dashboards, there is a function that needs be called, [dashboard].init(). This will make the browser start the execution of all the code that may be defined. For now, let's consider [dashboard] as just the name of a variable that we may use when creating the code for our dashboard.
In the following diagram, you will see two different areas:
· The dashboard lifecycle, which refers to the lifecycle itself
· The component lifecycle, which refers to each of the components on the dashboard
The dashboard will start, and during the execution of the dashboard, one or more components will be executed, so the diagram shows the lifecycle from the start of the dashboard until it finishes its execution, including the components themselves:
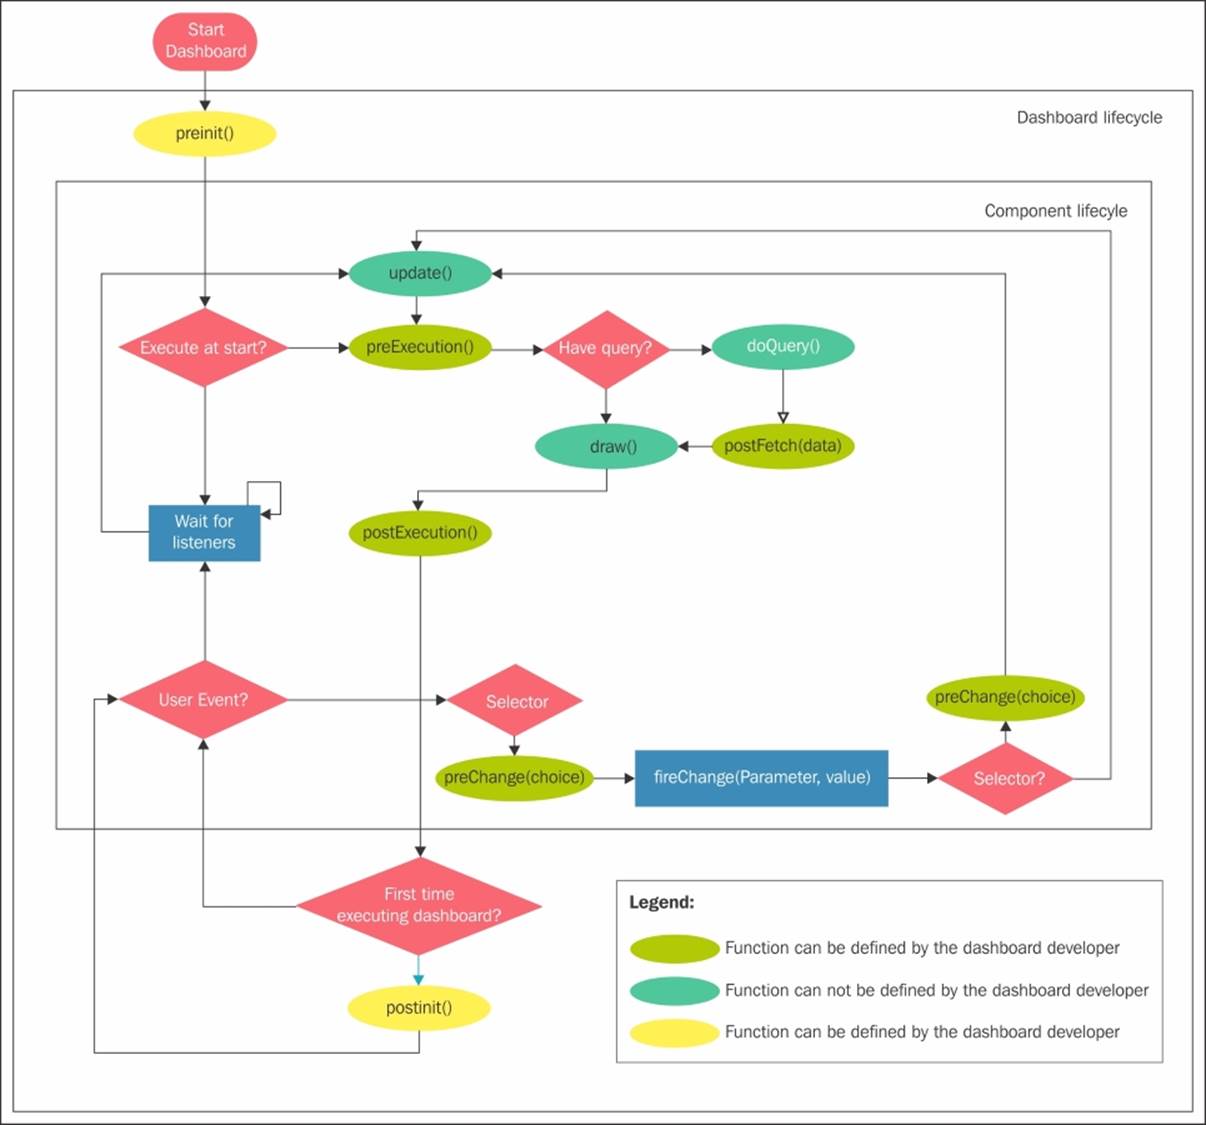
Looking at the legend section of the diagram, you will find some colors that identify the functions which can be defined by the developer, as part of the lifecycle, to extend the behavior of the dashboard and components. By looking at the diagram, you can identify whether they belong to the lifecycle of the dashboard or to the components.
To get a better understanding of the preceding diagram, we need to split it into two diagrams, so you can understand the lifecycle of the dashboard and the components themselves, and later on how they work together.
The preInit function will be called by CDF and may include some custom code. If you define the function with some code inside, the code will be executed just before the initialization of the dashboard. So, you will execute the lines inside just before CDF starts executing the dashboard:
[dashboard].preInit = function() {
// Code to execute before CDF starts the execution of the
// dashboard, goes here.
}
As the name suggests, code is to be executed before the initialization of the dashboard.
You should also have noticed that there is a function called [dashboard].postInit(), which works exactly the same way as the previous function, but will only be executed after it finishes the execution of the dashboard, just before delivering control to the user. These two functions are not executed again, unless you refresh the page. At this time, the changes in the dashboard will only be executed by the interaction of the user, or by some custom code. Of course, the dashboard will keep working, but no pre- or post-execution will be called. So, the lifecycle of the dashboard will be something like the following diagram:
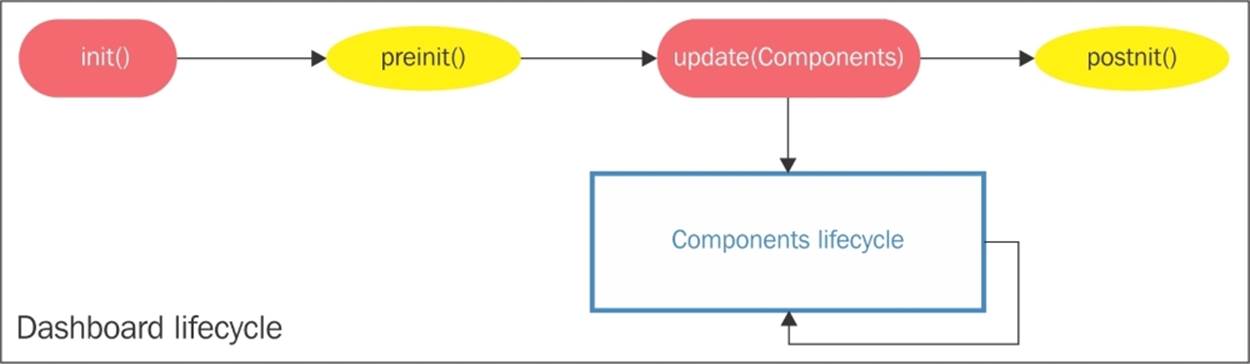
Let's see how the lifecycle of the dashboard works. First, the dashboard's init() function is called and starts the execution of the custom code that can be placed inside preInit(). The next step is to start the execution of all the components, ordered by the grouped priority of execution, and when CDF finishing the execution of the task, CDF will execute the code inside postInit(). When the components are executed, the lifecycle of the components will keep running and changes in the dashboard will depend on listeners (these are parameters/variables that the components can listen to in order to be notified about changes). These listeners will update the components based on a user's, or a predefined action.
On the complete diagram, the one that includes both the dashboard and components lifecycle, we can see that components are executed on the initialization of the dashboard when the executeAtStart property is set to true; otherwise the component will be started and will only be executed when fired by a listener. When a component is executed, its lifecycle will be as shown in the following diagram:
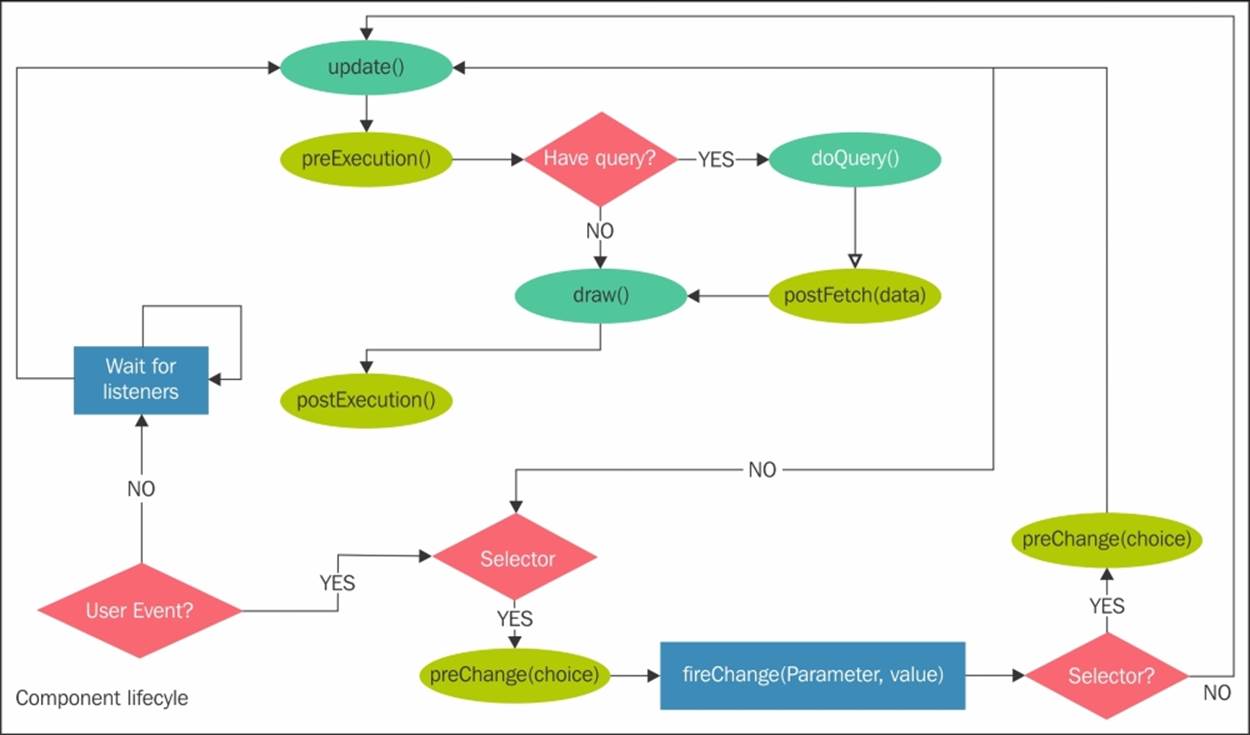
When executing a component, the first function to be called is preExecution, and as an option, the developer can place some code to be executed inside the function.
From there, if there is a query to execute, CDF will call a function that is responsible for the execution of the query and, after getting the results, will call postFetch with an argument that is the result set of the execution of the query. The user can also specify the code to be executed, which can be used to make necessary changes to the results.
From there, or just if there is no query to be executed, CDF will call the draw function for the component and start rendering the elements on the page. After that, postExecution will be called, which is a function that can also be defined by the developer to run some custom code. This can be used to perform some actions after the components have been rendered on the page, so we can use it to make some change on the Document Object Model (DOM) of the web page.
The preExecution function should be defined as shown in the following example, to prepare the components and specify some options:
[component].preExec = function() {
// Code to execute before CDF starts the execution of the
// dashboard, goes here.
}
If for some reason we need to cancel the execution of a component, there is the chance to return a value of False inside the pre-execution function. This makes it possible to make some validations before proceeding with the execution of the component(s).
The postFetch function is where we can manipulate the results from the execution of the query. It can be defined as:
[component].postFetch = function(data) {
// Code to manipulate data. Should always return a valid result.
return data;
}
The postExecution function, as already mentioned, can be used after the components, and elements that belong to it are rendered on the DOM, and can be specified as follows:
[component].postExec = function() {
// Code to execute before CDF starts the execution of the
// dashboard, goes here.
}
This ends the first cycle of the execution of the component and delivers the next execution to the events listener. The main function of the listeners is to keep listening for changes to a specific parameter or parameters. The listeners will be pointing to a parameter on the dashboard that will be kept under observation, in order to request the update of a component every time CDF gets notified about a change to that parameter.
The change of parameter values may be dependent on, or associated with, user interaction. When the user interacts with the dashboard, this will fire a change in the values of a parameter that is being observed, initiating the execution of the components that are listening to it, or to them.
User interaction can be made by the click of a button, selecting from a dropdown, or even clicking on a radio button. Filters and/or selectors are particular cases of components that also have two more functions that can be defined by the user. When applying a change to the selector, the components will fire a change in a parameter.
One of the functions will be triggered before that, preChange, and another one after the parameter is already changed, postChange. Both functions can receive one argument that is the new choice made by the user. The preChange function can be used to make validations, and postChange can be used to perform some actions after the changes are confirmed in the parameter:
[component].preChange = function(usersChoice) {
// Code to execute before the fireChange() of the parameter
return usersChoice;
}
The difference between a selector and a filter is that in a selector, at least one value should be selected, while in a filter, when you don't select a value you are selecting everything. That's because on a filter if you don't do a selection, you are not filtering.
The postChange function is pretty much the same syntax, except the name of the function and of course the code inside to be executed. Here, you will not need to return a value.
This is the hardest part of CDF to understand, but when you understand the workflow of the lifecycle, you will get better dashboards than before. Don't worry if you didn't fully understand it, as we will go back to some of the concepts during the rest of the book.
Creating a CDF dashboard
Nowadays, CDF can make use of Asynchronous Module Definition (AMD). AMD is a JavaScript specification that defines an API on top of which we are able to create code modules and their dependencies. Modules can be loaded asynchronously, even if they depend on each other. AMD concepts also allow the developer to encapsulate code in smaller, more logically-organized files.
RequireJS is a JavaScript file and module loader that implements the AMD specification that CDF is using. One of the advantages is that you can create and reuse modules without polluting the global namespace. The more polluted your global namespace is, the bigger the chance of a function/variable collision. Another advantage is that you can structure your code into separate folders and files, and RequireJS will load them asynchronously when needed, in a way that ensures everything works just fine.
The sample code that we are using in this book is already based on the use of RequireJS inside CDF. These changes will also leverage the process of embedding a dashboard or part of a dashboard. We will cover how to embed a dashboard or part of it in third-party applications later in the book. For now, you should just focus on learning how to create a dashboard.
To build a CDF dashboard, you need to create two main files that are mandatory:
· XCDF: This is the main file that identifies the dashboard as a CDF dashboard type inside Pentaho. This is the file that identifies the dashboards inside Pentaho, and where the general settings are. For instance, we can set the name, template, and style for our dashboards. This file is written using the XML syntax.
· HTML: This is the template file with HTML content where the components will be rendered.
XCDF is the main file, where the root element <cdf> and the following child elements are:
· <title>: This corresponds to the title displayed in the Pentaho User Console (PUC).
· <author>: This is the author of the file that will be displayed inside the user console.
· <description>: This is the description displayed in the PUC and on the browser.
· <icon>: This is the icon to be displayed.
· <template>: This is the HTML template file to render. This is the second mandatory element.
· <style>: This is the name of the style to use to render the dashboard.
· <require>: This is set to true or false to define whether or not we're using the RequireJS dashboard. We can load a different style file with the require suffix.
The content of the XCDF file should be something like:
<?xml version="1.0" encoding="UTF-8"?>
<cdf>
<title>My first dashboard!</title>
<author>My Name</author>
<description>My first dashboard!</description>
<icon></icon>
<template>myFirstDashboard.html</template>
<style>clean</style>
<require>true</require>
</cdf>
But what's the difference between the properties style and the template? Well, the difference between them is that the style will have the HTML of the full page and can be used for multiple dashboards. Let's say that the style will have the content that is similar from dashboard to dashboard. On the other hand, the template is the file that has the HTML and JavaScript code to render the dashboard.
The template or the HTML and JavaScript would be something like:
<style>
</style>
<div class="container-fluid">
<h1>My first dashboard!</h1>
</div>
<script language="javascript" type="text/javascript">
var dashboard;
require(['cdf/Dashboard.Clean'],
function(Dashboard) {
dashboard = new Dashboard();
dashboard.init();
}
);
</script>
We can see that there is the <style> element where we can add some CSS to be applied to our dashboard. Here, we can also have references to external files and extend the dashboard, including CSS or JavaScript code. This is pure HTML, so here you can do what you would usually do when on a web page.
You can also see some HTML tags where all the content will be placed, so here you should have the layout needed for your dashboard. At the end, there is the <script> tag with the JavaScript code to execute the dashboard. On the last sample code, you can also see that we are calling the required modules that we need for our dashboard.
To be able to have the core code of the dashboards available to use, we must include a module that specifies the dashboard type. In the previous example, we did not specify any other component or module.
At least one of the following modules that correspond to a dashboard type should be included:
· [cdf/Dashboard.Clean]: This will load its main dependencies, and will load the base code for the dashboard. It will not load any framework to be used in the layout, and you can use one of your own preferences.
· [cdf/Dashboard.Bootstrap]: This will load the same libraries and code as the previous one, plus the Bootstrap framework. This way you have the code for the dashboard, but can also make use of this great framework to build responsive dashboards. We will cover a little bit more on this framework later.
· [cdf/Dashboard.Blueprint]: This will load the same libraries and code as the first one, plus the Blueprint framework.
Tip
Use Bootstrap to build responsive dashboards
During this book, we will just cover the Bootstrap framework by including a call to cdf/Dashboard.Bootstrap. We will only use a Bootstrap dashboard type in our examples. This is a more advanced framework that allows us to build responsive dashboards, which it is also possible to use in CDE dashboards. You should use the cdf/Dashboard.Clean module if you want a clean dashboard. That way you can use another framework.
You can see the dashboard style as a file that will have the common code to apply to multiple dashboards. When you are creating dashboards for multiple customers, you can create/adapt a template for each customer and create dashboards that will make use of the code inside the style page file. Inside your [baserver]/pentaho-solutions/system/pentaho-cdf file, you will find some HTML pages that can be used by defining the style element. The options for them are as follows:
· Clean: This will make use of the code defined in the files template-dashboard-clean-require.html and template-dashboard-clean.html. Selecting one or the other will depend on the flag on the <require> element. If the value is true, then template-dashboard-clean-require.html will be used, and template-dashboard-clean.html otherwise.
· Mantle: This will make use of the code defined in the files template-dashboard-mantle-require.html and template-dashboard-mantle.html. Like the previous options, we will need to set the <require> element with a value of true or false.
The difference between them is that they will apply different styles/wrappers to the dashboard. The first one will not apply any style at all, while the second will apply a style that is related to the new Pentaho theme.
Tip
Defining an empty or invalid style for a dashboard
If we do not set a valid option or available style when creating a new CDF dashboard, the CDF API will make use of the default one. It will use the dashboard-template.html file.
In the last example code we presented, you can also see functions that are called when the modules are loaded, and these functions will receive as an argument the module that we have included. In the previous example, we just included the dashboard type, and we are using an argument with the name dashboard. This variable will make reference to the dashboard object that contains the functions to add components, add parameters, start the execution of the dashboard, and so on.
In this chapter, we will cover some of the available functions. For now, you need to understand that to create a dashboard, we need to create a new instance of the dashboard object, and later make a call to the init() function. This will create the dashboard and trigger its execution.
Hands-on dashboards
At this point, you should be able to understand the basic concepts to create a really simple page showing just the text My first Dashboard!. To do so, you just need to follow these steps:
· Inside your file system, create a file with the name myFirstDashboard.xcdf. You should use the code that we previously used for the XCDF file, in the Creating a CDF dashboard section.
· Create another file with the name myFirstDashboard.html in the same folder as the previous file, and write the code that we previously used for the template files (HTML), in the Creating a CDF dashboard section.
Compress the folder with the two files using the ZIP file format, and upload the file to the Pentaho repository. Once uploaded, you need to double-click the myFirstDashboard.xcdf file to open the dashboard. You should get a simple page, showing the text My first Dashboard!.
Tip
Using the Community Text Editor (CTE) to edit files inside Pentaho
CTE is a Pentaho plugin that you may install using Marketplace. The plugin provides the ability to edit the contents of a file within the JCR repository, directly from the PUC. You will not be able to create the files with it, but will be able to change the content and save the changes, which will immediately be recognized by Pentaho. This is very useful if you want to edit .xcdf, .html, .css, .js, and other file formats. More information can be found at: https://github.com/webdetails/cte.
You will find the sample code inside the book samples in the /CtoolsBookSamples/myFirstDashboard folder.
Using components inside the dashboards
We have not really covered the concept of a dashboard if we do not show any Key Performance Indicators (KPIs), charts, tables, and so on. CDF provides many components we can use to create the dashboard. To use them, we just need to extend the code we used previously. You saw that we need to include the modules we will need. Each component is a module that has its own dependencies that will be loaded automatically when we include the component.
The previous example shows the code that should be placed inside the XCDF file. This code creates a dashboard with a simple text component that returns a simple Hello World! message.
If you look at the code, you will find that we are including the dashboard module and also the component module. You will see that we are already using the Bootstrap framework. For this case, we are also including cdf/components/TextComponent, the module that makes it possible to use a text component, one of the simplest components that exists within CDF. To make it possible to use the component, we also need to specify an argument in the function that will represent the object of the component being called.
To define a new component, we should make a call to the dashboard function addComponent with an argument that will be a new instance of the text component, and we can create as many instances as we would like. When creating instances of a component, we need to set some properties and/or functions, and this will depend on the component that we are including in the dashboard:
<style>
.msgContainer {
background-color: #4682B4;
color: white;
}
</style>
<div class="container-fluid">
<div id="container" class="container">
<div id="row" class="row">
<div id="col" class="col-sx-12">
<div id="msgContainer" class="msgContainer"></div>
</div>
</div>
</div>
</div>
<script language="javascript" type="text/javascript">
var dashboard;
require(['cdf/Dashboard.Bootstrap', 'cdf/components/TextComponent'],
function(Dashboard, TextComponent) {
dashboard = new Dashboard();
dashboard.addComponent(new TextComponent({
name: "myTextComponent",
type: "textComponent",
htmlObject: "msgContainer",
executeAtStart: true,
priority: 5,
expression: function() {
return "Hello World!";
}
}));
dashboard.init();
return dashboard;
}
);
</script>
The next step, after creating all the instances of the components to use and setting all the necessary properties and/or functions for each component, is to initialize the dashboard by calling the init() function of the dashboard instance.
You should have noticed that we are creating a variable outside the dashboard module, which we then make use of inside the dashboard and assign to the dashboard instance. This will make it possible to interact with the dashboard later. We will have a dashboard variable available in the global scope, so we will be able to create interactions between dashboards, but we will cover that later on in the book.
If you create a .xcdf file with a template tag that is pointing to the previous code, and execute by making a call to Pentaho, you will get a dashboard with your first component already working.
You should have noticed a property called htmlObject. This property is used to specify where on the dashboard the components should be rendered. It needs to point to the name of an element of your HTML. This will make the component create all its elements as children of the element specified in the htmlObject property.
Defining data sources for components
We don't want static dashboards, we want to query data to be shown in them. There are two ways to set queries in components. The data sources can be of one of two types, CDA and non-CDA:
· Going the CDA way, you need to define it using the query it's defining, inside the component, an object such as queryDefinition or chartDefiniton depending on the component, with a set of properties:
· path: This is the path that points to a CDA file. You can make use of the CDA files created as explained in the chapter dedicated to CDA.
· dataAccessId: This should set the ID of an available data source, also covered in the CDA chapter, that is set in the file we are pointing at.
· Going the non-CDA way, by just using a simple SQL or MDX query, we can define, inside the component, an object queryDefinition or chartDefiniton, depending on the component, with a set of properties:
· queryType: This is the type of the query selecting one of the two values available, mdx or sql.
· jndi: This is the name of the JNDI defined in Pentaho.
· catalog: The catalog can be seen as the Mondrian schema to be used. When using mdx, we should also specify the schema name to use. No need when using a SQL query.
· query: This is the function that returns the SQL or MDX query to get the data.
In the following two samples, we have two dashboards with a table component each. We used a table component to be able to present the results that come from the query. Let's look at the first example, where we are using a query defined in a CDA file, and grab the results from a query that is set in the CDA file.
The first step will be to set a query like we covered in the last chapter, after which we need to point to the CDA by setting the name and location of the file, and the data access source that we want to use. You can see that path and dataAccessId are defined inchartDefiniton.
The sample query that we are using is the one we created at the end of the last chapter:
require(['cdf/Dashboard.Bootstrap', 'cdf/components/TableComponent'],
function(Dashboard, TableComponent) {
dashboard = new Dashboard();
var dashboardPath = dashboard.context.path.match(/^(\/([^/]+\/)*)(.*)$/)[1];
dashboard.addComponent(new TableComponent ({
name: "top50Customers",
type: "tableComponent",
parameters:[],
listeners: [],
chartDefinition: {
path: dashboardPath+"customers.cda",
dataAccessId: "top50Customers"
},
htmlObject: "table",
executeAtStart: true,
priority: 5
}));
dashboard.init();
return dashboard;
}
);
You should be asking why use chartDefiniton? Well, I really don't know why, maybe some mistake that cannot be undone. The main idea you need to be aware of is that the components that are able to represent data coming from a query will do this by defining chartDefinition or queryDefiniton, depending on the component that we are using. By the end of this chapter, you will know what to use in what components, so let's proceed and you can learn something else before we cover that part.
The second example depicts how to directly call an MDX query without the need for a CDA file:
require(['cdf/Dashboard.Bootstrap', 'cdf/components/TableComponent'],
function(Dashboard, TableComponent) {
dashboard = new Dashboard();
dashboard.addComponent(new TableComponent ({
name: "top50Customers",
type: "tableComponent",
parameters:[],
listeners: [],
chartDefinition: {
queryType: "mdx",
jndi: "SampleData",
catalog: "mondrian:/SteelWheels",
query: function(){
return "select NON EMPTY {[Measures].[Sales]} ON COLUMNS,"+
" NON EMPTY TopCount([Customers].[All Customers].Children, 50.0, [Measures].[Sales])" +
" ON ROWS from [SteelWheelsSales]";
}
},
htmlObject: "table",
executeAtStart: true,
priority: 5
}));
dashboard.init();
return dashboard;
}
);
You should know that when grabbing results this way from a query, you are making a POST request to the CDF Web API, calling viewAction, which will execute xAction, and you'll get the result in an appropriate format that can be understood by the table component. This call will execute xAction, located inside the Pentaho repository at /public/plugin-samples/pentaho-cdf/actions/jtable.xaction, and pass some of the parameters we have specified, such as the query type, JNDI, the catalog, and query. The result is then processed by the component, which will finally render the results in the browser.
What's the best option? For many reasons, such as security, options, query abstraction, and cache among others, I would advise that you always use CDA. CDA allows you to abstract from the queries, and will let you work as a team. While one of your team is building the queries and all the related tasks, you can just focus on the dashboard, but using the data sources defined within, you have the ability to query for data. When using CDA, you will have your query results cached, so you will have better response times than using the other option.
As we saw earlier, when using SQL queries you could allow SQL injection, but CDA will avoid those malicious requests. Another reason is to have private parameters without the need to make changes to your xAction, change that would affect all other requests that are being executed through that same xAction. There are many more options and data sources you can create using CDA, and I would even risk saying that there is no data source from which you are not able to get data. I believe that these reasons are enough to justify executing queries through CDA.
To get more information about them, please refer to: http://wiki.pentaho.com/display/ServerDoc2x/03.+Action+Sequences.
Tip
Pentaho Action Sequence, also known as xActions
The xActions have a lot of utility inside Pentaho, but they can be replaced by Kettle transformations in some cases. If you have the ability to install a new plugin, you can leverage your work and use Kettle transformations, and replace some xActions. There is a plugin called Startup Rule Engine, which you can find in Marketplace, that allows you to execute Kettle transformations during the start up, login, or logout from Pentaho. To be honest, I don't dislike xActions, even if it's hard to debug and takes some time to create; xActions are fast to execute.
Creating and using parameters in data sources
You can see a parameter as a variable which is storing some value. In the last example, we created a parameter, and now we want to make use of it so we can send it to the query and have queries that can give back different results, depending on the input. To achieve this, we need to have a parameter inside the query in a way that we can later pass some value through the parameter. You already saw how to create parameters in the queries and how to set default values. Now we want to send a value to the query that can change depending on the user interaction, so the user can get the intended results, and have a proper visualization with the correct information in it:
require(['cdf/Dashboard.Bootstrap', 'cdf/components/TableComponent'],
function(Dashboard, TableComponent) {
dashboard = new Dashboard();
dashboard.addParameter('marketDashParam','[Markets].[All Markets]');
var path = dashboard.context.path;
var dashPath = path.substring(0,path.lastIndexOf('/'));
dashboard.addComponent(new TableComponent({
name: "top50Customers",
type: "tableComponent",
parameters:[['marketQueryParam', 'marketDashParam']],
listeners: [],
chartDefinition: {
path: dashPath+"/customers.cda",
dataAccessId: "top50Customers"
},
htmlObject: "table",
executeAtStart: true,
priority: 5
}));
dashboard.init();
return dashboard;
}
);
After creating a new instance of the dashboard, we are creating a parameter using the line of code: dashboard.addParameter('marketDashParam', '[Markets].[All Markets]'). This will create a parameter in the dashboard that can be used by components or used on custom code. In the previous code example we are creating a variable with the name marketParam that will have a default value of [Markets].[All Markets].
We are also finding the dashboard path by getting it from dashboard.context.path, so that we can point the dashboard to the CDA file. When creating a new instance of the table component, we are also setting the property parameters. When triggering a query, this property will be used to find out which parameters and value should be sent to the queries.
What CDF needs to do is request a query and say, Hey these are the parameters you have here, and they should be replaced with these values. The parameters property needs to be defined with an array of arrays, and each array will be a pair of a query parameter name and a dashboard parameter name. In each pair, the first value is used to identify the name of the parameter used inside the query, and it will be replaced before sending the query. The second value of each pair is the name of the parameter of the dashboard from where we want to grab the value to be sent. So we need to set as many values pairs as parameters names and values we want the query to use.
When defining a parameter/variable, we should have a default value, and once sent to the query, we will overwrite the default values that we have set in the CDA file. If you change the value of the parameter in the dashboard later and fire the query again, it will use the value that the dashboard parameter is storing. If you don't specify a default value, no value will be passed to the query, and a default value that may be specified in the query might be used. Neither of these are mandatory, but it might break your query or make the query not return the results.
We have started to cover listeners, and we will be talking about them in this and the next chapter. The listeners will give us a way to receive a notification when there is a change in a parameter. A listener points to a parameter, so if the value of that parameter is changed, the component is notified and updated.
As we covered in the lifecycle, when a component executes/updates, this will trigger a new query. In the component, we need to define the parameters that should be sent to the query. So, if you set the parameters to be on the list of listeners, and if you also set the parameter on the parameters to be sent to the query, every time a change is fired in the parameter, the parameter is sent to be used in the query. The request can be processed using, for instance, the value of the parameter as part of a where clause of a query.
If you create a new dashboard with the previous code, you will get a table showing all the customers. If you change the value to [Markets].[APAC], you will get only the customers that belong to the territory identified by APAC. It's not the intention of this book to teach you MDX, MQL, SQL, or how to apply filters, so if you don't know any MDX, you should try to understand it a little bit, as this could save you a lot of time and work. Just for the users that are not familiar with MDX, when applying [Markets].[All Markets], we are applying a filter that will display customers for all the markets. That way we are not applying any filter.
Most of the examples that will be shown here use MDX. Building a dashboard usually works better with MDX, and has other big advantages such as security. It's not mandatory for you to build a dashboard with MDX, but you should really consider it.
Take a look at the following diagram showing Pentaho CDF Dashboard:
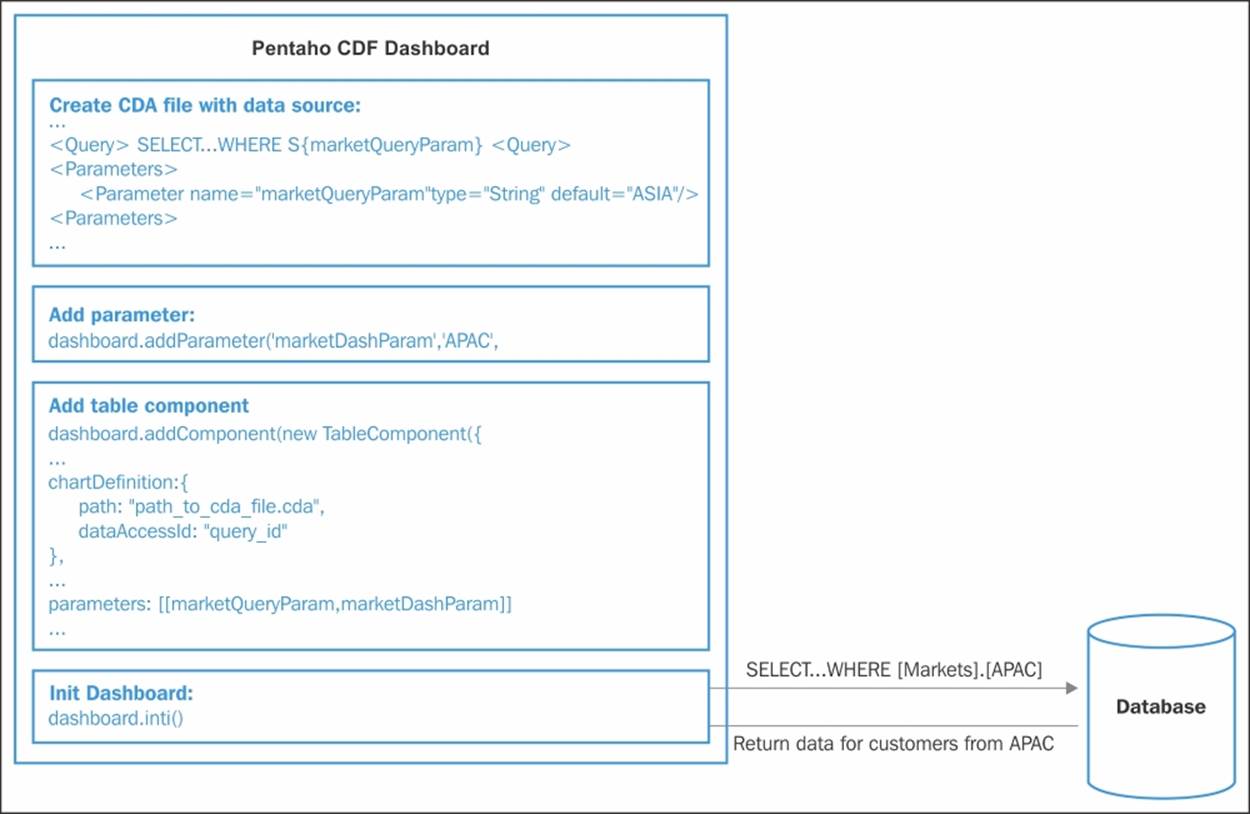
To get a better understanding of how to use parameters and how they work with queries:
1. First, you need to set the connection and create the queries. You need to specify the connection and the data access identifier, where you need to specify the query and the query parameter to be replaced just before the request sends.
2. The second step is to create the territoryDashParam parameter on the dashboard.
3. Next add the component and define the path to the CDA file, which data access identifier to use, and the parameter mapping between what you have in the query and in the dashboard.
4. Last, initialize the dashboard, which will trigger the query passing the value of the dashboard parameter you have at that particular point in time, to execute the query. The results will then be rendered in the dashboard using the component you have set.
The importance of listeners inside the components
We do not want our users to be executing code and making the changes. What we want is to have a way to let the components know that they need to update themselves when a change happens in the dashboard. That's the purpose of the listeners. You could say that a component should be listening for the changes in the parameter(s) that exist in the dashboard. Components have a property called listeners, which you should define as an array. When creating a dashboard, what do you think provides the user with the ability to interact with the dashboard during runtime? The answer is, mostly the listeners.
In the console of your browser, run the following lines:
dashboard.setParameter('marketDashParam', '[Markets].[EMEA]');
var component = dashboard.getComponentByName('top50Customers');
component.update();
The first line of the code is used to change the value of the dashboard parameter, the second is to get the component instance, and the last one is to update the component. You will see that the dashboard now shows the customer data of another market territory.
Tip
The developer tools in your browser
Each browser has their own developer tools, which can have some differences from browser to browser, but the concept and main functionality are the same. Even if every browser, has its own developer tools, you might be able to install Firebug.
The array that should be defined on the listeners will have all the parameters that the component should be listening for to know about changes. So, let's suppose we set the table component to listen to marketDashParam. Later, when the user changes the parameter value, they can also notify the components that are listening to it. This will automatically trigger the update of the component.
The following code shows you how to set the listeners. You will see in the example that a listener is being set on the market parameter:
require(['cdf/Dashboard.Bootstrap', 'cdf/components/TableComponent', 'cdf/components/SelectComponent'],
function(Dashboard, TableComponent) {
dashboard = new Dashboard();
dashboard.addParameter('marketDashParam', '[Markets].[All Markets]');
var path = dashboard.context.path;
var dashPath = path.substring(0,path.lastIndexOf('/'));
dashboard.addComponent(new TableComponent({
name: "top50Customers",
type: "tableComponent",
parameters:[['marketQueryParam', 'marketDashParam']],
listeners: ['marketDashParam'],
chartDefinition: {
path: dashPath+"/customers.cda",
dataAccessId: "top50Customers"
},
htmlObject: "table",
executeAtStart: true,
priority: 5
}));
dashboard.init();
return dashboard;
}
);
In CDF, we have a way to change the value of a parameter and send a notification, in order to update other components. This can be done through the execution of the following line of code:
dashboard.fireChange('marketDashParam', '[Markets].[EMEA]');
As soon as you execute the preceding code line, you will see an update in the dashboard.
Interaction between components
However, this is not enough—you need something more, because we still need to execute a line of code to make changes happen. If you make a filter available to the user, a dropdown for instance, which makes them able to apply changes to the table, they will not hesitate to use it. I am pretty sure you will want to do this, if not with a dropdown, then with a date selector, a button, a radio button, a checkbox, a simple text box, or whatever you can think of where the user can make a change or selection.
The first step is to add some kind of component that can provide interaction with the user. For our purposes, let's use a simple dropdown. The following code is an example of how to create a new instance of a select component:
new SelectComponent({
name: "marketFilter",
type: "selectComponent",
parameter: "marketDashParam",
valueAsId: false,
queryDefinition: {
path: dashPath+"/customers.cda",
dataAccessId: "territories"
},
htmlObject: "selector",
executeAtStart: true,
priority: 5
}));
Defining a component means simply applying settings to properties. We do this by setting properties and/or functions to the components. You can see in the previous code that the first two properties are the type and name of the component. Next, we set a parameter that states which parameter the selector should write the user selection with when a new value is selected. At the beginning, the selector will display the option that corresponds to the value inside the parameter, but once the user selects a new option, the component will trigger a change in the parameter, changing the values and notifying the other components about the changes.
Please note that we are now talking about a parameter and not the parameters of the component:
· Parameters is the property that allows us to specify the parameter/variable that will be sent to the query.
· Parameter is the variable where to set/get values.
You can see the parameter of a select component as the variable where the value of the selection will be stored, while the parameters are the variables that will be passed to the query on its request.
They can both be set on a single component, but why? Let's imagine the case where you have a selector that is dependent on another selector, and it gets the values for the dropdown from a query. In this case, we need to specify the parameters that should be used on the query. Anyhow, we also need to define the parameter/variable where we can store the selected value when the user makes a selection.
You also need to set datasource, sometimes referred to as the query to use, and htmlObject, the element name, where the component will be rendered in the layout. Should the component be executed at the beginning of the dashboard? If yes, we need to set the executeAtStart property to true, and also the priority of execution.
You will see later that is possible to set parameters and listeners on the selectors, in case you want to have cascading filters, where the value of a filter will be used in the query of another filter. Just don't forget that the big difference between parameter and parameters is that in a parameter you are setting the name of the variable that will store the selection, and in parameters you are saying which parameters should be used to execute the query and populate the dropdown or whatever.
Tip
Populating a selector with data can be done using a query or a values array
Usually, you would set a query to populate a selector, but when a small amount of static values are required, we can use the valuesArray option.
Let's look at an example of how to set the properties, have a selector making changes to a parameter, and notify the table component about changes:
require(['cdf/Dashboard.Bootstrap', 'cdf/components/TableComponent', 'cdf/components/SelectComponent'],
function(Dashboard, TableComponent, SelectComponent) {
dashboard = new Dashboard();
dashboard.addParameter('marketDashParam', '[Markets].[All Markets]');
var path = dashboard.context.path;
var dashPath = path.substring(0,path.lastIndexOf('/'));
dashboard.addComponent(new SelectComponent({
name: "marketFilter",
type: "selectComponent",
parameter: "marketDashParam",
valueAsId: false,
queryDefinition: {
path: dashPath+"/customers.cda",
dataAccessId: "territories"
},
htmlObject: "selector",
executeAtStart: true,
priority: 5
}));
dashboard.addComponent(new TableComponent({
name: "top50Customers",
type: "tableComponent",
parameters:[['marketQueryParam', 'marketDashParam']],
listeners: ['marketDashParam'],
chartDefinition: {
path: dashPath+"/customers.cda",
dataAccessId: "top50Customers"
},
htmlObject: "table",
executeAtStart: true,
priority: 5
}));
dashboard.init();
return dashboard;
}
);
You are now starting to have a dashboard that is able to provide interaction to the user, where the user can select a market to filter the customers that get to the table. It works without the need to execute any other line of code; interaction will be enough.
The following example dashboard is illustrated with two selectors, one for the territory and another one for the country. You will see that when selecting a particular territory, only the countries for that territory are showing:
<div class="container-fluid">
<div class="container">
<div class="row">
<div class="col-xs-12">
<h1>CTools Book Samples!</h1>
</div>
</div>
<div class="row">
<div class="col-xs-12 col-md-6">
<div id="territorySelector" class="selector"></div>
</div>
<div class="col-xs-12 col-md-6">
<div id="countrySelector" class="selector"></div>
</div>
<div class="col-xs-12">
<div id="table" class="table"></div>
</div>
</div>
</div>
</div>
<script language="javascript" type="text/javascript">
var dashboard;
require(['cdf/Dashboard.Bootstrap', 'cdf/components/TableComponent', 'cdf/components/SelectComponent'],
function(Dashboard, TableComponent, SelectComponent) {
dashboard = new Dashboard();
dashboard.addParameter('territoryDashParam', '[Markets].[All Markets]');
dashboard.addParameter('countryDashParam', '[Markets].[Country].Members');
var path = dashboard.context.path;
var dashPath = path.substring(0,path.lastIndexOf('/'));
dashboard.addComponent(new SelectComponent({
name: "territoryFilter",
type: "selectComponent",
parameter: "territoryDashParam",
valueAsId: false,
queryDefinition: {
path: dashPath+"/customers.cda",
dataAccessId: "territories"
},
htmlObject: "territorySelector",
executeAtStart: true,
priority: 5
}));
dashboard.addComponent(new SelectComponent({
name: "countryFilter",
type: "selectComponent",
parameter: "countryDashParam",
valueAsId: false,
parameters:[['marketQueryParam', 'territoryDashParam']],
listeners: ['territoryDashParam'],
queryDefinition: {
path: dashPath+"/customers.cda",
dataAccessId: "countries"
},
htmlObject: "countrySelector",
executeAtStart: true,
priority: 5
}));
dashboard.addComponent(new TableComponent({
name: "top50Customers",
type: "tableComponent",
parameters:[['marketQueryParam', 'countryDashParam']],
listeners: ['countryDashParam'],
chartDefinition: {
path: dashPath+"/customers.cda",
dataAccessId: "top50Customers"
},
htmlObject: "table",
executeAtStart: true,
priority: 5
}));
dashboard.init();
return dashboard;
}
);
</script>
When selecting a new country, changes will happen in the tables. To make it possible, we should define two parameters in the dashboards. One parameter for the territories that the country selector will be listening. Another parameter for the countries, which the table will be listening to. A very important note is that the territory component will store the selection in the territory parameter and the country selector in the country parameters.
Just by using two parameters and setting some properties such as a parameter, listeners, parameters, and queries, we can have an interactive dashboard. Wait until you get to know how to create interaction from table and charts components, you will learn how to create much more interactive dashboards. We will cover this in Chapter 6, Tables, Templates, Exports, and Text Components.
Using preExecution and postExecution
The preExecution and postExecution functions are very similar concerning their usage, but different in their purposes.
The first one, preExecution, you can see as preparing the execution of the component. One really good example is to point to another data source, or even to a different CDA file. Let's suppose you have multiple queries that are used in multiple dashboards, and you want to have a simple file where all the common queries are placed. This is possible to change with just a couple of lines of code in the PreExecution function.
Another good example is when you want to have cascading parameters. Let's suppose you want to have a selector where you can choose between the market level (country or city), and the second filter will show you countries or cities depending on what you have selected for the first one. The first will drive the query for your second filter, and so the values to select will vary between country or city. The following code will help you understand how we can make cascading parameters work using the pre- and post- execution functions:
require(['cdf/Dashboard.Bootstrap', 'cdf/components/TableComponent', 'cdf/components/SelectComponent', "cdf/Logger", "cdf/lib/jquery"],
function(Dashboard, TableComponent, SelectComponent, Logger, $) {
dashboard = new Dashboard();
dashboard.addParameter('marketLevelDashParam', 'territories');
dashboard.addParameter('marketDashParam', '[Markets].[All Markets]');
var path = dashboard.context.path;
var dashPath = path.substring(0,path.lastIndexOf('/'));
dashboard.addComponent(new SelectComponent({
name: "marketLevelFilter",
type: "selectComponent",
parameter: "marketLevelDashParam",
valueAsId: false,
valuesArray: [["territories","Territory"],["countries","Country"],["cities","City"]],
htmlObject: "marketLevelSelector",
executeAtStart: true,
priority: 5,
postExecution: function(){
$('#marketLevelSelectorLabel').text('Select market level:');
},
}));
dashboard.addComponent(new SelectComponent({
name: "marketFilter",
type: "selectComponent",
parameter: "marketDashParam",
valueAsId: false,
parameters:[],
listeners: ["marketLevelDashParam"],
queryDefinition: {
path: dashPath+"/customers-selection-change.cda"
},
htmlObject: "marketSelector",
executeAtStart: true,
priority: 5,
preExecution: function(){
var level = dashboard.getParameterValue("marketLevelDashParam");
this.queryDefinition.dataAccessId = level;
},
postExecution: function(){
var level = dashboard.getParameterValue("marketLevelDashParam");
$('#marketSelectorLabel').text('Select from '+level+':');
}
}));
dashboard.addComponent(new TableComponent({
name: "top50Customers",
type: "tableComponent",
parameters:[["marketQueryParam", 'marketDashParam']],
listeners: ['marketDashParam'],
chartDefinition: {
path: dashPath+"/customers-selection-change.cda",
dataAccessId: "top50Customers"
},
htmlObject: "table",
executeAtStart: true,
priority: 5
}));
dashboard.init();
return dashboard;
}
);
The trick here is to have two parameters: marketLevelDashParam and marketDashParam. The first one is used to store countries or cities, depending on the user's selection in the first selector. The second will be used to store what country or city the final user selects, so that we can then use it in the parameters of the table in order to be sent as part of the query and to get only the customers for that particular selection. The first selector does not have any tricks, just a postExecution function, similar to the one in the second selector, which we will explain next.
The real magic is in the listeners and preExecution of the second selector. This selector will be listening for changes in marketLevelDashParam and will use the value of the parameter to know which query to use and run. The query that will be executed will be a new query based on the value for the level, where the level is the value that was selected.
On this line, and in all other functions inside components, this refers to the component itself, followed by changing dataAccessId in the queryDefinition object. You saw in previous examples that we can use this to define which CDA file and which data access ID the component should use to get the data.
Similar to this case, you can also change the path and point to another CDA file. To get the stored value(s) in a dashboard parameter, we can use the following line of code:
var level=dashboard.getParameterValue("marketLevelDashParam")
This way, we are pointing to a query countries or cities that are defined on the CDA file.
In front of each selector, you can see a label. The postExecution function is being used to change the label for the selector. Take a look at the post execution function of the second selector and you will see that we are grabbing the value of the parameter that identifies the level of the filter, and this value will be used as part of the label.
The code $('#marketSelectorLabel').text('Select from '+level+':') is used to change the text inside the label before the selector. This could be done, and would be even better, in the pre execution function, but you would not see how to use post execution. Usually, post execution is used to manipulate the HTML generated during the rendering of the component, and this is only available in post execution. A good example is applying a jQuery plugin, which we will cover in the CDE chapters. Another example is to attach an event to some elements that the component made available on the page. There are a lot of use cases, and we just don't have the space to cover them all.
Just keep in mind that you should use preExecution to execute code to prepare the execution of the component, and postExecution to execute code to manipulate the DOM that the component has created in the dashboard.
In our example, just add a new option (Territory) to the values array of the first selector. Set the values array as:
valuesArray: [
["territories","Territory"],
["countries","Country"],
["cities","City"]]
If you now execute the sample code of your dashboard, you will automatically be able to choose the customers, with the option to select all of those who are in a particular territory level.
Understanding how to work with postFetch
In the Steel Wheels sample data, which we have been using in our examples and is available with the standard installation of Pentaho, we have one territory showing in the selector as having a #null value. This description is not friendly to the end user, so we may make a change, thereby manipulating the result set that we get from the execution of the query. With this, we can change the description of #null to something like NA.
The following code is for the territory selector component, where we just added a function to define the code to be executed on the postFetch function:
dashboard.addComponent(new SelectComponent({
name: "territoryFilter",
type: "selectComponent",
parameter: "territoryDashParam",
valueAsId: false,
queryDefinition: {
path: dashPath+"/customers.cda",
dataAccessId: "territories"
},
htmlObject: "territorySelector",
executeAtStart: true,
priority: 5,
postFetch: function(data) {
// manipulate result from query
for (var i=0; i<data.resultset.length; i++) {
if (data.resultset[i][1]=="#null")
data.resultset[i][1]="NA";
}
return data;
}
}));
You can see the postFetch function being defined and passing the result of the execution of the query as an argument. This result can be manipulated by changing the values inside the data variable.
First let's just quickly review something we covered in the last chapter. When creating a query through CDA, the results are by default returned in a JSON format, something like:
{
"metadata":[
{"colIndex":0,"colType":"String","colName":"UID"},
{"colIndex":1,"colType":"String","colName":"Markets"}
],
"resultset":[
["[Markets].[All Markets]","All Markets"],
["[Markets].[#null]","#null"],
["[Markets].[APAC]","APAC"],
["[Markets].[EMEA]","EMEA"],
["[Markets].[Japan]","Japan"],
["[Markets].[NA]","NA"]
],
"queryInfo":{"totalRows":"6"},
}
The result is a JSON object composed of:
· metadata: This is an array of objects where the metadata is described. Each column will be an element of the array, so we will have as many elements on the array as columns returned from the query. For each element of the array, you will get an object with:
· colIndex: The index of the column
· colType: The data type contained in the columns
· colName: The name of the column
· resultset: Here you will get the result of the execution of the query. The result set is a multidimensional array. Each element of the array will contain the result of a row and each row will be an array with as many elements as columns. In our example, we will have an array of six rows and two columns.
· queryInfo: This is an object with a unique element, totalRows, which contains the number of rows in the result set.
You now understand the JSON returned from the execution of the CDA queries, so let's return to our example on how to manipulate the result set. Don't forget that this is the default format, but when using the CDA Web API, you can change the format type of the result, as already covered in the last chapter.
So in the sample code, you can see that we are using a for loop to iterate over all the rows contained in data.resultSet, and use the if condition to check whether the second column, the one with the description, will be shown in the selector. If we have a #nullvalue, we will just change the value to be NA in the same position with in the array. Note that we are just changing the description and not the ID, because the ID will be used to filter the results for the country selector.
A very important step is to return the object that you need to be used in your component. In our sample, we are just returning the same object that with a changed value. That same value will be used by the component when being rendered.
It's also important for you to know that you can use postFetch not only to manipulate data, but also to manipulate parameters, or another component on the dashboard, or even manipulate elements on the DOM. Let's suppose that you want to change some behavior or settings on the component based on the result of the execution of the query. An example would be changing the column type, headers, and format based on the results, and the number of columns based on the result set. This kind of operation is what will make all the difference when developing the dashboard, but will also produce outstanding results. Here again, imagination is the only limit.
Using preChange and postChange
Now it's time to cover preChange and postChange. These two functions will only be available in components whose main purpose is to be used as filters. Examples of this are select, input, date range, radio button, button, multi button, and so on.
Every component where we can set a parameter to store the selections and the lifecycle of the component will trigger fireChange to that parameter. We have the option to specify the function that will be executed both before this happens and after applying the changes to the parameter, preChange and postChange. Take a look at following image:
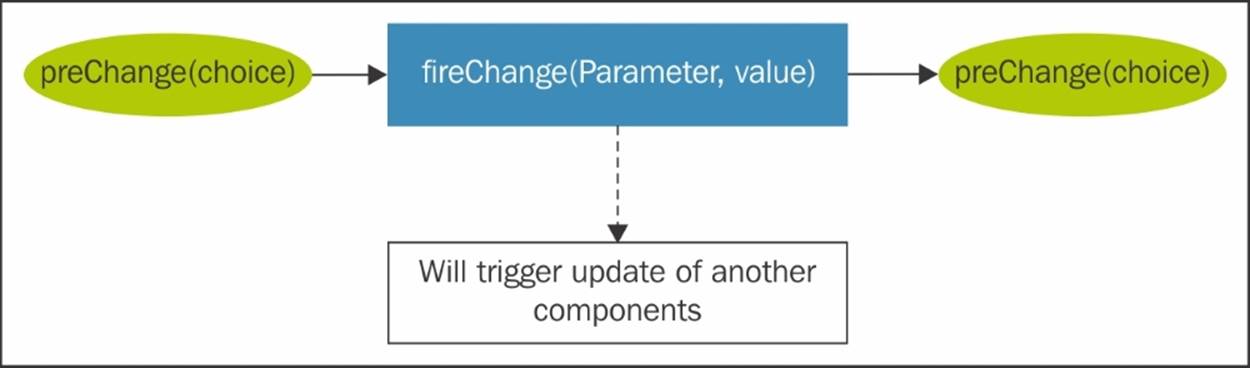
As you can figure out, that the first function, the preChange function, can be used to execute the code that can validate the options and take some actions before changing the parameter value. Can be used to prepare something before other components starts to execute because they are listening to that same parameter. The other postExecution function, can be used to perform operations that need to be extended just after the changes on the parameter are confirmed.
In the next sample code, the options that we have in our selector are different to the name of the query, so we can make use of preChange to control what the value to use on fireChange will be. To achieve this, we just need to return the value that we need for the fireChange function, and this value will then be passed to the postChange function:
dashboard.addComponent(new SelectComponent({
name: "marketLevelFilter",
type: "selectComponent",
parameter: "marketLevelDashParam",
valueAsId: false,
valuesArray: [["1","Territory"],["2","Country"],["3","City"]],
htmlObject: "marketLevelSelector",
executeAtStart: true,
priority: 5,
postExecution: function(){
$('#marketLevelSelectorLabel').text('Select market level:');
},
preChange: function(choice) {
var selection = "";
switch (choice) {
case "2": selection = "countries";
break;
case "3": selection = "cities";
break;
default: selection = "territories";
}
return selection;
},
postChange: function(choice) {
Logger.log("You choose the value: "+choice+" for parameter "+this.parameter);
}
}));
A very common use case for preChange is to apply validations and return an appropriate value or propagate changes to more parameters that are dependent on the selections made by the user, per instance, in a drop-down. Common use cases for postChangeis to take some actions after the parameter changes have started to be propagated to the other components, to display some information about the selection made by the user in another element of the dashboard, or just to execute some custom code.
Priority of component execution
The order of the execution of the components will depend on another property for each component. The priority property should be set using integer values. Lower values as higher priorities. The default value of the property is 5. The components with the same priority are executed at almost the same time and they are executed in an arbitrary order, but during the same routine. If a different and higher priority is set for a component, it will only be executed after the ones with a lower priority are executed. Each similar priority will correspond to a cycle, where it will start with the execution of the components, and will end after the last component that has the same priority finishes.
Inside a dashboard, to change the order of execution of the components, you just need to change the priority property and set another value.
Let's look at the following example where we have five components:
· Components 1 and 2: priority 5
· Components 3: priority 10
· Components 4 and 5: priority 15
In the following image the X-axis is the time and the Y-axis is the priority:
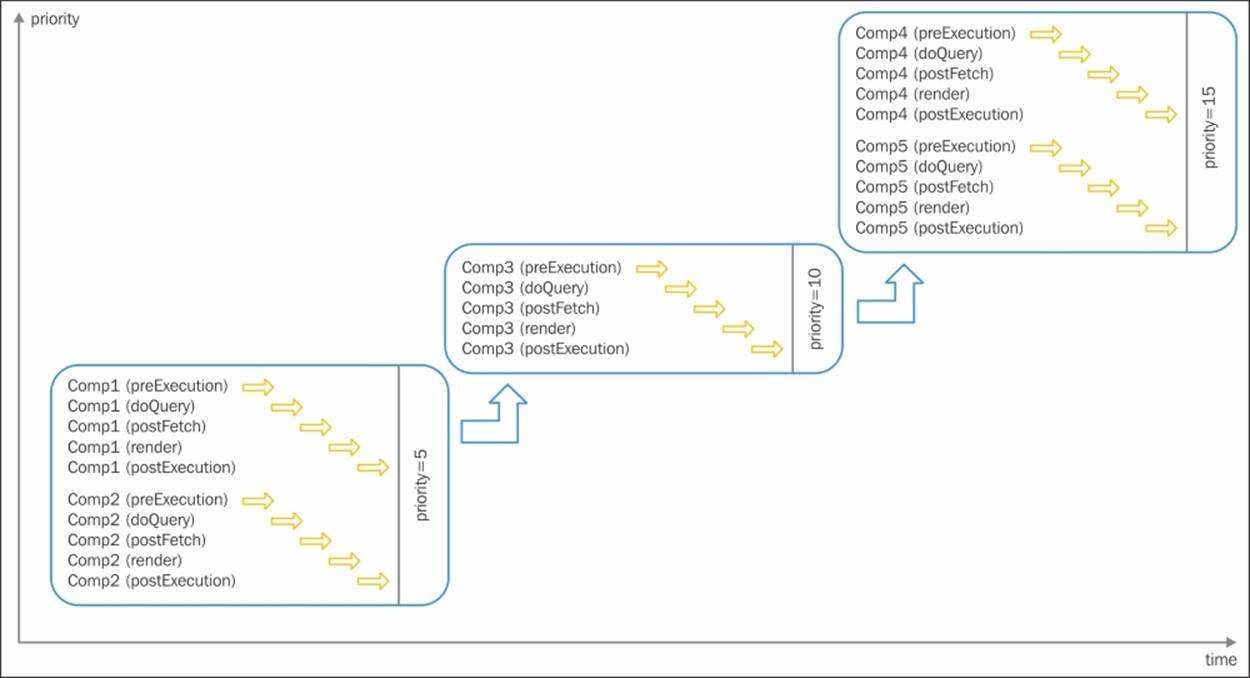
In the preceding image we can look at the components with the same priority as being in the same group, and because the execution of components in the same group will be asynchronous, they will be executed at the same time, and only when all the components of that group have finished will the components with the nearest priority up be executed.
So, in the preceding image, you can see that components 1 and 2 start the execution at the same time, and only after they're finished will the execution of component 3 start. The order of execution for components of the same priority is arbitrary, and you should not expect any sequence that you can guess. Also, components 4 and 5, which have the highest priority, will start the execution only after the component with priority 10 has finished executing.
Available components and properties
When defining new components, you need to define a set of properties that define the object and/or the behavior. The generic and mandatory properties of all/almost all the components are:
· type: This property assumes a variety of values such as tableComponent, buttonComponent, selectComponent, and so on, depending on the component that is used.
· name: This is the unique identifier of the component inside the dashboard.
· listeners: Will accept an array of a strings with the name of the parameters. If a value on each one of those parameters changes, the component will be updated. This array is crucial to create interaction among components.
· parameters: This accepts an array of arrays, where each array will have the name of the parameters of the query and the parameters of the dashboard with the value to be used.
· parameter: For components where user input is required, this is where the input is stored to be used later.
· htmlObject: This is the ID of the HTML object that will be replaced by the component's content result and be reached by calling a method from inside the component using this.placeholder().
· priority: This is the priority of the component's execution, defaulting to 5. The lowest priorities have the highest priority of execution. Components with the same priority will be executed simultaneously.
· executeAtStart: If set to false, the component will not execute at the start of the dashboard, but it can be updated as soon as one of its listeners has changed.
Some other properties have already been covered, such as preChange/postChange or preExec/postExec, and we will cover others in the remaining chapters.
There are a lot of components available in CDF, and more in CDE. When you install the CTools, you also get some samples that you can find under /public/plugin-samples/CDF/Require samples/Documentation/Components Reference. These samples are very useful for getting knowledge about each of the available components and how they work. For each component, you will find a CDF dashboard that will provide you with a description of the component, the available methods, and the options. Also available is sample code and a previewer of the components, where you can also understand how to use the component inside a dashboard.
If you know how the lifecycle works and how you can define and use a component, you are now able to create a dashboard on your own.
It would not make sense to waste a bunch of pages just providing almost the same information as you have seen in the previous examples, but you don't yet have a summary where you can see which properties are available for which components. We will show you how to work with the most important components in the next chapter, where we will cover a great deal of the available properties.
Adding resources – JavaScript and CSS
You already saw how to create a new dashboard, and add components, but you haven't yet seen how to include JavaScript and CSS code, which is available in CDF. I always like to add my JavaScript files with the code for the project/dashboard. Regardless of whether we are creating a dashboard or multiple dashboards in a project, we should always develop it while bearing in mind that we may need to have multiple dashboards, and some of the code and style could be reused for these multiple dashboards.
If you are building dashboards that are similar to each other, you should rethink the way you are creating or designing your dashboards. A dashboard can be flexible in a way that will let you change the behavior and the data to be displayed in an easy way, without too many components and or too much logic.
Let's suppose we are creating four dashboards and all the dashboards will share the style, but also will have different components. Some of the components will share some properties, but will have some specific properties for their case. What we can do is have some files that contain JavaScript code and CSS rules that are applied to all the dashboards, and some other files that can be applied for a specific dashboard. The files that are specific to a particular dashboard will just extend or overwrite the existing code.
JavaScript code is easy to extend and overwrite, and when using CSS you should write rules, or just load the files in a different order to define which rules are extending or overwriting the remaining ones.
Using internal modules
The way to add JavaScript code in a file to a dashboard is by including a module when creating the dashboard. RequireJS provides a way to do this, you just need to follow the rules and be able to use modules that are already defined, or just point to a file by its relative path. There are a lot of modules in CDF that you can use, and if not you can include your own.
The modules that are available by default in CDF are the following:
|
cdf/Dashboard.Clean |
cdf/Dashboard.Bootstrap |
cdf/Dashboard.Blueprint |
cdf/Logger |
|
cdf/Addin |
cfd/dashboard/Utils |
cfd/dashboard/RefreshEngine |
cdf/lib/modernizr |
|
cdf/lib/jquery |
amd!cdf/lib/jquery.ui |
cdf/lib/jquery.blockUI |
cdf/lib/jquery.impromptu |
|
cdf/lib/jquery.fancybox |
cdf/lib/mustache |
cdf/lib/datatables |
cdf/lib/jquery.ui.autobox |
|
cdf/lib/jquery.templating |
cdf/lib/bootstrap |
cdf/lib/jquery.bgiframe |
cdf/lib/jquery.jdMenu |
|
cdf/lib/cdf.jquery.i18n |
cdf/lib/OpenLayers |
cdf/lib/queryParser |
cdf/lib/jquery.corner |
|
cdf/lib/jquery.select2 |
cdf/lib/jquery.chosen |
cdf/lib/jquery.multiselect |
cdf/lib/Raphael |
|
cdf/lib/base64 |
cdf/lib/moment |
amd!cdf/lib/ underscore |
amd!cdf/lib/ jquery.ui.autobox |
|
amd!cdf/lib/ backbone |
amd!cdf/lib/ daterangepicker.jQuery |
The way to add a resource is just to use the module ID, in the require instruction, like in the following example:
require(['cdf/Dashboard.Clean',
'cfd/dashboard/Utils',
'cdf/Logger'],
function(Dashboard, Utils, Logger) {
dashboard = new Dashboard();
Looger.log(Utils.numberFormat(0.2, '0.00%'));
dashboard.init();
}
);
We included three modules in the previous example. The first one for the dashboard type will include the dashboard's core functionality, the second one will include the utilities functions, in our case to format a number as a percentage, and the last one to make it possible to send log messages to the console. You can also see in the dashboard's code that we are just sending a log message to the console with a number formatted as a percentage with two decimal places.
Defining and including new modules
We may also want to include our own code so that we can also create a module of our own by using the define function of require.
The syntax is as follows: define([[id,] dependencies,] factory). First, two arguments, ID and dependencies, are optional and consist of an ID for the module and the dependencies for your module. You can avoid defining the ID, and if that's the case, the file name and path will be used as ID for the module. Third, factory is a function that is executed to instantiate a module. If the dependencies argument is not specified, this means that the module has no dependencies. You can get more detailed information from the RequireJS website (http://requirejs.org/docs/api.html). The following code is an example of how to define a module to be used in a dashboard:
define(function() {
var myModule = {
sayHello: function(user) {return 'Hello '+user+'!'}
};
return myModule;
}
);
The module is defined in a JavaScript file with the name myModule in the same folder as the dashboard.
Next, you can see how we can include a custom module in a dashboard and make it possible to use the unique function sayHello. The module function is called inside the expression function of the component:
require(['cdf/Dashboard.Bootstrap', 'cdf/components/TextComponent', 'myModule', 'css!myDashboardStyle'],
function(Dashboard, TextComponent, myModule) {
dashboard = new Dashboard();
dashboard.addComponent(new TextComponent({
name: "showText",
type: "textComponent",
parameters:[],
listeners: ["inputParam"],
htmlObject: "showMessage",
executeAtStart: true,
priority: 5,
expression: function(){
return myModule.sayHello(dashboard.context.user || 'world');
}
}));
dashboard.init();
return dashboard;
});
Including CSS files
But that's not all, because when defining a dashboard, we definitely want to make it unique and outstanding, and we also want to include CSS in our dashboard. The way to do this is very similar to what we saw earlier with the modules, but we need to prepend the path/file name with css!. This will load the CSS file when the dashboard is also being loaded, and all the styling will be applied as intended.
If we have a file called myDashboardStyle.css on the same level as the dashboard HTML file, then we should have the file included as css!myDashboardStyle, which was also included in the last example.
Dashboards utilities
There was once a time when we needed to add libraries as external resources to leverage the process of formatting dates and numbers. Nowadays, it is possible to do the formatting without the need to include external files. We can do the formatting just by including the cfd/dashboard/Utils module. This will make require load all the dependencies without any more effort.
Formatting numbers
Numbers can be formatted to look like currency, percentages with decimal places, thousands, and abbreviations. To format numbers, you should use the function numberFormat, available in the dashboard object. In our examples, you could do this by callingUtils.numberFormat(value[, format[, langCode]]). The function accepts the arguments; the first one is the value to format, the second one is the format mask, and the last is the language and locale to use when formatting the number.
The mask or format argument is a string made up of symbols that shows how to format the number. The most commonly used symbols are listed in the next table. There is always the need to enclose the format in quotes or double quote marks. The number formatting is based on cdo.NumberFormat, code that is built in CCC and Protovis. CCC, which was covered in the first chapter, is the chart library that brings a lot of flexibility to represent data using charts/graphs, while Protovis is the JavaScript library that CCC uses:
|
Symbol |
Description |
|
0 |
This is the digit placeholder, which prints a trailing or a leading zero in this position, if appropriate |
|
# |
This is a digit placeholder, which will never print trailing or leading zeros |
|
. |
This is a decimal placeholder |
|
, |
This is a thousands separator |
|
–, +, $, (), space |
This is a literal character, that is, a character that is displayed exactly as typed into the format string |
We also have the ability to use several standard formats with the format function. Instead of specifying symbols in the format argument, you will denote these formats by using a name in the format argument of the format function. These names should be enclosed inside the quotes that define the format mask:
|
Symbol |
Description |
|
Currency, or C |
This displays a number with thousands separators, if appropriate. It displays two digits to the right of the decimal separator. The output is based on settings and/or language and locale specified. |
|
Abbreviation, or A |
This will abbreviate the number, if appropriate, and include a symbol that indicates the number of zeros that the user should consider when evaluating the number. You can also specify abbreviations by using only the letter A. |
Let's look at some examples on how to use the masks to format numbers with the numberFormat function (first you can see the number being formatted, in the middle you can see the format mask being applied, and on the right side you can see the result):
Numbers
|
Number |
Format mask |
Resulting string |
|
1250 |
0.## |
1250 |
|
1250 |
0.00 |
1250.00 |
|
1250 |
00000.0 |
01250.0 |
|
1250 |
#####.00 |
1250.00 |
|
1250.45 |
#.0 |
1250.5 |
|
1250.45 |
#,#.00 |
1,250.45 |
|
1250.45 |
#,#.000 |
1,250.450 |
|
12349867450.45 |
#,#.0 |
12,349,867,450.5 |
Currency
|
Number |
Format mask |
Resulting string |
|
1250 |
#,#.0 € |
1,250.0 € |
|
1250 |
#,#.0€ |
1,250.0€ |
|
1250 |
$1,250.0 € |
$1,250.0 |
|
1250 |
#,#.0Currency |
1,250.0$ |
|
1250 |
C#,#.0 |
$1,250.0 |
|
1250 |
#,#.0\u00a4 |
1,250.0$ |
Abbreviation
|
Number |
Format mask |
Resulting string |
|
12568 |
'0.00 Abbreviation' |
12.6k |
|
12568 |
'0.00 A' |
12.6k |
|
1250 |
0.000A |
1.250k |
|
1250 |
0.###A |
1.25k |
|
1250000 |
0.#A |
1.3m |
|
1250000 |
0.##A |
1.25m |
|
125873987343 |
0.##A |
125.87b |
Percentages
|
Number |
Format mask |
Resulting string |
|
0.2 |
0.00% |
20.00% |
|
0.96 |
0.00% |
96.00% |
|
0.9636 |
0.0% |
96.4% |
There are ways to change the general settings and the language/locale settings, so let's cover that now.
Languages and locales
For the third argument, you should set the language-locale to use so that the format knows what the default masks are and/or the currency symbol to use. When using currency and defining the language and locale, you should not specify the symbol to use, and just use C, letting the formatter apply the defined settings:
|
Number |
Format mask |
Language |
Resulting string |
|
323636 |
0.0C |
pt-pt |
323636.0€ |
|
323636 |
C0.0 |
en-us |
$323636.0 |
|
323636 |
C0.0 |
en-gb |
£323636.0 |
Multiple formats
You also may want to specify format masks for positive and negative numbers, and you are able to do so just by separating the formats with semicolons. It should be used by specifying [positive_mask];[negative_mask];[zero_mask];[null_mask]:
|
Number |
Format mask |
Resulting string |
|
-323636 |
$#,##0;($#,##0) |
($323,636) |
|
0 |
$#,##0;($#,##0);zero |
zero |
|
null |
$#,##0;($#,##0);zero |
|
|
null |
$#,##0;($#,##0);zero;nil |
nil |
Formatting and manipulating dates
We can also use a function to format dates and time. When using the CDF Utils to format the date and time, in reality we are making use of MomentJS, a JavaScript library that is automatically included when using the CDF Utils module in our dashboard. We can format dates by using the dateFormat function, and similar to what you saw earlier, you should use the following function: Utils.dateFormat(date[, format[, langCode]]). The first argument is the date, which can be a string or a moment call with the input format of the specified date:
dashboards.dateFormat('2014-12-20', 'DD/MM/YY')
dashboards.dateFormat(moment('20/12/2014','DD/MM/YYYY'), 'DD/MM/YY')
The previous examples will return the same result, but are specifying the input date in different formats. The second example would not recognize '20/12/2014' as a valid date, so we need to use MomentJS to specify the input format as 'DD/MM/YYYY'.
The first argument of the function is the date to format, where you can specify a string or a MomentJS object. It's good practice to do it as in the second example, due to compatibility reasons when rendering the dashboard in different browsers.
The second argument of the function is the format mask to be used by the formatter, and it's based on the format masks provided by MomentJS. You can get more information at: http://momentjs.com/docs/#/displaying/format/.
It's not the purpose of this book to explain how to work with MomentJS, you just need to know that is a really great library that also allows you to manipulate dates. It's very easy and intuitive to use, and you will find detailed documentation, with a lot of examples, on their website at http://momentjs.com/docs/. Usually, dates are very important in all projects, so we really advise you to get to know how to work with this library.
When using a date like new Date() on the date argument of the function, we could end up getting the following results:
|
Date |
Format mask |
Resulting string |
|
new Date() |
dddd, MMMM Do YYYY, h:mm:ss a |
Friday, May 29th 2015, 9:27:37 am |
|
moment('20/12/2014','DD/MM/YYYY') |
DD-MMM-YY, hh:mm |
20-Dec-14, 12:00 |
|
moment() |
DD/MM/YYYY |
29/05/2015 |
|
moment() |
ddd, hA |
Fri, 9PM |
Internationalization of numbers and dates
When talking about the internationalization of numbers and dates, there is a function that you can use to add or change the settings. The function to use is Utils.configLanguage(langCode, config), which will receive two arguments, one of which is the language/locale code and another is the settings object. The language code is just a string with an identifier and the configuration is an object that can contain one or both keys with the settings to format numbers and dates. The keys are:
· number: This configures the number's format language
· dateLocale: This configures the date's format language
In the following example, we can see the usage for both options, and both options will expect an object with the settings to use:
Utils.configLanguage('myLangCode', {
number: {
mask: '#,0.##',
style: {
integerPad: '0',
fractionPad: '0',
decimal: ',',
group: ' ',
groupSizes: [3],
abbreviations: ['k','m', 'b', 't'],
negativeSign: '-',
currency: 'F'
}
},
dateLocale: {
months: [
"January", "February", "March", "April", "May", "June",
"July", "August", "September", "October", "November", "December"
],
monthsShort: [
"Jan", "Feb", "Mar", "Apr", "May", "Jun",
"Jul", "Aug", "Sep", "Oct", "Nov", "Dec"
],
}
})
After these settings are defined, we may use them using langCode defined. In our example, we have set our own language code as myLangCode in the following function:
· Utils.numberFormat(value[, format[, langCode]])
· Utils.dateFormat(value[, format[, langCode]])
The last argument of each function is the language code, and if we apply myLangCode string in there, we will be using the setting we have set for this specific language as:
Utils.numberFormat(254179)
The function will return the number formatted with the default format mask '#,0.##' and return the number formatted accordingly.
In the example, you can see that we are setting definitions for number and dateLocale, but you define just one of them. It's not mandatory to define both.
For the dateLocale settings, there are more options that we could customize, so you can find the complete reference at http://momentjs.com/docs/#/customization/.
Dashboard storage
It's now possible to maintain parameter states between different sessions. Instead of using simple parameters, objects inside the special namespace storage can be saved and restored.
Dashboards can store values as per the user preferences. Let's suppose you have a dashboard where you want to persist the status next time you get on the dashboard. It's possible to do this with the storage functionality of CDF. Each time that the functiondashboard.saveStorage() is called, CDF will store the content of the dashboard.storage object. When the dashboard is loaded for that user, the dashboard will have access to the object dashboard.storage where all the collections (objects and arrays) or functions are defined.
Tip
Don't forget to save the storage:
Storage will only be saved on the server side after running the dashboard.saveStorage()function; otherwise if you refresh the dashboard before saving it, you will notice that you have lost the last changes before the last save.
You can also force the load of the storage, by calling dashboard.loadStorage() function, or if you want to clean the storage, you just need to run dashboard.cleanStorage(). You can also just clean part of the storage by deleting it:
require(['cdf/Dashboard.Bootstrap', 'cdf/components/TextInputComponent', 'cdf/components/TextComponent', "cdf/Logger"],
function(Dashboard, TextInputComponent, TextComponent, Logger) {
dashboard = new Dashboard();
dashboard.addParameter('inputParam', dashboard.storage.inputParam || "");
dashboard.addComponent(new TextInputComponent({
name: "inputTextComponent",
type: "textInputComponent",
parameters:[],
parameter: "inputParam",
htmlObject: "inputComponent",
executeAtStart: true,
priority: 5,
postChange: function() {
dashboard.storage.inputParam = dashboard.getParameterValue(this.parameter);
dashboard.saveStorage();
}
}));
dashboard.addComponent(new TextComponent({
name: "showTextComponent",
type: "textComponent",
parameters:[],
listeners: ["inputParam"],
htmlObject: "textComponent",
executeAtStart: true,
priority: 5,
expression: function(){
return dashboard.getParameterValue('inputParam');
}
}));
dashboard.init();
return dashboard;
});
The previous example shows that we can make use of storage in CDF. In the dashboard, we have two components and one parameter. The parameter created has, as a default value, dashboard.storage.inputParam || "", meaning that it will grab the value from a previously saved parameter in the storage object. If it is not defined, it will return an empty string, which is the case when executing the dashboard for a user for the first time.
Tip
Take caution when storing a huge amount of information in the storage
This works on a per user basis, and the developer needs to be aware that everything saved will be loaded for every dashboard for that same user, so if too much is stored, one may have a performance penalty.
The first defined component is an input component that will let you enter text in the input box, and, once the value is confirmed, it will write the value for the parameter. But, at that time, only the parameter has the value entered, so we also need to write value to the storage object and save it.
That is what we can see in the postChange function, where we are just writing a variable inside the context with the value to store. Once we have created or overwritten the variable value, we need to save it with the instruction dashboard.saveStorage(). We could also have another component, such as a button component that would clean the storage by executing the instruction dashboard.cleanStorage(). You should try it.
Tip
Loading the storage object
If for some reason you need to update the value of the storage object, you can do this by calling dashboard.loadStorage(), but only if that's the case. You don't need to do this at the beginning of the dashboard because the storage object will be automatically filled out when the dashboard starts.
Dashboard context
When the dashboard loads, there is also an object that will be available to get some information about the context where the dashboard is running. This object can be accessed using the variable that is instantiating the dashboard. Let's check the content of the object:
· user: This is the ID of the user that is logged in
· roles: This is an array of strings that contains the roles associated with the user
· serverLocalDate: This is the timestamp of the server
· serverUTCDate: This is the UTC timestamp on the server
· sessionTimeout: This is the time timeout interval for the session
· path: This is the dashboard path in the Pentaho repository
· locale: This is the language and locale that is set on the Pentaho server for the logged in user
Sometimes there is the need to add some more information when generating the dashboard, so CDF gives you the capability to add that information, and you are able to do this in two ways: using values from session variables directly in Pentaho, or using values from queries. Session variables are variables that can store values in the user session in Pentaho. There are two steps in Kettle that can be used to get/set session variable values. For more information, please refer to:http://wiki.pentaho.com/display/EAI/Get+Session+Variables and http://wiki.pentaho.com/display/EAI/Set+Session+Variables.
The configuration should be set using a solution file cdf/dashboardContext.xml, and you can take a peek at the default configuration file that is available in the /system/pentaho-cdf/dashboardContext.xml file.
To include the session variable key/value pair in the context of the dashboard, you should change the configuration file to include the settings, so that CDF knows what variables should be included. You should add the <sessionattributes> element, which contains as many <attribute> elements as variables we want to include. This should be placed inside the <context> root element. Let's suppose you have a session variable with the name myTerritory, where you have some information about the territory of the user that is logged in. You will end up with a file like this:
<context>
<!-- Query auto-includes -->
<autoincludes>
<autoinclude>
<cda><![CDATA[/public/cdf/includes/(.*)/(.*?)\.cda]]></cda>
<ids>.*</ids>
<dashboards>
<include><![CDATA[.*/$1/.*\.wcdf]]></include>
<include><![CDATA[.*/$1/.*\.xcdf]]></include>
<include><![CDATA[.*/$1/.*\.cdfde]]></include>
</dashboards>
</autoinclude>
</autoincludes>
<sessionattributes>
<attribute name="myTerritory">myTerritory</attribute>
</sessionattributes>
</context>
You can see that the file is pretty similar to the default one, and the only difference is that we are including the sessionatrributes elements to include the value of the session variable myTerritory in the dashboard context.
Tip
Including multiple session variables
If you have more than one variable you want to include, you just need to add as many attribute elements as the variables you need.
As previously mentioned, we can also include some values resulting from queries; as we can understand by its name, autoincludes provides you that ability. At the beginning of the configuration file of the last sample code, we can see the autoincludeselements that contain the rules to define which files will be included or excluded.
You can imagine how you could achieve the same results by adding queries and changing the priority of execution of the components so that you have some results loaded before any other query is triggered. But you would need to add this logic to the dashboard by yourself, and it is even more time expensive when you need those results to be included on multiple dashboards. So the autoincludes can save you some time and avoid unnecessary logic and complexity.
Looking at the previous example, you will see the include/exclude elements where we need to set the regular expressions rules to include or exclude dashboard files that will have the auto-includes in the context. The CDA XML element is where the pattern is defined for the CDA files with the queries, whose results will be included in the context of the dashboard. You can also specify the pattern for the data access ID of the CDA files to be included.
The way this works is by placing the CDA files with the queries and default parameters inside the public/cdf/inludes hierarchy folder, and every dashboard with the same relative path to the root folder will include the results in the context. Let's suppose you have a CDA file inside public/cdf/includes/public/myfolder and a dashboard inside public/myfolder. The dashboard's results of the queries will be included in the context of the dashboard. On the other hand, if you have a dashboard that is underpublic/myotherfolder, it will not include the results in the context. This is done using the default configuration, but you can change the default behavior. By changing, adding, or removing rules you will be including or excluding files.
The syntax would be set like:
<autoinclude>
<cda>cda_pattern</cda>
<ids>id_pattern</ids>
<dashboards>
<include>includePattern_1</include>
<include>includePattern_2</include>
<exclude>excludePattern_1</include>
...
<include>includePattern_n</include>
<exclude>excludePattern_n</include>
</dashboards>
</autoinclude>
In the preceding block of code, CDF will include all the results of the data access identifiers in the context object, from the CDA files whose IDs match id_ pattern and the path of the file matches cda_pattern, if all include rules are true and the exclude rules are false. This leads us to the dashboards element, where we may have any number of include and exclude elements.
These elements should be ordered by importance, from the least to the most important, and we can also include back references to capture groups from the CDA pattern. In the default configuration, we can see /$1/, which references the path capture group, meaning that the path begins with the previously matched CDA files. The path for the dashboard that is being executed will be checked against the include/exclude patterns in order of importance, and the dashboard will automatically include CDAs queries if it matches at least:
· One include rule
· Unless it matches a subsequent exclude rule
· Unless it matches a further include rule
Getting back to the session variables, you can also achieve the same results by creating a query auto included that uses a Kettle transformation in combination with the BA Server Utils plugin to read the values of the session variables. This way, the values of the session's variable will also be included. The step to use would be getVariable.
To access the results in the dashboard, you just need to access the dashboard context object such as Dashboards.context.sessionAttributes and Dashboards.context.queryData to get access to the session variables or query results, respectively.
Both dashboard storage and context can be used in CDE. To be more precise, all the functionality available in CDF is also available in CDE, but not the other way around.
Useful functions of the CDF API
CDF provides a list of methods/functions that you can and should use when building the dashboards. Next, you will find some of the most used functions.
Functions from the dashboards module:
· init(components): This function is used to start the execution of the dashboard. You have seen this function in our examples. It receives an argument and an array of the components to execute. This function can be called without any argument, but in this context we need to add the components to the dashboard using the addComponents function.
· addComponents(components): This function accepts an array with the components to add to the dashboard.
· addComponent(component): This is the same as the previous function, but will just add one component.
· removeComponent(component): This will remove a component from the list of the components of the dashboard.
· getComponentByName(component): This returns the component with the name specified as an argument.
· update(component): This will update the component. The function receives an argument, that is, the name of the component to update.
· updateAll(components): This updates a set of components. The argument is an array of strings with the name of the components to update.
· isBookmarkable(parameter): This verifies whether a parameter is bookmarkable and returns the Boolean value of the condition.
· setBookmarkable(parameter, value): This sets a parameter as bookmarkable and also sets its default value.
· getQueryParameter(parameter): This gets the value of a parameter that was passed through the URL used to call the dashboard in the browser.
· setParameterValue(parameter, value): This sets the value of a parameter. This is the first argument of the parameter name, and the second argument is the value to set. This function does not notify the listeners.
· fireChange(parameter, value): This is the same as the previous function, but will notify the listeners.
· getParemeterValue(parameter): This returns the value of a parameter.
· preInit(): This can be defined to be executed before the dashboard starts the execution.
· postInit(): This can be defined to be executed after the dashboard finishes the first render of the dashboard.
· saveStorage(): This saves the contents of the object.
· loadStorage(): This reloads the object (this is done automatically at the dashboard rendering time, and is useful only to undo certain operations).
· cleanStorage(): This empties the entire storage of that user.
· storage: This is the object where the storage will be loaded, and where the developer should store the values of the persistent parameters.
· context: This is an object that contains a set of properties that define the context where the dashboard is executed. It has some properties such as the user, roles, path to the dashboard, and more.
· on(event_name, callback, context): This allows the developer to attaching the event to the events fired by the CDF dashboards.
· off(event_name): This allows the developer to remove the event.
· trigger(event_name): This triggers an event.
· objectToPropertiesArray(object): This returns an array from an object of properties and can be used to define some of the properties of a component. This function accepts an argument, that is, the object to be translated to an array.
· propertiesArrayToObject(array): This returns an object from an array. This function has an argument that is an array.
Functions from the logger module:
· log(message, type): This writes a message to the console with one of the following types: log, error, warn, info, or debug.
Functions from the components module:
· update(): This function will update the component, but is called from the update function of the component itself.
· getValue(): The function is then used by the processChange function, getting a value to be used later.
· processChange('component_name'): When creating custom components that require the input of the user, this function should be called to make changes to the parameter and notify the listeners. If it exists, preChange will be called by executing fireChangeusing the defined parameter, and also if defined, postChange will be called for execution.
Summary
CDF is the API to create dashboards and reports. By this point, you should understand the concepts behind the lifecycle of the dashboard and components. You should also know how to create a dashboard using the CDF API, and know the most part of the available methods, which are very important when creating advanced dashboards. We also covered a very important topic related to the use of parameters and listeners to create interaction among components.
Of course, you have a lot more to learn, and there are some more advanced concepts that we will cover in the following chapters.
In the next chapter, we will start covering CDE, and how to build a dashboard in an easier and faster way than by just using CDF.
All materials on the site are licensed Creative Commons Attribution-Sharealike 3.0 Unported CC BY-SA 3.0 & GNU Free Documentation License (GFDL)
If you are the copyright holder of any material contained on our site and intend to remove it, please contact our site administrator for approval.
© 2016-2026 All site design rights belong to S.Y.A.