Relevance Ranking for Vertical Search Engines, FIRST EDITION (2014)
Chapter 6. Entity Ranking
Abstract
Entity ranking is a recent paradigm that refers to retrieving and ranking related objects and entities from different structured sources in various scenarios. Entities typically have associated categories and relationships with other entities. In this chapter, we introduce how to build a Web-scale entity ranking system based on machine learned ranking models. Specifically, the entity ranking system usually takes advantage of structured knowledge bases, entity relationship graphs, and user data to derive useful features in order to facilitate semantic search with entities directly within the learning-to-rank framework. Similar to generic Web search ranking, entity pairwise preference can be leveraged to form the objective function of entity ranking. More than that, this chapter introduces how to incorporate the categorization information and preference of related entities into the objective function for learning. This chapter further discusses how entity ranking is different from regular Web search in terms of presentation bias and the interaction of categories of query entities and result facets.
Keywords
Entity ranking
structured data
object ranking
6.1 An Overview of Entity Ranking
The goal of current Web search engines is to help users retrieve relevant documents on the Web—more precisely, those documents that match the intent of the user’s query. During Web searches, some users are looking for specific information; others may plan to access rich media content (images, videos, etc.) or explore a specific topic. In the latter scenario, users do not have a fixed or predetermined information need but are using the search engine to discover information related to a particular object of interest. Therefore, in this scenario, we say that the user is in a browse mode.
To provide satisfying experience for users in browse mode, a machine learning-based ranking framework can be applied to rank related entities. Such ranking framework orders related entities according to two dimensions: a lateral dimension and a faceted dimension. In the lateral dimension, related entities are of the same nature as the queried entity. For example, if the queried entity is “Hyderabad,” “Bangalore” is a good related entity in the lateral dimension. For another example, if the queried entity is “Angelina Jolie,” “Brad Pitt” is a good related entity in this dimension. In the faceted dimension, related entities are usually not of the same type as the queried entity and refer to a specific aspect of the queried entity (e.g., Hyderabad and India, or Brad Pitt and Fight Club). Entity ranking is a recent paradigm [95,64,358] that focuses on retrieving and ranking related entities from different (structured) sources. Entity ranking can occur in various forms and scenarios as proposed in [267,152]. Entities typically have a canonical name, a main type, alternate names, and several subtypes. They are related to each other through labeled relationships, such as IsLocatedIn, CastsIn, etc. For example, “Bangalore” IsLocatedIn “India,” and “Brad_Pitt” CastsIn “Fight_Club.” This kind of information can be represented as an entity-relationship graph, which shows many similarities to the graphs underlying social networks [180].
The amount of structured data sources such as DBPedia1 and Freebase2 on the Web are increasing [283]. The availability of such large collections of structured data enables a realm of possibilities beyond the basic textual Web search. Popular Web search engines are already providing a rich experience, mining structured data, query logs, and Web documents to provide rich information in the search results (e.g., movie plot, genre, cast, reviews, and show times at the user location) or direct answers to the users’ question-like queries (e.g., “date of birth Brad Pitt”) while displaying related news articles, images, videos, and tweets for queries about popular people, organizations, media works, and locations whenever possible.
To enhance this experience, it is critical to provide well-qualified related entities. A snapshot of the overall enhanced experience appears in Figure 6.1. Related entities, which are points of interest for the query “India” in this example, are shown as suggestions on the left-side rail of the search results page. The types of related entities to show depend on the category of the query entity. For example, for movie queries, the goal is to show both lateral information in terms of related movies and faceted information in terms of cast information. The challenge that we propose to address in this work is to select the appropriate set of related entities, depending on the queried entity and its type, and to rank them in order of relevance.
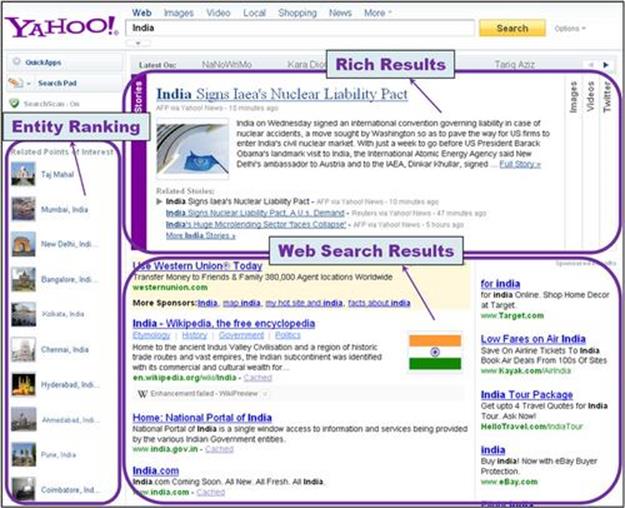
FIGURE 6.1 Screenshot of entity ranking results embedded into the left-side rail of the search results page.
It is natural to cast the problem of entity ranking as a supervised machine learning problem [48,407] with the goal of predicting the relevance of the related entity to the query entity. Although the previous work in this area [354,356,418] focuses on optimizing the clickthrough rate (CTR) of the related entities alone, this chapter presents an approach to jointly learn the relevance among the entities using both the user click data and the editorially assigned relevance grades. In contrast to Web search, the entity search results are grouped by categories of related entities, which complicates the ranking problem. We address how to incorporate the categories of related entities into the loss function and show how to leverage relationships between related entities with different categories (“intercategory” relationships) to improve relevance.
This chapter presents an extensive analysis of Web-scale object ranking, based on machine learned ranking models using ensembles of pairwise preference models. The proposed system for entity ranking uses structured knowledge bases, entity-relationship graphs, and user data to derive useful features to facilitate semantic search with entities directly within the learning-to-rank framework. This chapter also describes a suite of novel features in the context of entity ranking and presents a detailed feature space analysis, followed by further discussions on how entity ranking is different from regular Web search in terms of presentation bias and the interaction of categories of query entities and result facets. Some experiments will be provided based on validation on a large-scale graph containing millions of entities and hundreds of millions of relationships. The results show that the proposed ranking solution clearly improves on the simple user behavior-based ranking model.
The rest of this chapter is organized as follows: Section 6.2 provides background details about the terminology that we use as well as the knowledge base and the Web search experience where entity ranking is used. Section 6.3 introduces the extensive features that we utilize based on both various data sources and the entity-relationship graph itself. Section 6.4 presents details about the pairwise comparison model that produces highly robust pairwise preferences and describes how to incorporate category information in the loss function. Moreover, Section 6.5 reports the experimental results obtained on a large collection of structured knowledge sources. Finally, Section 6.6 concludes this chapter with some insights into future work.
6.2 Background Knowledge
In this section, we describe the terminology that we use throughout the rest of the chapter, give an overview of the system used for building the knowledge base that supports the whole experience, and describe the Web search experience where this entity ranking is utilized.
6.2.1 Terminology
This subsection first introduces the terminology used in this chapter. The application of entity ranking, as presented in this chapter, is to support users in Web search by providing related entity information, which allows them to explore a topic of their interest. Given a user query (q) entered in the search box and a large knowledge base of known entities with binary directed relationships between them, we detect entities present in the query. We refer to such an entity as the query entity (qe). A facet (f) is defined as the directed relationship between two entities, starting from the query entity to a facet entity (fe). For popular entities, we typically have several hundreds of facets in our knowledge base, as well as a few dozen facets for the infamous entities. Figure 6.2 shows the distribution of the facets per entity in our knowledge base.
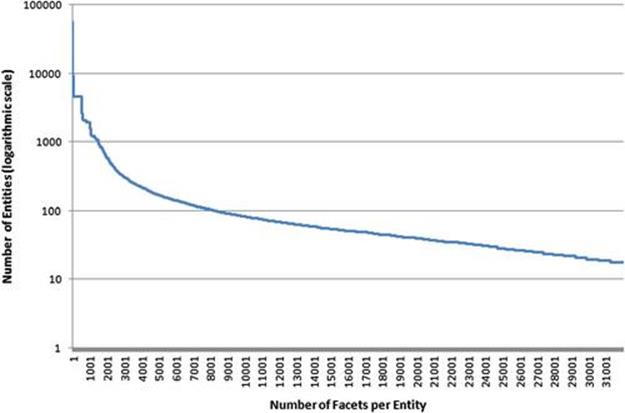
FIGURE 6.2 Distribution of the number of facets per entity. The number of entities is in logarithmic scale. Although some entities have large numbers of facets (typically these are location entities that are connected to many other points of interest), some entities have fewer related facets.
For each entity, the following information is maintained. The reference is used internally to identify and manage the entity. The canonical name is shown to the user when the entity ranking experience is triggered in the search engine results page. The type indicates the semantic class of the entity, that is, whether the entity is a person, a location, a media work, etc. The subtypes provide a more fine-grained typology for the entity. An entity can have several subtypes. For example, a person in a film knowledge base can be both an actor and a producer. In addition, an entity can have one or more variants (e.g., alternate names, birth names, aliases) that capture colloquial references to this entity. We assume that problems related to de-duplication of known entities with identical canonical names and types are resolved within the knowledge base, as is the handling of other disambiguation problems. For ease of reference when computing a ranking, we assume that an entity can be uniquely identified through its normalized canonical name and type.
For each facet, the following information is maintained: the reference to the query entity, the reference to the facet entity, and the relationship type as well as how frequently we observe that relationship in the sources feeding our knowledge base. Typically, multiple facets can be defined between an entity-facet pair ![]() , reflecting the different roles that can occur between any two entities.
, reflecting the different roles that can occur between any two entities.
To illustrate this concept with an example, consider the location India. Table 6.1 shows the typical data that we would have on file for this particular location. In any of our ranking sources, both the canonical name and its variants are used as references for this entity. India is a location of subtype country.
Table 6.1
Example entity.
|
reference |
ID::286186 |
|
canonical name |
India |
|
variant |
India; Bharat |
|
type |
location |
|
subtype |
country |
Table 6.2 shows the information stored for a facet, which simply contains a reference to both entities and the type of the relationship.
Table 6.2
Example facet.
|
query entity |
ID::286186 (i.e., India) |
|
facet entity |
ID::2295414 (i.e., city of Hyderabad, India) |
|
type |
has_point_of_interest |
6.2.2 Knowledge Base
As mentioned, the type of experience described in this chapter relies on a knowledge base of entities and the relationships between them. The construction of the first version of that knowledge base is described in [356]. This section describes the new knowledge base and its building process.
The system we have designed and implemented for building this knowledge base is called Yalinda. Yalinda extracts various form of knowledge, including entities, their attributes (i.e., reference, canonical name, variants, type, subtypes, other attributes) and the relationships between them (i.e., labeled directed binary relationships). Yalinda extracts this knowledge from structured sources. This extraction is done automatically and frequently, using data scraping and data feed processing techniques. The extracted knowledge is normalized and serialized into semantic graphs, one per input source and domain, providing unified views that are convenient for consumption. Yalinda is implemented as a framework consisting of general modules that provide the common features and pluggable modules with special features such as wrappers for specific data. It follows a three-step process: the data acquisition step, the knowledge extraction step, and the knowledge serialization step, as described in a moment.
Regarding input source selection, a typology of potential sources has been defined, and potential sources have been reviewed and analyzed regarding practical knowledge extraction. To maximize the tradeoff among precision, coverage, and cost, the focus has been set on extracting knowledge from large high-quality structured sources. Selected sources include both internal specialized sources, such as Yahoo! properties (e.g., Y! Movies, Y! Sport, Y! TV, Y! Music, Y! GeoPlanet, etc.), and broad-coverage reference sources such as online collaborative encyclopedias (e.g., Wikipedia, Freebase). Depending on the source, the knowledge base is updated daily, weekly, or quarterly.
In the data acquisition step, new data are retrieved from remote locations and made available locally in a standard processable way to ease extraction. Main challenges include dealing with various protocols, APIs, encodings, and formats. Sometimes input data must also be retrieved and combined from several sources to form a convenient input dataset. Resulting data and metadata are stored locally as structured data feeds. In the knowledge extraction step, entities, attributes, and relationships are extracted from the data feeds and normalized. Entities and associated facts are extracted using wrappers specific to a schema or format. Entities and their attributes are normalized according to their semantics using rules, focusing on the main attributes and the attributes that can be used as pivot for building relationships. Challenges depend on the source processed. In the knowledge serialization step, extracted knowledge is refined and serialized into entity-relationship graphs. The main challenge is to identify and model the meaningful relationships and to materialize them using specific attribute values as pivots.
Overall, the resulting knowledge base includes millions of entity instances (100+ fine-grain types) and hundreds of millions of relationship instances (300 fine-grain relationship types, including both first- and second-order relations). The domains currently covered include Automotive, Book, Finance, Movie, TV, Music, Notability, Periodical, Product, Sport, etc. For popular entities we typically have in our knowledge base on the order of several hundred relationships and a few relationships for the infamous entities.Figure 6.2 shows the distribution of the facets per entity in our knowledge base.
6.2.3 Web Search Experience
The research presented in this chapter is powering the faceted search experience in Web searches. Figure 6.1 depicts a screen shot of the experience, where the user has searched for “India.” The Web search results page is organized into three columns; the left column is used to present entity ranking results whenever the query contains entity terms, the middle column contains the traditional Web search results along with their snippets that show a summary of the match between the Web page and the query, and the right column is used to display relevant ads if the query contains commercial intention. In addition to the three-column layout, rich results are embedded in the middle column above the traditional Web search results whenever the corresponding structured data are available, depending on the type of query.
Though our ranking strategy blends the facets and entities of different types, when shown to the user the facets are grouped by their type to enhance user comprehension. In addition, we show a mini-thumbnail for each facet to aid users and capture their attention. Both aspects are variable across different queries and will affect user engagement. When training and evaluating the ranking strategies presented here, we deploy clickthrough behavior as well as editorial assessments. The latter allows us to eliminate any bias in the evaluation with respect to these two variables.
6.3 Feature Space Analysis
Previous studies have introduced a probabilistic feature framework that allows us to quickly derive a pool of features from various rankings sources, such as Web search query logs, Flickr, and Twitter, as shown in Figure 6.3. Section 6.3.1 gives a brief overview of these features. In addition, in Section 6.3.2 we experiment with a new set of features, based on the analysis of the entity graph that forms our knowledge base.
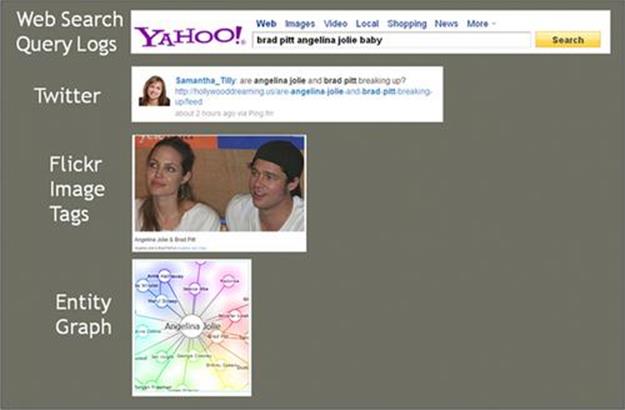
FIGURE 6.3 Feature sources for entity ranking.
6.3.1 Probabilistic Feature Framework
van Zwol et al. [355] introduced a framework to uniformly compute a set of features from various ranking sources. In this chapter, we discuss how to use this framework to compute the features over Web search query logs, tags used to annotate photos in Flickr, and entity pairs detected in tweets from Twitter users. For each source, we can compute both term-based and session-based statistics.
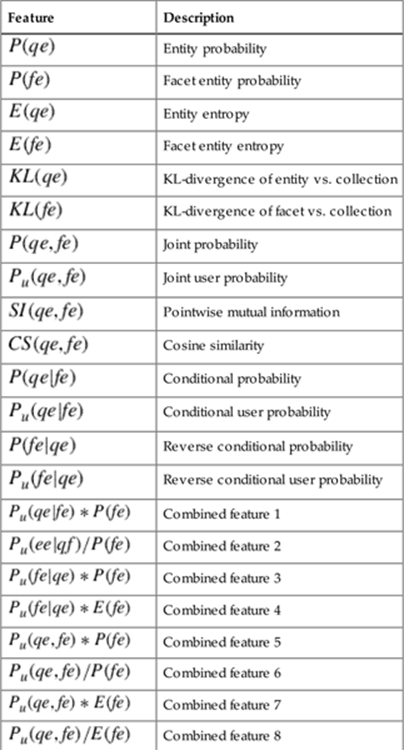
The features can be classified into four groups:
– Atomic features that work on one of the entities in the facet ![]() —for example, the entity probability or its entropy
—for example, the entity probability or its entropy
– Symmetric features such as the point-wise mutual information and joint probability
– Asymmetric features such as the conditional probability and KL-divergence
– Combinations of features such as ![]() that combine the conditional (user) probability of a facet f given entity e and the probability of the facet; according to Skowron and Araki [319], this allows the learning algorithm to make a more informed decision if the combined feature is more descriptive
that combine the conditional (user) probability of a facet f given entity e and the probability of the facet; according to Skowron and Araki [319], this allows the learning algorithm to make a more informed decision if the combined feature is more descriptive
– Table 6.3 lists a set of example features we can extract.
Table 6.3
Features.
The corpus of Web documents is a valuable source to compute the similarity among related entities. All the probabilistic features we have described can be computed within the context of Web pages. In fact, a simple approximation of these corpus-based features can be computed by retrieving the number of documents that contain the entity alone, the facet alone, and both the entity and facet together. These co-citation features for the entity and the facet are computed from the Web search results as total hits and deep hits.
6.3.2 Graph-Based Entity Popularity Feature
An entity-facet pair ![]() illustrates the relation between a query entity and a facet entity. We can deduce a whole entity network over all the entities if we connect all the pairs. The network can be built by simply connecting the facet of one pair to the entity of another pair if the two are of the same surface form.
illustrates the relation between a query entity and a facet entity. We can deduce a whole entity network over all the entities if we connect all the pairs. The network can be built by simply connecting the facet of one pair to the entity of another pair if the two are of the same surface form.
Figure 6.4 shows a subnet of the network, centered around “Angelina Jolie.” Three labeled nodes represent three entities, “Angelina Jolie,” “Brad Pitt,” and “Troy.” A direct connection between “Angelina Jolie” and “Brad Pitt” denotes an entity-facet pair ![]() . But the entity “Angelina Jolie” and “Troy” is related through “Brad Pitt.”
. But the entity “Angelina Jolie” and “Troy” is related through “Brad Pitt.”
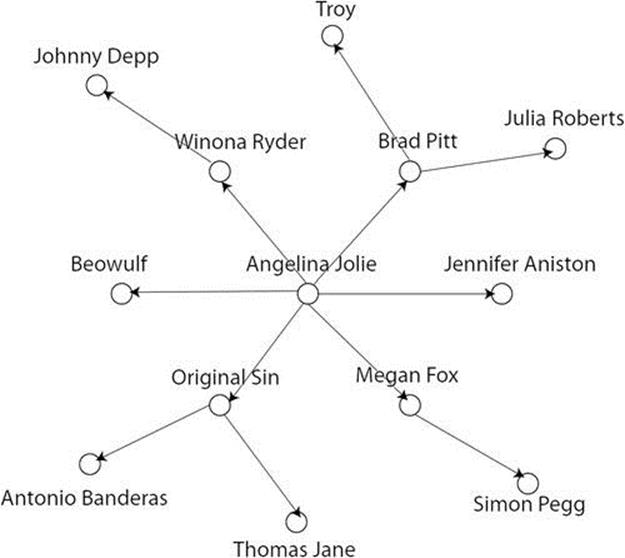
FIGURE 6.4 Entity graph: An example.
The entity network is very similar to a social network. Each node in the social network refers to a user, whereas this node equals an entity in the entity network. We can extract many features from the entity network that are useful in the context of entity ranking. Some obvious features include the shortest distance between two entities, the number of paths between two nodes, and the number of shared connections. The concept of shared connections is inspired from the idea of mutual friends in social networks [180]. The intuition is that if two entities have many shared nodes or connections in the entity graph, they are more related to each other. We utilize normalized shared connections at various depths as features in our framework.
In addition to these graph-based features, we incorporated another feature based on the entity popularity on the entity network. The intuition is that more popular entities are more likely to be “eye sparking” and more often clicked by users. Mathematically, we represent this graph as a ![]() adjacency matrix,
adjacency matrix, ![]() , where
, where ![]() if entity
if entity ![]() connects to entity
connects to entity ![]() . In practice, we normalize
. In practice, we normalize ![]() so that
so that ![]() . Given this matrix and an eigen system,
. Given this matrix and an eigen system, ![]() , the eigenvector,
, the eigenvector, ![]() , associated with the largest eigenvalue,
, associated with the largest eigenvalue, ![]() , provides a natural measure of the centrality of the user [38]. The analog in Web search is the PageRank of a document [44]. This eigenvector,
, provides a natural measure of the centrality of the user [38]. The analog in Web search is the PageRank of a document [44]. This eigenvector, ![]() , can be computed using power iteration,
, can be computed using power iteration,
![]() (6.1)
(6.1)
where ![]() is a matrix whose entries are all
is a matrix whose entries are all ![]() . The interpolation of
. The interpolation of ![]() with
with ![]() ensures that the stationary solution,
ensures that the stationary solution, ![]() , exists. The interpolation parameter,
, exists. The interpolation parameter, ![]() , is set to 0.85. We perform 15 iterations (i.e.,
, is set to 0.85. We perform 15 iterations (i.e., ![]() ).
).
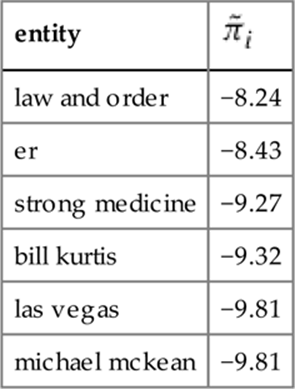
We computed ![]() for 4 million entities. Table 6.4 lists the top six entities associated with the highest values of
for 4 million entities. Table 6.4 lists the top six entities associated with the highest values of ![]() .
.
Table 6.4
Entity popularity feature values of top entities.
6.4 Machine-Learned Ranking for Entities
Machine learning has been used extensively for many ranking tasks [48]. In this book, we follow the gradient-boosted decision tree framework applied to pairwise preferences [407], which has been successful for some ranking problems. In the entity ranking problem, there are three main challenges:
– There is small amount of editorial data, which is a common situation in developing a ranking function for a new domain.
– User clicks are sparse and very noisy. Since entity search results are shown along with Web search results, clicks are considerably fewer compared to Web search. Also, the thumbnails for entities add a strong bias, which leads to very noisy clicks.
– Entity search results are grouped by categories of facets, which complicates the ranking problem. This also requires a new problem definition for learning a ranking function.
To overcome the problem of sparse editorial data, we propose to augment the training data using the clickthrough data (in Section 6.4.3). However, without a proper mechanism to deal with sparse and noisy clicks, the augmented training data would not produce a robust ranking function. Hence, we propose a method of combining multiple click models to tackle the problem of sparse and noisy clicks (in Section 6.4.2). To deal with categories of facets, a new loss function can be proposed, since it utilizes the category information (in Section 6.4.3).
6.4.1 Problem Definition
In contrast to Web search, the entity search results are grouped by categories of facets. For example, for a movie actor entity, a group of person facets is first shown in a group, and a group of movie facets follow. The order of these groups is predetermined by user behavior (Section 6.5.2) based on the category of the query entity.
In the Web search ranking problem, a set of ![]() documents
documents ![]() is given as input and a permutation
is given as input and a permutation ![]() of
of ![]() is returned as output. In our entity ranking problem,
is returned as output. In our entity ranking problem, ![]() is split into a set of groups by categories of results:
is split into a set of groups by categories of results: ![]() , where
, where ![]() contains results with category
contains results with category ![]() . Our goal is to generate a permutation or ranking
. Our goal is to generate a permutation or ranking ![]() for each category
for each category ![]() .
.
A straightforward approach would be to train a ranking function for each category separately using only the subset of training data for the category. However, there are two problems:
1. The training data for each category may be too small to train a robust ranking function (even the entire available training data are small).
2. We may lose some useful relationships between facets with different categories. For example, assuming that ![]() and
and ![]() , if we have “intercategory” relationships in our training data that
, if we have “intercategory” relationships in our training data that ![]() and
and ![]() , these may be leveraged to provide an “intracategory” constraint
, these may be leveraged to provide an “intracategory” constraint ![]() .
.
In this way, “intercategory” relationships may help “intracategory” ranking. Thus, we propose to generate a single ranking ![]() for the whole
for the whole ![]() to leverage these “intercategory” relationships. The ranking
to leverage these “intercategory” relationships. The ranking ![]() for each category
for each category ![]() is then derived from
is then derived from ![]() by simply ordering
by simply ordering ![]() according to
according to ![]() .
.
6.4.2 Pairwise Comparison Model
In generating pairwise preferences as additional training data using click models [58,110], the high accuracy of the pairwise preferences is necessary to learn a robust ranking function. However, in our entity ranking problem, a common way of generating the pairwise preferences [58,110] may not work due to sparseness and noisiness of user clicks.
In this section, we introduce an approach, called the pairwise comparison model (PCM), that learns robust pairwise preferences for entity pairs based on pairwise click features.
Some click models [58,110] have been used to enrich the training data for the boosting algorithm [407] in two steps:
1. They compute a relevance score for each (query, URL) pair.
2. The pairwise preference between two URLs is decided by the relevance scores of the two URLs: a facet ![]() is preferred to a facet
is preferred to a facet ![]() if
if ![]() where
where ![]() is a click model and
is a click model and ![]() is a feature vector for
is a feature vector for ![]() .
.
The second step raises some questions. First, this method relies on a single-click model ![]() to generate pairwise preferences. If the accuracy of the click model is not sufficiently high (due to noisiness of clicks in our data), the generated preference data may not improve a ranking function when it is added to the editorial data. Thus, it raises the question of whether we may leverage multiple click models, which can possibly complement each other to get more reliable preferences. Second, in this method, the pairwise preferences are indirectly derived from “pointwise” scores (
to generate pairwise preferences. If the accuracy of the click model is not sufficiently high (due to noisiness of clicks in our data), the generated preference data may not improve a ranking function when it is added to the editorial data. Thus, it raises the question of whether we may leverage multiple click models, which can possibly complement each other to get more reliable preferences. Second, in this method, the pairwise preferences are indirectly derived from “pointwise” scores (![]() and
and ![]() ). This motivates us to design a model that directly predicts a preference between two facets.
). This motivates us to design a model that directly predicts a preference between two facets.
The pairwise comparison model (PCM) takes a “pairwise” feature vector as input and predicts a preference. Given two facets ![]() and
and ![]() , we extract a pairwise feature vector
, we extract a pairwise feature vector ![]() . Then the pairwise comparison model
. Then the pairwise comparison model ![]() is applied to
is applied to ![]() to obtain the preference between
to obtain the preference between ![]() and
and ![]() is preferred to
is preferred to ![]() if
if ![]() . The key insight is that we use the responses of multiple click models as features (
. The key insight is that we use the responses of multiple click models as features (![]() ) and train a model (
) and train a model (![]() ) using them. We first describe how we extract a pairwise feature vector
) using them. We first describe how we extract a pairwise feature vector ![]() for two facets. Then, we show how we train the pairwise comparison model.
for two facets. Then, we show how we train the pairwise comparison model.
Some pairwise features can be derived from two facets. For each (entity, facet ![]() , facet
, facet ![]() ) tuple, we have the following pairwise features:
) tuple, we have the following pairwise features:
– ![]() :
: ![]() for the click sessions in which the facet
for the click sessions in which the facet ![]() is ranked higher than the facet
is ranked higher than the facet ![]() , where
, where ![]() is the number of sessions in which facet
is the number of sessions in which facet ![]() was not clicked but facet
was not clicked but facet ![]() was clicked, and
was clicked, and ![]() is the number of sessions in which facet
is the number of sessions in which facet ![]() was clicked but facet
was clicked but facet ![]() was not clicked.
was not clicked.
– ![]() :
: ![]() for the click sessions in which facet
for the click sessions in which facet ![]() is ranked one position higher than facet
is ranked one position higher than facet ![]() .
.
In addition, we have some features derived from each facet. For each (entity, facet) pair, we have the following pointwise features:
– CTR.
– skipCTR : ![]() , where
, where ![]() denotes the number of sessions where a facet
denotes the number of sessions where a facet ![]() was clicked, and
was clicked, and ![]() denotes the number of sessions where
denotes the number of sessions where ![]() is not clicked but some other facets ranked below
is not clicked but some other facets ranked below ![]() are clicked. skipCTR is a reasonable approximation of the DBN model score [58].
are clicked. skipCTR is a reasonable approximation of the DBN model score [58].
– Cumulated relevance (Cumrel) [111], a state-of-the-art click model that estimates the relevance of a document based on user behavior.
Although these features are pointwise ones, the concatenation or ratio of two pointwise features can be considered a pairwise feature. We define the feature vector for each (entity, facet ![]() , facet
, facet ![]() ) as follows:
) as follows:
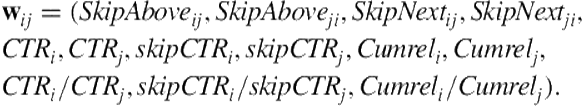 (6.2)
(6.2)
Given all these pairwise features, we have the following training data for each training entity ![]() :
:
![]() (6.3)
(6.3)
where ![]() is a numerical label given by human editors to facet
is a numerical label given by human editors to facet ![]() out of a finite set of labels
out of a finite set of labels ![]() (e.g.,
(e.g., ![]() ) and
) and ![]() is the number of facets to be ranked for
is the number of facets to be ranked for ![]() . We choose
. We choose ![]() to get enough click information among the facets and restrict the size of the training data.
to get enough click information among the facets and restrict the size of the training data.
We apply the gradient-boosting algorithm [129] on our training data ![]()
![]() to obtain a function
to obtain a function ![]() , which predicts the relative relevance of two facets
, which predicts the relative relevance of two facets ![]() and
and ![]() .
.
6.4.3 Training Ranking Function
In this section, we propose how to incorporate facet categories in the loss function to learn a ranking function. We start with a simple loss function that ignores facets categories and then show a new loss function incorporating facet categories.
The boosting algorithm [407] uses pairwise preferences as input to learn a ranking function. We have two sets of pairwise preferences:
– ![]() , where
, where ![]() is a numerical label given by human editors to a facet
is a numerical label given by human editors to a facet ![]() (the larger, the more relevant)
(the larger, the more relevant)
– ![]() , where
, where ![]() is the pairwise comparison model described in Section 6.4.2 and
is the pairwise comparison model described in Section 6.4.2 and ![]() is a threshold to obtain reliable preferences
is a threshold to obtain reliable preferences
For each (entity, facet) pair, we extract a feature vector ![]() containing all the features described in Section 6.3. The boosting algorithm optimizes the following loss function:
containing all the features described in Section 6.3. The boosting algorithm optimizes the following loss function:
 (6.4)
(6.4)
where ![]() is a parameter that controls the balance between the two sets.
is a parameter that controls the balance between the two sets.
Note that this loss function ignores facet categories. We now introduce a new loss function that considers facet categories. First we define some notation. ![]() and
and ![]() can be split into two sets:
can be split into two sets:
![]() (6.5)
(6.5)
![]() (6.6)
(6.6)
where
![]() (6.7)
(6.7)
![]() (6.8)
(6.8)
![]() (6.9)
(6.9)
![]() (6.10)
(6.10)
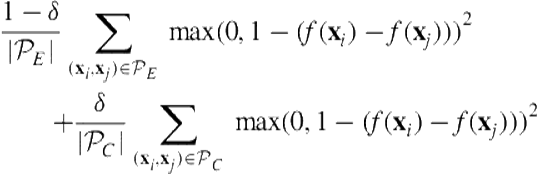
The new loss function is
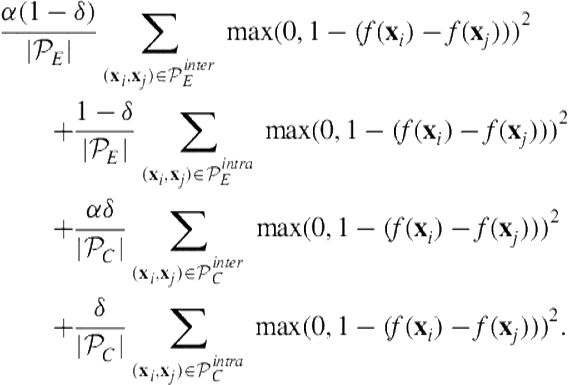 (6.11)
In this new loss function, we introduce a parameter ![]() that controls the weight for “inter”-category pairs of facets. If
that controls the weight for “inter”-category pairs of facets. If ![]() , the new loss function is equivalent to (6.4). If
, the new loss function is equivalent to (6.4). If ![]() , we are considering different groups of facets as though they are from different queries.
, we are considering different groups of facets as though they are from different queries. ![]() between 0 and 1 may help intercategory ranking, which is empirically shown in Section 6.5.
between 0 and 1 may help intercategory ranking, which is empirically shown in Section 6.5.
6.5 Experiments
In this section we present experimental results to validate our approach. Two types of experiments are conducted to validate our algorithms. The first set of experiments are to evaluate the performance of our approach on editorially judged entity pairs; the second set of experiments uses the user behavior data on the search results page to compute the efficacy of our approach.
6.5.1 Experimental Setup
We use the query log from the Yahoo! Search Engine to sample entity queries that match from our dictionary of entity names. For each of these entities, we extract the related entities from their connections in the entity graph. For all of these related entities, a five-point relevance grade is obtained that indicates the match between the query entity and the facet entity. A feature vector is computed for each of these relationships. The dataset for our experiments consists of the pair of entities that are related, the relevance grade that indicates the match between the entities and the feature vector.
Our dataset consists of 6,000 query entities and overall 33,000 entity-facet pairs, including both training and test data. These entity-facet pairs were given a five-point editorial grade that indicates the relevance of the facet entity to the query entity. The inter-editor agreement among the editors for this study was close to 78%. Since the relevance of the facet to the query is sometimes objective, this is understandable, and thus we propose methodologies to combine the editorial data with the user preference data obtained from clickthrough logs. In our training data, we combine two sets ![]() and
and ![]() ; the set of pairwise preferences generated by the previous editorial data contains 93,000 (entity, facet
; the set of pairwise preferences generated by the previous editorial data contains 93,000 (entity, facet ![]() , facet
, facet ![]() ) tuples.
) tuples. ![]() , the set of pairwise preferences generated by the pairwise comparison model consists of 189,000 (entity, facet
, the set of pairwise preferences generated by the pairwise comparison model consists of 189,000 (entity, facet ![]() , facet
, facet ![]() ) tuples.
) tuples.
Our baseline is a simple linear combination of the conditional probabilities, as explained in Section 6.3.1, across different feature sources, such as Web search query terms, Web search query logs, Flickr, and Twitter. We chose this baseline because it is a good representation of a simplistic user preference model that is derived from user behavior data. The conditional probability is also normalized for the number of users to make sure that each user is counted only once.
The evaluation is based on the discounted cumulative gain (DCG) [177] and the pairwise accuracy. The DCG is computed as follows:
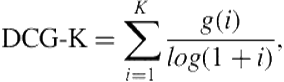 (6.12)
where ![]() is the gain associated with the rating of result at rank
is the gain associated with the rating of result at rank ![]() and
and ![]() is the maximum depth result to consider. In this chapter, we use gains of 10, 7, 3, 0.5, and 0, respectively, corresponding to the five ratings or relevance grades.
is the maximum depth result to consider. In this chapter, we use gains of 10, 7, 3, 0.5, and 0, respectively, corresponding to the five ratings or relevance grades.
The pairwise accuracy is the ratio of correct pairs
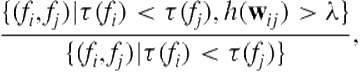 (6.13)
where ![]() is the position of
is the position of ![]() in the search results and
in the search results and ![]() is the pairwise comparison model.
is the pairwise comparison model.
A metric is computed for each query, and the average values over all the queries in our test data are reported.
6.5.2 User Data-Based Evaluation
6.5.2.1 CTR Analysis of Web Search and Entity Ranking
Before we present the results of our proposed methodologies, we show the differences in presentation and user behavior between traditional Web search results and entity ranking results to help explain the difference in the presentation bias between the two presentations. As shown in Figure 6.1, the Web search results page is organized into three columns, where the left column is used to present entity ranking results whenever the query contains entity terms, the middle column contains the traditional Web search results along with their snippets that show a summary of the match between the Web page and the query, and the right column is used to display relevant ads if the query contains commercial intention. In addition to the three-column layout, rich results are embedded in the middle column above the traditional Web search results whenever the corresponding structured data are available, depending on the type of query. Figure 6.5 shows the positionwise CTR for both traditional Web search results and entity ranking results. All the CTRx in both presented results have been normalized so that CTR at position #1 is 1. We can see that Web search has a sharp decline at position #2 and slowly decays monotonically for the lower positions. The entity ranking results also experience a similar monotonic decay, but the decline is not that steep. In fact, there is a short plateau region between position #3 and position #7. This indicates that users are more in exploratory mode when interacting with the entity ranking results and browse through various facet entities. The clicks on the entity ranking results also depend on the quality of the thumbnails shown for the entities. Choosing the right thumbnails for the candidate entities is important to mitigate the presentation bias, but solving this problem is beyond the scope of this work.
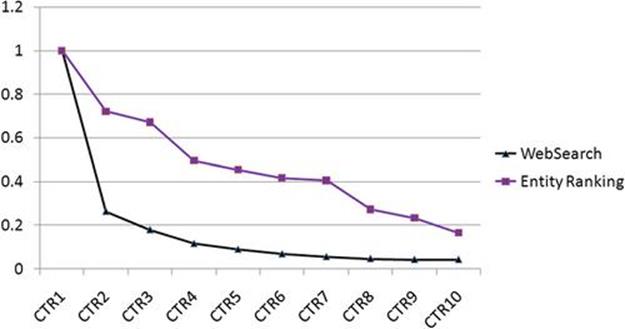
FIGURE 6.5 Comparison of positionwise CTR between traditional Web search results and entity ranking. All the CTRx in both presented results have been normalized so that CTR at position #1 is 1.
6.5.2.2 Category Interaction Analysis of Entities
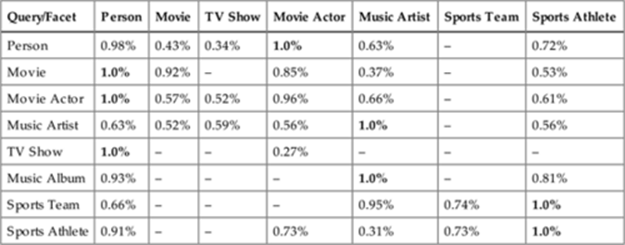
For some categories of query entities, such as movie actors and sports athletes, the facet entities could be of different categories. For example, movie entities will have movie actors and related movies as results, and they belong to two different categories. There are several ways of presenting the category information of the facet entities in the entity ranking results section. We chose to group the related entities of the same category and decide the order of the categories depending on the type of the query entity. However, it is not trivial to determine the order of categories given a query entity. To understand how the categories of the query entities and facet entities interact, we experimented with a small portion of the Web search traffic where we randomized the order of various categories of the facet entities. Table 6.5 shows the CTR for various categories of query entities on the categories of the facet entities. The CTR values have been normalized to the maximum values in each row. For example, the first row shows normalized CTR for entities of the type “Person” across various categories such as “Person,” “Movie,” “TV Show,” etc, i.e., the normalized CTR on movies for “Person” queries is ![]() . Similarly, the normalized CTR for various combinations of categories of the entities is shown in the table. From this experiment, it is evident that the person entities typically have higher CTR compared to other entities such as movies, TV shows, and sports teams. To understand this interaction of the categories among various facet entities, we conducted other experiments to evaluate the effect of including the category information of the facets into the loss function, as described in the following sections.
. Similarly, the normalized CTR for various combinations of categories of the entities is shown in the table. From this experiment, it is evident that the person entities typically have higher CTR compared to other entities such as movies, TV shows, and sports teams. To understand this interaction of the categories among various facet entities, we conducted other experiments to evaluate the effect of including the category information of the facets into the loss function, as described in the following sections.
Table 6.5
CTR on category of the query entity vs. facet entity. Each row represents the category of the query entity and the column represents the category of the facet entity; each cell represents aggregate CTR at the intersection. The CTR values are normalized for each row such that the category with the highest CTR in each row is given 1.0. The missing entries indicate that the data for the intersection of those particular categories are not available.
6.5.2.3 Evaluation of Pairwise Comparison Model
Each click model/feature in the pairwise comparison model can be used to predict the preference between two facets. Given a click model ![]() , we predict that
, we predict that ![]() is preferred to
is preferred to ![]() if
if ![]() . The accuracy of the prediction can be measured by editorial labels given to
. The accuracy of the prediction can be measured by editorial labels given to ![]() and
and ![]() . Hence, this is a binary classification problem. With a different
. Hence, this is a binary classification problem. With a different ![]() , we can plot a precision-recall graph. Figure 6.6 shows the precision recall for each click model and the PCM. It is clear that a single model is not robust; for small recall, precision is not high. Even a state-of-the-art click model such as the cumulated relevance model (Cumrel) shows the same trend. This implies that the user clicks in entity rankings are highly noisy, which we suspect is affected by the presentation bias due to thumbnail images. However, the pairwise comparison model combining these models outperforms all the single models and seems much more robust to noisy clicks.
, we can plot a precision-recall graph. Figure 6.6 shows the precision recall for each click model and the PCM. It is clear that a single model is not robust; for small recall, precision is not high. Even a state-of-the-art click model such as the cumulated relevance model (Cumrel) shows the same trend. This implies that the user clicks in entity rankings are highly noisy, which we suspect is affected by the presentation bias due to thumbnail images. However, the pairwise comparison model combining these models outperforms all the single models and seems much more robust to noisy clicks.
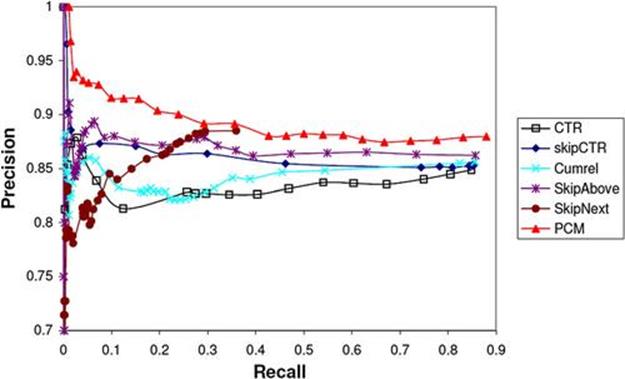
FIGURE 6.6 Precision vs. recall of several click models and the pairwise comparison model (PCM). The tradeoff between precision and recall is obtained by different thresholds used for a pairwise preference prediction.
6.5.3 Editorial Evaluation
6.5.3.1 Evaluation of Category Based Loss Function
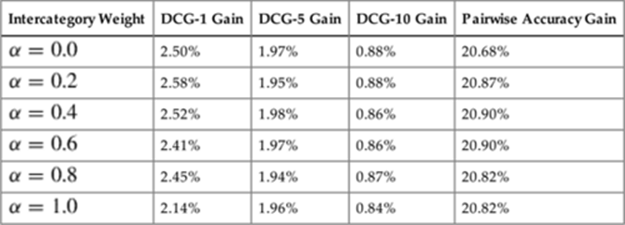
Table 6.6 shows the DCG gains with various intercategory weights ![]() over the baseline, which is a linear combination of the conditional probabilities across various feature data sources. If
over the baseline, which is a linear combination of the conditional probabilities across various feature data sources. If ![]() , facet categories are ignored in the training of a ranking function. If
, facet categories are ignored in the training of a ranking function. If ![]() , pairs of facets with different categories are not used. The result shows that the relevance is improved by using
, pairs of facets with different categories are not used. The result shows that the relevance is improved by using ![]() . Also,
. Also, ![]() between 0 and 1 provides the best relevance, which implies that the intercategory relationships between facets help the intracategory ranking (ranking within each group of facets with the same category).
between 0 and 1 provides the best relevance, which implies that the intercategory relationships between facets help the intracategory ranking (ranking within each group of facets with the same category).
Table 6.6
Relevance improvements with various intercategory weights over the baseline. The smaller ![]() , the more the intracategory relationships between facets are emphasized. DCG is computed for each group of facets with the same category.
, the more the intracategory relationships between facets are emphasized. DCG is computed for each group of facets with the same category.
6.5.3.2 Evaluation of Various Types of Features
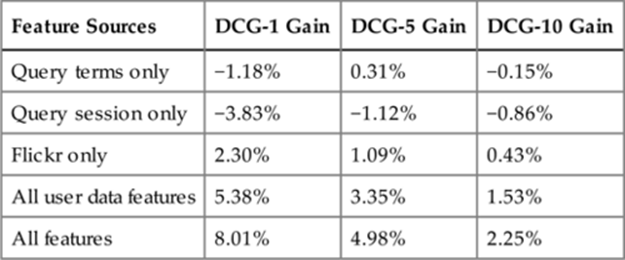
Table 6.7 shows the DCG gains with various types of features over the baseline, which is a linear combination of the conditional probabilities across various feature data sources. The table shows that the query log features by themselves are not better than the baseline, but when they are combined with the other feature sources such as Flickr, the overall gain is more than the gain from individual sources. Of all the individual data sources, Flickr seems to be most valuable because it is natural that if two entities, mostly celebrities, appear together in a photo, it is likely that these two celebrities are related. While the user data features provide a DCG-10 gain of ![]() , all features including the graph features such as popularity features and corpus based features provide an overall DCG-10 gain of
, all features including the graph features such as popularity features and corpus based features provide an overall DCG-10 gain of ![]() .
.
Table 6.7
DCG gain of various sets of features over the baseline.
6.6 Conclusions
This chapter presented a system for ranking related entities in the context of the Web search. We presented an extensive analysis of features for Web-scale entity ranking. We also proposed novel techniques for entity ranking based on machine-learned ranking models using an ensemble of pairwise preference models. We showed how to work with categories in the context of entity ranking by introducing inter- and intracategory weighting. We showed the results on one of the large knowledge bases containing millions of entities and hundreds of millions of relationships. The experiments reveal that our proposed ranking solution clearly improves simple user behavior-based ranking and several baselines. The future directions for this work include investigating the affect of time-sensitive recency-based features on related entity ranking for the buzzy entities. Another line of future work is to extend this framework to rank and recommend related entities for a given Web page, given the content and the context around the page.
1 http://dbpedia.org![]() .
.
2 www.freebase.com![]() .
.
All materials on the site are licensed Creative Commons Attribution-Sharealike 3.0 Unported CC BY-SA 3.0 & GNU Free Documentation License (GFDL)
If you are the copyright holder of any material contained on our site and intend to remove it, please contact our site administrator for approval.
© 2016-2026 All site design rights belong to S.Y.A.