Splunk Essentials (2015)
Chapter 1. Introducing Splunk
Splunk, whose name was inspired by the process of exploring caves, or splunking, helps analysts, operators, programmers, and many others explore data from their organizations by obtaining, analyzing, and reporting on it. This multinational company, cofounded by Michael Baum, Rob Das, and Erik Swan, has a core product called Splunk Enterprise. This manages searches, inserts, deletes, and filters, and analyzes big data that is generated by machines, as well as other types of data. They also have a free version that has most of the capabilities of Splunk Enterprise and is an excellent learning tool.
Note
Throughout the book, I will be covering the fundamental, bare-bones concepts of Splunk so you can learn quickly and efficiently. I reserve any deep discussion of concepts to Splunk's online documentation. Where necessary, I provide links to help provide you with the practical skills, and examples so you can get started quickly.
To learn Splunk, it is important for you to first understand the following concepts:
· How to install Splunk for different operating systems and use it for the first time
· How Splunk works with big data
· Data sources for Splunk
· Events, event types, and fields in Splunk
· How to add data to Splunk
How to install Splunk
Downloading a free version of Splunk is easy and can be done by following the steps on the website.
Splunk setup instructions
Please be sure to use the appropriate instructions for your operating system. If you have any questions, please contact an instructor.
Tip
Note that you can also find videos for setting up Splunk on Windows or Linux at http://www.splunk.com/view/education-videos/SP-CAAAGB6. This video shows you how to install version 6; in this chapter, you will install version 6.1.5.
Setting up Splunk for Windows
To install Splunk for Windows, please do the following:
1. Firstly, you need to go to http://www.splunk.com/ and click on Sign Up in the top-right corner to create a Splunk.com account.
Note
Make note of your username and password. This is your Splunk.com account information and will be referred to as such from here on.
2. Once you have successfully created an account and have logged in, click on Free Splunk in the upper-right corner. Since there are sometimes slight changes in the instructions, remember that you can link to http://www.splunk.com/download/.
3. Choose your operating system, being careful to select 32- or 64-bit (whichever is appropriate in your case; most will select 64-bit), and then install version 6.1.5.
4. Follow the installation steps as instructed. Be sure you install as local user as you will be using data coming into your own machine.
5. Once Splunk has been successfully installed, open the application by selecting it from your start menu. Splunk opens in a web browser as it is a web-based application.
6. The first time you log in, you will need to enter admin as the username and changeme as the password. You will then be prompted to change the password.
Note
Please note that the account that uses admin as the username is different from the Splunk.com account you have previously created. So please use this one in order to get Splunk started.
7. Log out of Splunk and log back in. This will conclude the installation.
Splunk for Mac
To install Splunk on your Mac OS X, we will follow the following steps:
1. Go to http://www.splunk.com/ and click on Sign Up in the top-right corner to create a Splunk.com account.
Note
Make note of your username and password. This is your Splunk.com account information and will be referred to as such from here on.
2. Once you have successfully created an account and have logged in, go to the Products menu and select Splunk Enterprise. On the resulting page (What is Splunk Enterprise?), click on the green Download Splunk button.
3. On the downloads page, click on the first download link (similar to splunk-6.1.5-XXXXXX-macosx-10.7-intel.dmg, where XXXXXX is replaced by a set of numbers) underneath the OS X downloads list.
4. Open the DMG (disk image) file after it finishes downloading. A window with a shortcut to Install Splunk should appear. Double-click on this icon to launch the Splunk installer.
5. Go through the installer. After the install completes, Splunk will prompt you to start the Splunk service that runs in the background and will eventually open a browser interface to Splunk.
Note
During installation, you may be prompted to install the command-line developer tools; if you see this message, you can click on Not Now and continue with the installation.
6. Log in with the default credentials (admin : changeme). Change the password if desired.
Note
These credentials are what you'll use to log in to Splunk on your machine and are different from the credentials of the Splunk.com account you previously created.
7. Congratulations! You can now access the Splunk dashboard. To shut down or restart Splunk, open the Splunk app in your Applications folder.
Starting up Splunk
Before getting into the practical details of Splunk, it is important to know what is really going on behind the scenes. When you start up Splunk, you are really starting up two different processes: splunkd and splunkweb. Here is the difference between the two:
· In the name splunkd, the d stands for daemon, meaning a process that is started up and then runs in the background, without interaction with the user. Splunkd is actually a C or C++ server that can process and index data even if it is streaming, or even if it is quickly moving data. It can also process and index static data files, of course. Splunkd is responsible for searching and indexing, which it does through the Splunk API, or Application Programming Interface (API). Everything that you do in Splunk requires the API, and it is also through the API that the two services communicate with each other.
· Splunkweb is the service we will interact directly with most often. It is a web interface, based on Python, which gives us a way to give commands to Splunk to get the data analysis we need. It also lets us start up and stop Splunk.
The functions of Splunk
Now it's time to look at the four main functions that Splunk carries out. These are collecting data, indexing data, searching for data, and analyzing data:
· Data collection: The process of collecting data with Splunk is enhanced, as its system makes it easy to get data from many different types of computerized systems, which are increasingly becoming the producers of most data today. Such data is frequently referred to as machine data. And since much of this is streaming data, Splunk is especially useful, as it can handle streaming data quickly and efficiently. Additionally, Splunk can collect data from many other sources. The use of specialized apps and add-ons to do this will be discussed in Chapter 4, Reports in Splunk.
· Data indexing: Before data can be searched, it needs to be indexed. To create an index actually requires two steps: parsing and indexing. Parsing, which is basically separating the data into events, involves several steps.
Note
Some of this discussion is beyond the scope of this text, but more details can be found at http://docs.splunk.com/Documentation/Splunk/latest/Indexer/Howindexingworks.
In short, in addition to breaking up chunks of data, it adds metadata (or data about data), such as host (what device did the data come from), source (where did the event originate from), and sourcetype (the format of the data), as well as timestamps and other necessary information. The next step, indexing, breaks the events into segments that can subsequently be searched. It creates a data structure for the index and then writes the raw data and index files to disk. With this index structure, searches in Splunk can be quickly done on massive data sets.
· Data searching: This quick searching capability is extremely valuable for users of Splunk. Users often go to Splunk to find data they can use to answer questions. Splunk makes it easy to search on different dimensions of the data. Since Splunk indexes data before it is searched, the search process goes very quickly. Data searching in Splunk helps enable the analysis of data (which is described next).
· Data analysis: Lastly, Splunk can be used to quickly and easily analyze data. Its indexing creates a centralized data repository that can house data of many types from a variety of sources. Splunk has a variety of default data visualizations for reports and dashboards, and these can also be customized with little difficulty, thereby letting users to target analyses to improve decision-making.
Splunk and big data
Splunk is useful for datasets of all types, and it allows you to use big data tools on datasets of all sizes. But with the recent focus on big data, its usefulness becomes even more apparent. Big data is a term used everywhere these days, but one that few people understand. In this part of the chapter, we will discuss the aspects of big data and the terms that describe those aspects.
The three Vs
The following are the three key V words used to describe big data, as well as a discussion of how each of these helps to differentiate big data from other data:
· Volume: The most obvious of the descriptors is simply the size of data we are talking about. Instead of talking in millions (megabytes) or billions (gigabytes), we talk in terabytes, petabytes, or exabytes (adding many zeros as we go).
· Variety: This term refers to the fact that big data can include all kinds of data, and it often refers to data that is not traditionally structured. In reality, little data is completely without any structure, but there is a vast amount of data that is categorized as basically unstructured. Semi-structured or unstructured data, as well as structured data, can be searched and processed quickly using the methods of big data.
· Velocity: The last V refers to the speed at which the data comes into the system. An example of where velocity of data is a requirement is the Large Hadron Collider at CERN, located on the border between France and Switzerland. Every second, 600 million particles collide in its underground accelerator, and each day the CERN Data Center processes one petabyte of data describing what has happened. Scientists at CERN must thus deal with large amounts of data that needs quick processing.
Other big data descriptors
There are other terms that are necessary to understand when talking about big data. These are:
· Streaming data: Much of the data that is large and comes quickly does not need to be kept. For instance, consider a mechanical plant. There can sometimes be many sensors that collect data on all parts of the assembly line. The significance of this data is primarily to be able to alert someone to a possible upcoming problem (through noticing a bad trend) or to a current problem (by drawing attention to a metric that has exceeded some designated level); much of it does not need to be kept for a long period of time. This type of data is called streaming data, and Splunk, with its abilities to create alerts, allows organizations to use this data to make sure they prevent or act quickly on problems that can occur.
Tip
Later, in Chapter 6, Using the Twitter App, we'll use streaming Twitter data for analysis.
· Latency of data: The term latency in regards to data refers to delay in how speedily it is entered into the system for analysis. Splunk is able to analyze data in real-time with no latency issues when deployed on hardware that is sufficient to handle the indexing and searching workload. For example, if an alert goes off, a system can be immediately shut down if there is no latency in the data. If a denial of service attack is taking place, the system can be quickly used to figure out what is happening right at that very time.
· Sparseness of data: Splunk is also excellent for dealing with sparse data. Much data in retailing environments is considered sparse. Consider a store that has many products but where most people just buy a few of them on any given shopping trip. If the store's database has fields specifying how many items of a particular type have been purchased by each customer, most of the fields would be empty if the time interval under consideration was short. We would say then that the data is sparse. In Splunk, the sparseness of data in a search ranges from dense (meaning that a result is obtained 10 percent of the time or more) to sparse (from 0.01 to 1 percent of the time). This can also extend to super sparse, or, for a better definition, trying to find a needle in a haystack (which is less than 0.01 percent), and even to rare, which is just a handful of cases.
Tip
More information on this can be found at http://docs.splunk.com/Documentation/Splunk/6.1.5/Installation/Hows.
Splunk data sources
Splunk was invented as a way to keep track of and analyze machine data coming from a variety of computerized systems. It is a powerful platform for doing just that. But since its invention, it has been used for a myriad of different types of data, including machine data, log data (which is a type of machine data), and social media data. The various types of data that Splunk is often used for are explained as follows:
· Machine data: As mentioned previously, much of Splunk's data is machine data. Machine data is data that is created each time a machine does something, even if it is as seemingly insignificant as a tick on a clock. Each tick has information about its exact time (down to the second) and source, and each of these becomes a field associated with the event (the tick). The term machine data can be used in reference to a wide variety of data coming from computerized machines – from servers to operating systems to controllers for robotic assembly arms. Almost all machine data includes the time it was created or when the actual event took place. If no timestamp is included, then Splunk will to find a date in the source name or filename based on the file's last modification time. As a last resort, it will stamp the event with the time it was indexed into Splunk.
· Web logs: Web logs are invaluable sources of information for anyone interested in learning about how their website is used. Deep analysis of web logs can answer questions about which pages are visited most, which pages have problems (people leaving quickly, discarded shopping carts, and other aborted actions), and many others. Google, in early 2014, was registering as many as 20 billion websites each day, about which you can find more information at http://www.roche.com/media/roche_stories/roche-stories-2014-01-22.htm.
· Data files: Splunk can read in data from basically all types of files containing clear data, or as they put it, any data. Splunk can also decompress the following types of files: tar, gz, bz2, tar.gz, tgz, tbz, tbz2, zip, and z along with many other formats. Splunk can even process files when they are being added to!
· Social media data: An enormous amount of data is produced by social media every second. Consider the fact that 829 million people log in to Facebook each day (more information can be found at http://newsroom.fb.com/company-info/) and they spend, on average, 20 minutes at a time interacting with the site. Any Facebook (or any other social media) interaction creates a significant amount of data, even those that don't include many data-intensive acts, such as posting a picture, audio file, or a video. Other social media sources of data include popular sites such as Twitter, LinkedIn, Pinterest, and Google+ in the U.S., and QZone, WeChat, and Weibo in China. As a result of the increasing number of social media sites, the volume of social media data created continues to grow dramatically each year.
· Other data types: You will see the other data types listed when we add data to Splunk shortly.
Understanding events, event types, and fields in Splunk
An understanding of events and event types is important before going further.
Events
In Splunk, an event is not just one of the many local user meetings that are set up between developers to help each other out (although those can be very useful), but also refers to a record of one activity that is recorded in a log file. Each event usually has:
· A timestamp indicating the date and exact time the event was created
· Information about what happened on the system that is being tracked
Event types
An event type is a way to allow users to categorize similar events. It is field-defined by the user. You can define an event type in several ways, and the easiest way is by using the SplunkWeb interface.
One common reason for setting up an event type is to examine why a system has failed. Logins are often problematic for systems, and a search for failed logins can help pinpoint problems. For an interesting example of how to save a search on failed logins as an event type, visit http://docs.splunk.com/Documentation/Splunk/6.1.3/Knowledge/ClassifyAndGroupSimilarEvents#Save_a_search_as_a_new_event_type.
Why are events and event types so important in Splunk? Because without events, there would be nothing to search, of course. And event types allow us to make meaningful searches easily and quickly according to our needs, as we'll see later.
Sourcetypes
Sourcetypes are also important to understand, as they help define the rules for an event. A sourcetype is one of the default fields that Splunk assigns to data as it comes into the system. It determines what type of data it is so that Splunk can format it appropriately as it indexes it. This also allows the user who wants to search the data to easily categorize it.
Some of the common sourcetypes are listed as follows:
· access_combined, for NCSA combined format HTTP web server logs
· apache_error, for standard Apache web server error logs
· cisco_syslog, for the standard syslog produced by Cisco network devices (including PIX firewalls, routers, and ACS), usually via remote syslog to a central log host
· websphere_core, a core file export from WebSphere
(Source: http://docs.splunk.com/Documentation/Splunk/latest/Data/Whysourcetypesmatter)
Fields
Each event in Splunk is associated with a number of fields. The core fields of host, course, sourcetype, and timestamp are key to Splunk. These fields are extracted from events at multiple points in the data processing pipeline that Splunk uses, and each of these fields includes a name and a value. The name describes the field (such as the userid) and the value says what that field's value is (susansmith, for example). Some of these fields are default fields that are given because of where the event came from or what it is. When data is processed by Splunk, and when it is indexed or searched, it uses these fields. For indexing, the default fields added include those of host, source, and sourcetype. When searching, Splunk is able to select from a bevy of fields that can either be defined by the user or are very basic, such as action results in a purchase (for a website event). Fields are essential for doing the basic work of Splunk – that is, indexing and searching.
Getting data into Splunk
It's time to spring into action now and input some data into Splunk. Adding data is simple, easy, and quick. In this section, we will use some data and tutorials created by Splunk to learn how to add data:
1. Firstly, to obtain your data, visit the tutorial data at http://docs.splunk.com/Documentation/Splunk/6.1.5/SearchTutorial/GetthetutorialdataintoSplunk that is readily available on Splunk.
2. Here, download the folder tutorialdata.zip. Note that this will be a fresh dataset that has been collected over the last 7 days. Download it but don't extract the data from it just yet.
3. You then need to log in to Splunk, using admin as the username and then by using your password.
4. Once logged in, you will notice that toward the upper-right corner of your screen is the button Add Data, as shown in the following screenshot. Click on this button:
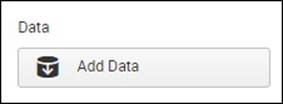
Button to Add Data
5. Once you have clicked on this button, you'll see a screen similar to the following screenshot:
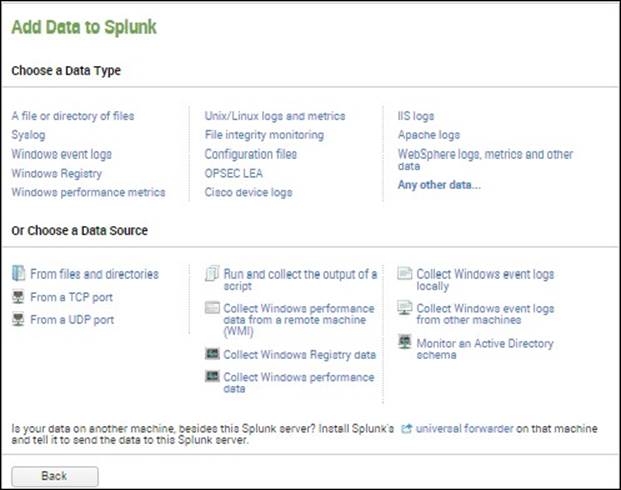
Add Data to Splunk by Choosing a Data Type or Data Source
6. Notice here the different types of data that you can select, as well as the different data sources. Since the data we're going to use is a file, under Or Choose a Data Source, click on From files and directories.
7. Once you have clicked on this, you can then click on the radio button next to Skip preview, as indicated in the following screenshot, since you don't need to preview the data now. You then need to click on Continue:

Preview data
Tip
You can download the tutorial files at: http://docs.splunk.com/Documentation/Splunk/6.1.5/SearchTutorial/GetthetutorialdataintoSplunk
8. As shown in the next screenshot, click on Upload and index a file, find the tutorialdata.zip file you just downloaded (it is probably in your Downloads folder), and then click on More settings, filling it in as shown in the following screenshot. (Note that you will need to select Segment in path under Host and type 1 under Segment Number.) Click on Save when you are done:

Can specify source, additional settings, and source type
9. Following this, you should see a screen similar to the following screenshot. Click on Start Searching. Even though we won't really do a search until the next chapter, we will look at the data now:
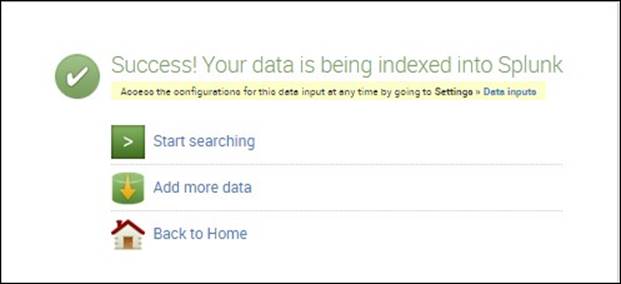
You should see this if your data has been successfully indexed into Splunk.
10. You will now see a screen similar to the following screenshot. Notice that the number of events you have will be different, as will the time of the earliest event. At this point, click on Data Summary:
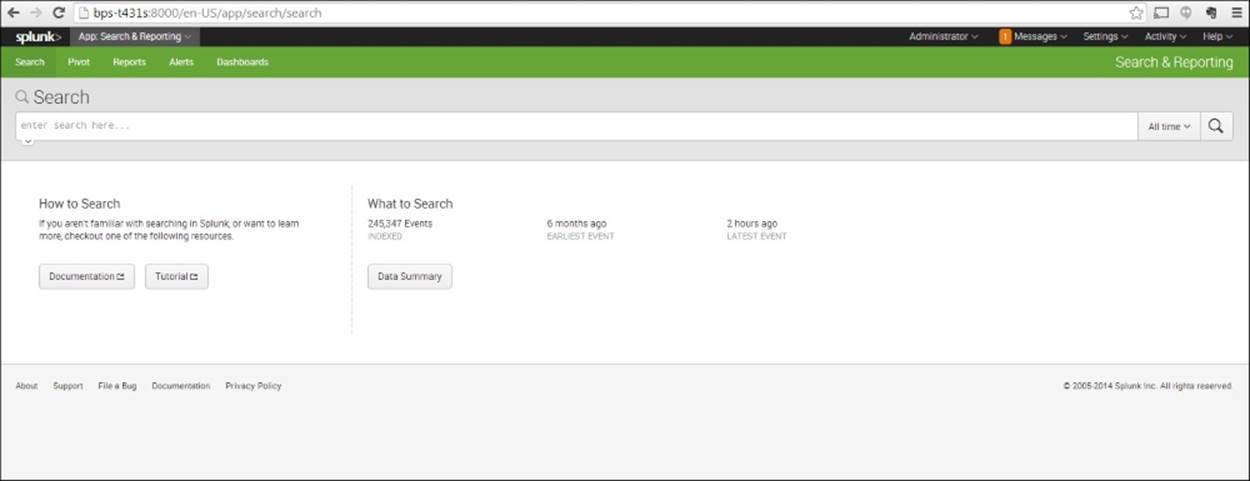
The Search screen
11. You should see the Data Summary screen like in the following screenshot. However, note that the Hosts shown here will not be the same as the ones you get. Take a quick look at what is on the Sources tab and the Sourcetypes tab. Then find the most recent data (in this case 127.0.0.1) and click on it.

Data Summary, where you can see Hosts, Sources, and Sourcetypes
12. After clicking on the most recent data, which in this case is bps-T341s, look at the events contained there.
Tip
Later, when we use streaming data, we can see how the events at the top of this list change rapidly.
13. Here, you will see a listing of events, similar to those shown in the following screenshot:

Events lists for the host value
14. From the preceding screenshot, you will notice the list of fields on the left-hand side. We will explore how to search for these fields in the next chapter. For now, you can click on the Splunk logo in the upper-left corner of the web page to return to the home page. Under Administrator at the top-right of the page, click on Logout.
Summary
In this chapter, we have learned about big data and how it can be stored, indexed, searched, and analyzed using Splunk. We have also followed steps to bring the data from a file into Splunk and then examine it.
In the next chapter, we'll go further with analyzing this data and learn how to conduct searches using Splunk.
All materials on the site are licensed Creative Commons Attribution-Sharealike 3.0 Unported CC BY-SA 3.0 & GNU Free Documentation License (GFDL)
If you are the copyright holder of any material contained on our site and intend to remove it, please contact our site administrator for approval.
© 2016-2026 All site design rights belong to S.Y.A.