Splunk Essentials (2015)
Chapter 2. An Introduction to Indexing and Searching
In the previous chapter, we showed you how to bring in data from different sources and index it. Data must be turned into information and made relevant before we can use it successfully, as raw data in files or streams won't help us answer the questions that arise while analyzing the data for our businesses or organizations. We need to collect the data that we are interested in before we can analyze it. And this is where Splunk's capabilities shine.
In this chapter, we will cover these important next steps for using Splunk:
· Collecting data to search
· How Splunk indexes data
· Using indexed data
· Specifying a sourcetype
· SPL and what it is
· How to perform your own simple search
Collecting data to search
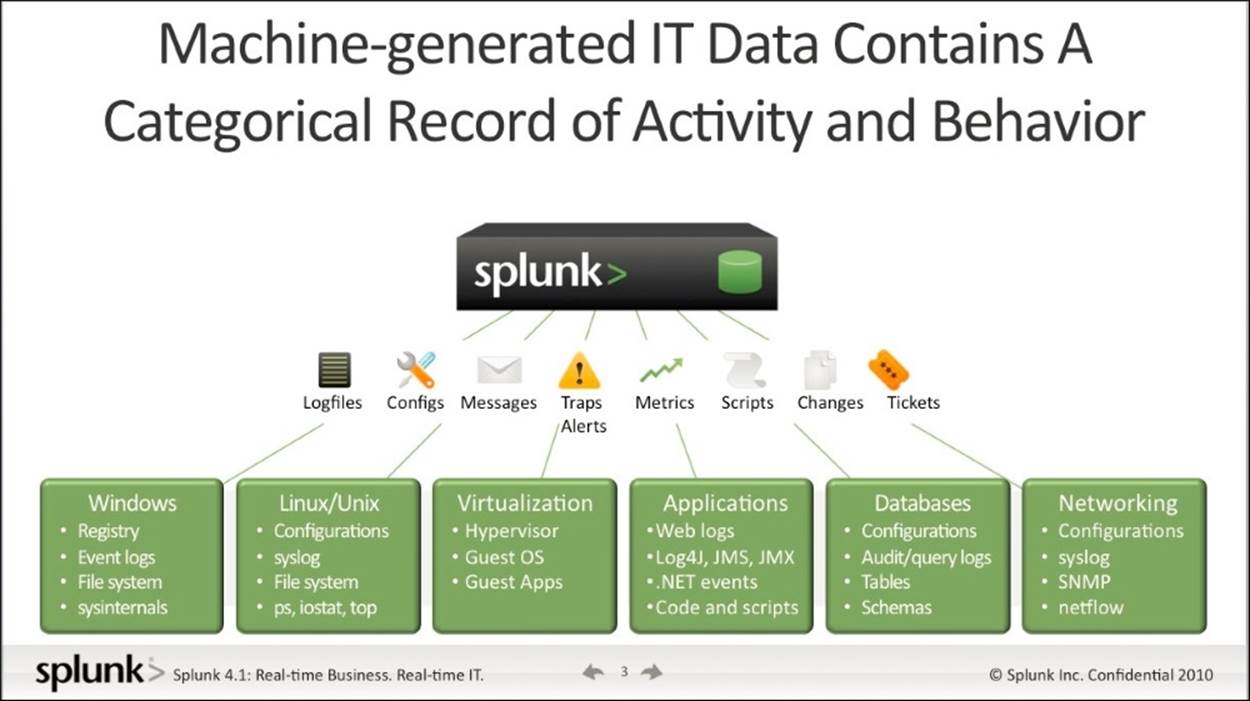
In the previous chapter, we showed you how to bring data from a file into Splunk. We also discussed how data from virtually any source can be brought into Splunk. The following diagram shows the various types of data (such as Twitter, Facebook, RSS, network, and many others that are pictured) that can be easily integrated into Splunk, then searched, added to other data, monitored, and then used for creating dashboards, reports, and other kinds of analyses. Notice that the storage capabilities of Splunk are also included in the screenshot:

Many types of data can be used with Splunk
(Source: http://www.businessinsider.com/investors-are-eating-up-these-two-enterprise-tech-ipos-heres-why-2012-4)
Almost any kind of data can be entered into Splunk, and then stored, searched, analyzed, and reported on. Additionally, you will also see a logo labeled Hadoop. You may have even heard this term before, in connection to big data. Hadoop, an Apache open source software package, is a method of storing and analyzing big data that has a lot in common with Splunk. Hadoop and Splunk can work together with the application called Hunk, which we'll talk about later in Chapter 5, Splunk Applications.
Note
Before going on, it is important to note that one of the most important capabilities of Splunk is that you can bring in large amounts of data from several different sources and easily store it and analyze it in one location.
Indexing data with Splunk
When we processed the data file in the previous chapter, we uploaded the data and Splunk processed and indexed the data. It is worthwhile to examine a bit further what happens when indexing takes place:
1. To create an index actually requires two steps: parsing and indexing. The parsing part includes the adding of metadata that always includes the host, source, and sourcetype. The indexing portion takes the events, splits them into searchable segments, and finally creates the index and raw data files.
2. After this happens, the data can then be easily searched through Splunk. The following screenshot shows how the data is brought into Splunk by forwarders. A forwarder takes data from a source, such as a web server, and then sends it to a full instance of Splunk:
This diagram shows how Splunk uses forwarders to take data from complex IT infrastructures and then sends it to be indexed and searched.
(Source: http://www.businessinsider.com/investors-are-eating-up-these-two-enterprise-tech-ipos-heres-why-2012-4)
Using indexed data
Once you have indexed a file successfully, as we did in Chapter 1, Introducing Splunk, it will be listed with any other indexes that have already been created, and you can now do searches on it.
Viewing a list of indexes
To see a list of your indexes, follow the steps given next:
1. First, visit the home page (a quick way is to just click on the Splunk icon).
2. Find the Settings drop-down menu.
3. To finally view your indexes, under Data, select Indexes.
You will see a screen like the one shown here:
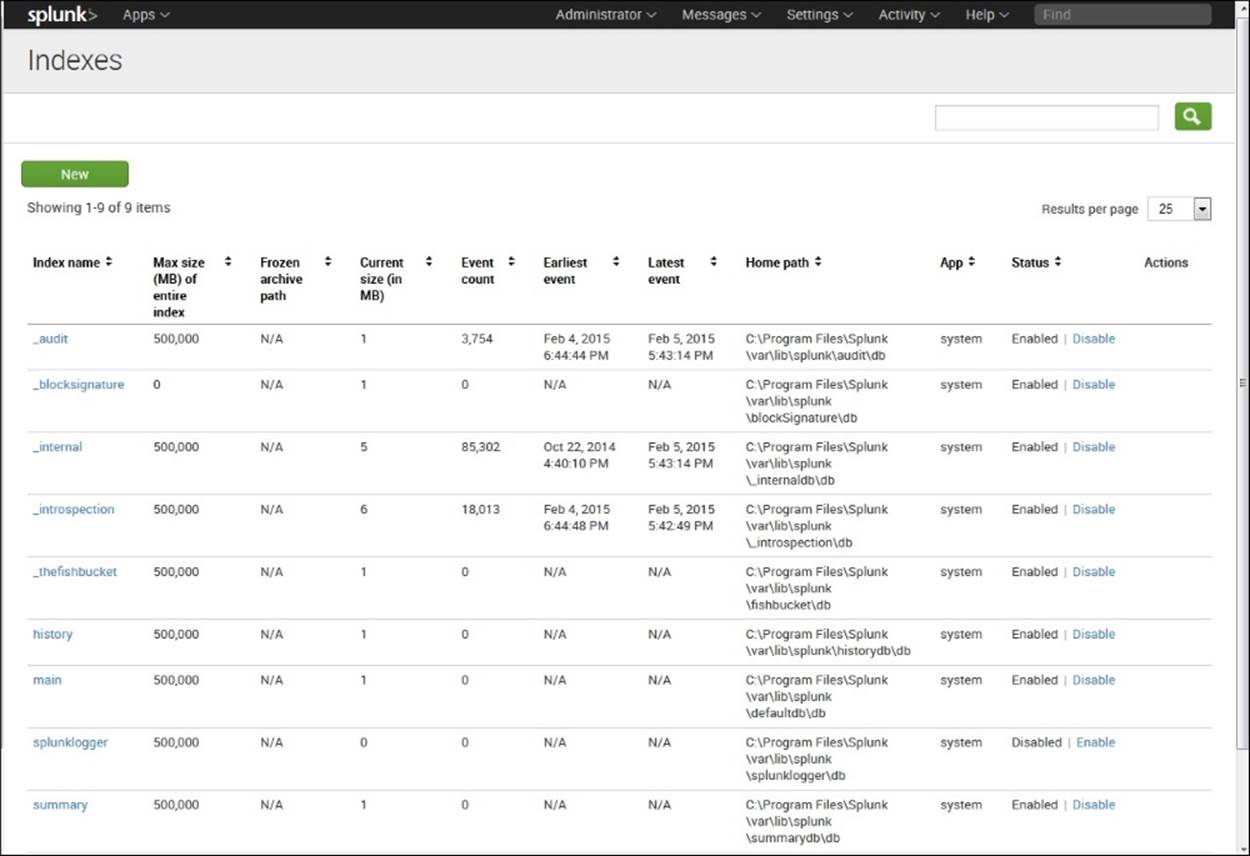
Listing of Indexes
You will see a number of internal indexes, which are preceded by an underscore. These indexes include the logs and metrics that record Splunk's internal processing. Notice that the non-internal indexes listed here are history, main, splunklogger, summary, and Twitter. The main index is often selected as a default index. The history and splunklogger indexes were used for previous versions, but are not generally used now. The summary index stores events that have been aggregated using a transforming command to set up searches over long time periods. And the Twitter index is created when you use the Twitter app, as we will do in Chapter 6, Using the Twitter App.
Bringing in indexed data
We need to bring in the indexed data before we can search it. If we do not specify an index, index=main, which is set here to be searched by default via the indexes searched by the default setting, will be assumed. To bring in all the indexed data, we could specifyindex=*. If we want to bring in the Twitter index (which you will create in Chapter 6, Using the Twitter App), we can just specify index=twitter.
When we processed the data from our file in Chapter 1, Introducing Splunk, it was indexed by default. So we do not have to specify this index when we use it as our data source and go on to learn more about how to search in Splunk.
Specifying a sourcetype
Identifying a sourcetype for data is important because it tells Splunk how to format the data. The sourcetype is one of the default fields assigned to each event that is processed. Splunk uses it to decide how it is going to process your data. The correct sourcetype is usually assigned automatically when indexing data, for Splunk comes with many predefined sourcetypes.
One such sourcetype is access_combined. Using this, Splunk can analyze combined access log files, the types that are part of the massive amount of data exhaust created by web servers such as Microsoft IIS or Apache. Some common sourcetypes include the following:
|
Sourcetype |
Used for |
|
access_combined |
A standardized format for text files used by HTTP web servers when generating server log files |
|
cisco_syslog |
Cisco standard system logs |
|
apache_error |
Errors |
Sometimes the access_combined sourcetype specifies _wcookie, which indicates that each cookie set during an HTTP request is logged. The data we brought in and indexed in Chapter 1, Introducing Splunk, was specified access_combined_wcookie. To specify this particular sourcetype, type the following into the search bar:
sourcetype=access_combined_wcookie
This will pull up the web server logs with this sourcetype so you can then use them for analysis.
When adding custom data formats, such as logs from applications built in-house, you can specify a descriptive sourcetype for the technology as the sourcetype is what is being used to differentiate the data type. For Cisco iOS devices, you can usesourcetype=cisco:ios.
What is Search Processing Language (SPL)?
After we have our data indexed, we can begin to search. The default application for Splunk is the search application. It is assumed that you are doing a search unless you indicate otherwise. Searches are made using the Search Processing Language (SPL). Through search, Splunk lets the user comb through the indexed data to find what he or she needs for answering questions.
In the simplest of terms, if you only put the term failed in the search box, for instance, it knows you want to do a search and will automatically search for failed anywhere in the data, and will return each event that fits with failed highlighted.
Using pipes when processing data with Splunk
However, SPL can be used to do much more advanced searches and analyses as well. Pipes are a way to do this. The pipe character (|) can be used to chain together different commands in a search. In the previous simple search and in our following search, a search is implied in the first pipe, but the term search itself is left out. In other words, in the following search, we could say buttercupgames or search buttercupgames and it means the same thing. There are many other commands that can be used as well, and they are listed and discussed as follows. Consider the following piped command:
buttercupgames | timechart count by itemId limit=10
The command following the pipe character acts on the data after it comes from the previous pipe. Hence, a pipe can refer to either the pipe character or the command between pipes. So, as our first pipe is the term buttercupgames, with the search term implied, all the events containing the word buttercupgames will be gathered; then the second pipe's instructions about creating a timechart showing the count by itemId will be carried out on that gathered data. We'll cover these more advanced processes in the chapters ahead.
Tip
Downloading the example code
You can download the example code files from your account at http://www.packtpub.com for all the Packt Publishing books you have purchased. If you purchased this book elsewhere, you can visit http://www.packtpub.com/support and register to have the files e-mailed directly to you.
Types of SPL commands
SPL commands can be organized into groups as shown in the following table. We will now go through each of these groups:
|
Purpose of Command |
What it Does |
Actual Commands |
|
Filter |
Reduces results to a smaller set. |
search where dedup head tail |
|
Sort |
Orders the results and can also be used to limit the number of results. |
sort |
|
Group |
Puts those results like members together in groups to better see patterns in the data. |
transaction |
|
Report |
Takes results of a search and summarizes them for a report. |
top / rare stats chart timechart |
|
Other |
Included in this group are those that allow you to filter out fields, modify fields, or add fields to your results. |
fields replace eval rex lookup |
In the following tables, we discuss each type of command, what it does, and give examples of how it is used.
Filter commands
Search, of course, is included as a filter command as it results in a smaller data set. The other filter commands take the results from a search and then further reduce them based on the commands you use:
|
Command |
What it Does |
|
search |
This is the most important command Splunk has. It is the default command as well, so there is no need for you to type it in the search box. However, if you do another search after one or more pipes, you do need to include the word search in the command. We'll learn more about search in the section How to perform simple searches. |
|
where |
This command takes an expression, such as where monthly_sales > avg_mon_sales, and evaluates it. If it is TRUE, it is kept in the search results. |
|
dedup |
This command only keeps the first x results for each search. dedup source returns only the first result for each source. Building on this, dedup 3 source returns only the first three results for each source. |
|
head/tail |
These commands look for a specified number of searched terms, counting from the top or bottom of the list of events. The head command returns the first x results. head 10 returns the first ten results. The tail command returns the last x results. Tail 10 returns the last ten results. |
The sort command
This group contains just the sort command. Here are some examples of sorts and what they do:
|
Command |
What it Does |
|
sort 0 anyfield |
This command sorts in ascending order by userid (A to Z, 1 to infinity, depending on whether the anyfield field is a number or name). The 0 means that all results are sorted, not just the default 10,000. |
|
sort 1000 fieldone –fieldtwo |
Sorts by fieldone in ascending order, then by fieldtwo in descending order, and returns up to 1,000 results. |
|
sort –fieldone, +fieldtwo |
Sorts by fieldone in descending order, and fieldtwo in ascending order. This command will return 10,000 results (the default). |
The grouping command
There is only one grouping command that we describe in the following table, although there are others. It is an important one, as it allows you to group selected events together (note that grouping can also be done through the stats command):
|
Command |
What it Does |
|
transaction |
A transaction takes selected events and groups them together. transaction ipaddress host maxspan=60s groups together all events with the same combination of ipaddress and host, where the first and last event are no more than 60 seconds apart. |
Reporting commands
The reporting commands listed here are the most important ones. They are vital to performing analyses in Splunk and also aid in creating dashboards and reports:
|
Command |
What it Does |
|
top/rare |
The top command returns the values that occur most often, as well as their counts and percentages. The default is 10. top source returns a list of the top 10 sources, including their counts and percentages. top 15 source, host returns a list of the 15 most frequent source-host combinations. |
|
stats |
The stats command returns the results of statistical calculations.It can return a single number, as in stats dc(source), which gives a distinct count that includes each different source. Or it can return a table, as in stats max(kbps) by host, which gives the maximum speed for each host. |
|
chart |
The chart command is used for creating tables of data. In each chart, the x-axis labels are indicated by either over or by. chart count(fail*) over host creates a chart showing the count of events that include the phrase "fail" plus anything after that (for example, "failed", "failure", and the like) for each value of host. For more on the chart command, go to http://docs.splunk.com/Documentation/Splunk/6.1.3/SearchReference/chart. |
|
timechart |
The timechart command produces a chart with time as the x-axis. timechart span=1d avg(delay) by host creates a chart showing the average delay by each host during a 1 day period. |
Other commands
These commands are also commonly used for analysis in Splunk. Several of those listed help subset and modify fields for targeted analyses. The lookup command links a field to a lookup table, from which results can be identified and output:
|
Command |
What it Does |
|
fields |
The fields command is used to remove fields from a search.Thus, the command fields field1 field3 keeps only the fields labeled field1 and field3. |
|
replace |
The replace command substitutes one value for another. In the statement replace 0 with Check, 9 with Warning in Status, status values of 0 are replaced with Check and status values of 9 are replaced with Warning. |
|
eval |
The eval command makes calculations and puts them into a new field. This code, eval Depth=case(depth<=3, "Low", depth>3 AND depth<=10, "Medium", depth>10, "High"), creates a new field, Depth, and uses the case function to assign the labels Low, Medium, or High, depending on the value. |
|
lookup |
The lookup command calls up a lookup table that lets you add new field values. In the statement, lookup status_desc status OUTPUT description, the field, status, is looked up in the status_desc lookup table and the corresponding description is output. |
How to perform simple searches
Now we'll go on to do a couple of simple searches. In Chapter 1, Introducing Splunk, we brought in data from a file. This data included information on events that Splunk created for a fictional online store that sells games. It includes logs from the web server as well as MySQL, a backend database system. We'll do a simple search of these logs here, and will do more advanced searches in the chapters ahead. The steps and screenshots for this process are presented as follows:
1. First, you need to start up Splunk. Go to your start menu and activate Splunk. Notice that on the right, you should have a substantial number of events listed. These are the events that were indexed when you read in the file in Chapter 1, Introducing Splunk.
2. You are interested in looking at all the events involving Buttercup Games, one of the games you have at this fictional online store. Type buttercupgames into the Search box shown in the following screenshot:

Enter buttercupgames into the search box
3. You will see something like the events listed in the following screenshot. The actual events will be different, as Splunk updates the fictional data on this site. But the events you see will have a similar structure. Incidences of the search term are highlighted in yellow. Events are listed in descending order by time, with the highest (newest) timestamp first:

Notice that when you search, the search term will be highlighted in yellow in each event and the events are listed in descending order by time, or with the highest (newest) timestamp first
4. Now add to the search itself. Next to buttercupgames, type date_wday="wednesday". Your results will look similar to the screenshot for just buttercupgames, but you'll notice that each of the events shows date_wday=wednesday.
Note
Use quotes when searching for a specific value in a specific field:
When we used the search term buttercupgames, we did not specify the field in which we were looking, so everywhere that buttercupgames occurred was picked up. When we look for date_wday="wednesday", we are looking for a specific value in a specific field, so we need to specify the field we are looking for as well as the value. It is a good idea to put the search term in quotes, but this is only required if the text you are searching for contains whitespaces or special characters.
The next search will show the difference between using the implied AND and specifying OR in a search. This is important to understand as you continue to learn about searching in Splunk:
1. Suppose that you want to try to track down all instances of failed passwords that were coming into the system.
2. Click on the Splunk icon in the top left-hand corner of the screen to go back to the home page.
3. If you type in the word fail, you might be surprised when you get no results. The reason for this is that if you just type in fail, it looks only for that, and if it does not find those specific letters, followed by a space, it will not return anything. So, it will miss failedor any other version of fail that you might think it would pick up.
4. Now type in fail* and search and you will get a different result. This time, you'll see thousands of events that show failed. Since you are interested specifically in failed passwords, you decide to search on the term failed password. Note the number of events in the upper left-hand corner.
Note
There is an implied AND when you do a search in Splunk. To get results for two different terms, be sure to use OR.
5. Imagine that you want to look at the events where there was a failed password for users myuan and harrison. If you put in failed password myuan harrison,you will get no results because of the implied AND (you cannot have a user who is both myuan and harrison at the same time). But if you put an OR between myuan and harrison, that is, failed password myuan OR harrison, Splunk returns all results for failed passwords for either user.
Note
If, for some reason, you get no results for either of these users, it probably means that the fictional users had no events. In this case, just do a simple search on the term user and select two other users from the events you see and go through Step 5 given previously.
Summary
In this chapter, we have covered the way data is collected by Splunk, indexed, and prepared for searching. We've learned about the different commands that make up the Search Processing Language (SPL) and the way commands can be piped together. Lastly, we've learned how to do some simple searches, which prepares us to do more advanced analysis in the chapters ahead.
In the next chapter, you will go on to sort, filter, change, and create fields to do more advanced analysis in Splunk.
All materials on the site are licensed Creative Commons Attribution-Sharealike 3.0 Unported CC BY-SA 3.0 & GNU Free Documentation License (GFDL)
If you are the copyright holder of any material contained on our site and intend to remove it, please contact our site administrator for approval.
© 2016-2026 All site design rights belong to S.Y.A.