Splunk Essentials (2015)
Chapter 3. More on Using Search
In the previous chapter, we learned how to collect and index data to prepare it for searching, and we also did a simple search. In this chapter, we will cover more about how to use search and other commands to analyze our data. In a nutshell, we will cover the following topics:
· More on search
· Doing a count with the stats command
· Other stat functions
· Using the eval command
· Using the timechart command
· Visualizations
· Using the top command
More on search
We did a simple search at the end of the previous chapter. Before going on to other commands, however, let's examine how we can do other types of searches. There are several rules to be aware of when doing searches:
1. Searches are not generally case sensitive. Hence, for instance, to require the exact case of each variation of the word term, enclose it in CASE(term), CASE(Term), or CASE(TERM).
2. There is an implied AND when you use the search command (or the implied search command at the start of each entry in the search bar). For example, when you put log error in the search bar, you will only see events listed that have both log AND error in them.
3. If you want to search for an exact phrase, you need to put it in quotes. Inserting log error in the search bar (for example) will yield events with that exact phrase. The term events with log errors will not appear. Remember these points when designing searches:
· If you want to search only a specific field, you need to specify that field. Otherwise, you will be searching all fields. Since you are not always aware of what can appear in other fields, the results can sometimes be surprising if you do not specify the fields you want to search. So, if you want to search the text field for the terms log or error specify:
text=*log* OR text=*error*
· Note that the wildcard asterisks signal the search to bring in every event where the strings above appear, including incidences such as bad error or login. If you only want to search for log and error as separate words, then leave out the asterisks.
4. If you only want to consider events where the text field includes both log AND error, do the following:
text=*log* text=*error*
5. The Boolean operators that Splunk supports, that is, AND, OR, and NOT, must be capitalized.
Doing a count
Recall that in Chapter 2, An Introduction to Indexing and Searching, we searched for the term, buttercupgames and found that every occurrence of it was highlighted. Now we want to look among the events for buttercupgames and get an idea of how many of each product they are selling, by doing count on productId. A count is done using stats, and the command is stats count(X), where X is a field. If you are looking for the count of events, then the parentheses may be omitted, but if you're looking for the count of each instance of a field value, you'll need parentheses. If you have 100 events where the productID field is in 100 of them but the customerid field is only in 96 of them, stats count(customerId) BY ProductId would yield a different result than stats count BY productID.
Note
Field names are case sensitive. HOST is not the same as host, so be careful when specifying field names.
Notice that when we enter the following:
buttercupgames | stats count (productId)
(Notice that the field productId has a capital I.), we get the following:

Obtain a count of all events with a productId
We can see that the count of all the events with productId is shown. However, though useful, this is not what we are looking for here.
Creating a count broken down by field values
We want to do a count for each value of the productID field. So this time we enter the following:
buttercupgames | stats count by productId
Now, as shown in the following screenshot, we get the individual counts for each productId value, so we know precisely how many were sold during the time period under consideration. We can use this information to see how well each category of productId did during that time period:

Obtain counts for values of productId
Other stat functions
There are numerous other stat functions available. Here are some of the most common ones:
|
Stats function |
Description |
|
avg(X) |
Returns the average value of field X |
|
dc(X) |
Returns the distinct count of field X |
|
earliest(X) |
Returns the earliest value of field X, chronologically |
|
last(X) |
Returns the last seen value of field X |
|
latest(X) |
Returns the latest value of field X, chronologically |
|
list(X) |
Returns the list of all values of field X as a multi-value entry |
|
max(X) |
Returns the maximum value of field X |
|
median(X) |
Returns the middle value of all values of field X |
|
min(X) |
Returns the minimum value of field X |
|
mode(X) |
Returns the most frequent value of field X |
|
perc<X>(Y) |
Returns the X-th percentile value of field Y |
|
range(X) |
Returns the range (max-min) of field X |
|
stdev(X) |
Returns the standard deviation of field X |
|
sum(X) |
Returns the sum of all values of X |
|
values(X) |
Returns the list of all distinct values of field X as a multi-value entry |
|
var(X) |
Returns the sample variance of field X |
Using the eval command
The eval command is one of the most useful Splunk search commands. Its usefulness is due to the fact that it can be used to calculate almost any expression you can think of. There are also numerous eval functions that can be used in conjunction with the command. A few of them will be shown to you here, but there are many more in the Splunk documentation:
|
Eval function |
Description |
Example |
|
case(X, "Y", . . .) |
Using pairs of arguments, X and Y, where X is TRUE, return Y. |
case(error == 404, "Not found", error == 200, "OK") |
|
ceil(X) |
Gives the ceiling of a number. |
ceil(2.2) |
|
if(X,Y,Z) |
If X is TRUE, result is Y. If X is FALSE, result is Z. |
if(error ==404, "Not found", "Found") |
|
len(X) |
Returns number of characters in the string field. |
length(field) |
|
lower(X), upper (X) |
Returns lowercase, uppercase. |
lower(username), upper(username) |
|
round(X,Y) |
Rounds X to Y decimal places. If no Y is given, round to integer. |
round (3.5) |
Combining stats with eval
Now we will try an example using stats and eval commands. Here, we want to look for the counts of how a web page was accessed, whether by using GET or POST.
We enter the following into the search box:
sourcetype=access_* | stats count(eval(method="GET")) as GET, count(eval(method="POST")) as POST by categoryId
Note
Be very careful here to use the exact capitalization for the field categoryId.
Here we are requesting all events that indicate a web page was accessed. Then we count up the number of results that used the GET and POST method, and then display those results based on categoryId of products, as shown in the following screenshot:
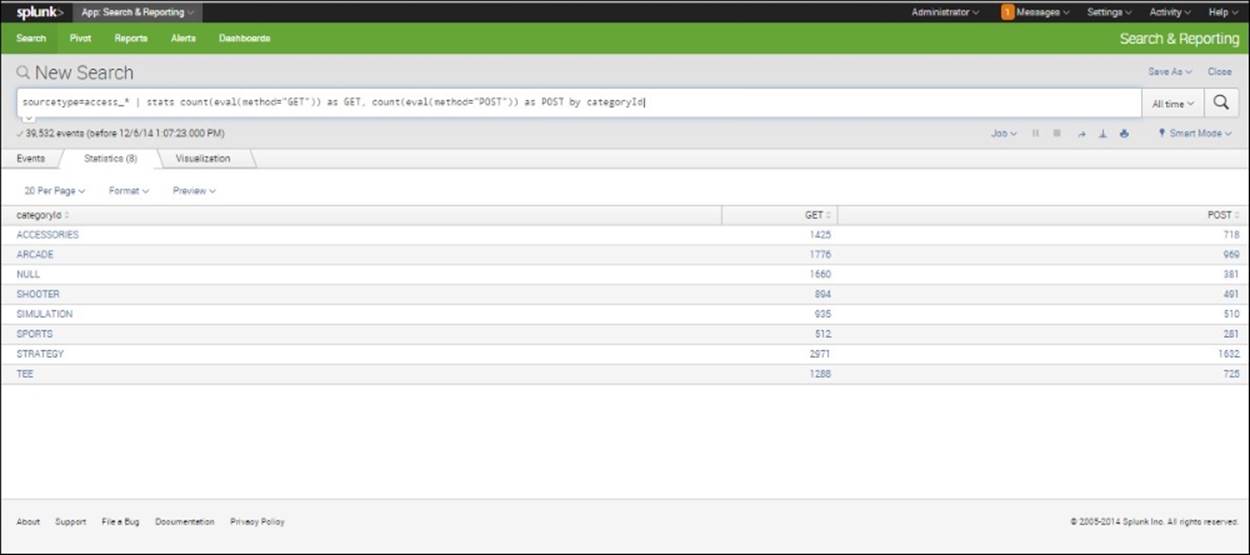
Determining Counts for "GET" and "POST" by CategoryId
Using the timechart command
We are also interested in figuring out exactly what was sold when. Are there certain days when we sell more of one product and others when we sell more of another?
To help us answer this question, we can specify the search command as shown in the following screenshot. Here we use the timechart command. This command creates a time series chart and a table of statistics. Notice that here we have set the timespan to 1 day by using the span=1d attribute. But we can use other timespans as well for analysis, with a different granularity.
Enter the following in the search bar:
buttercupgames | timechart span=1d count by productId
After inserting this search, and looking at the Statistics tab, we will be able to see a breakdown of productId sales by date, as shown in the following screenshot:

Time Chart Spanning 1 Day Showing Counts of ProductId
Visualizations
Raw counts can give us some idea, but it is often more useful to see a chart. So when we click on the Visualizations tab, we get a better picture:

Timechart Spanning 1 Day, Showing Counts by ProductId
Changing Format to Column Chart
In the previous screenshot, the NULL category (colored green in the chart) dominates the others. We can change the format of the timechart by selecting Column in the drop-down menu immediately above the chart. This format makes it easier to see the distinct categories of productId. We thus get the following results:

Timechart Presented in Column Chart format
The top command
If we want to better compare our sales for the top ProductIds over time, we can use the top command to do so. So, in the search bar, we enter the following:
buttercupgames | top 5 productId
And the resulting screen appears, as shown in the following screenshot:

Using top Command to List Top 5 Counts of ProductId
We can then click the Visualizations tab and see the following chart:
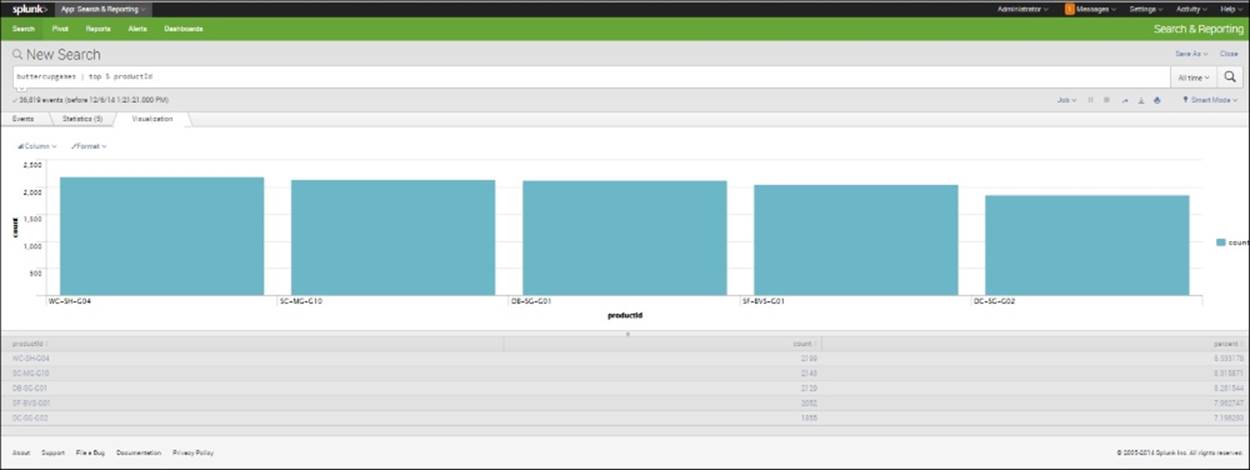
Column Chart of Top 5 ProductIds
Another way to use the top command is to pull out the top instance for a particular category. In the following screenshot, you can see the top command being used to pull out and list the top action used by each of the listed referer_domain values. We type in the following for this result:
sourcetype=access_* | top 3 action by referer_domain
This code requests the events where the sourcetype is access_* (meaning that the web server was accessed), and then lists the top 3 actions for each referring domain. Notice that the default name count is specified at the top of the counts for each of the actions for each referer_domain. If you wanted to name it something else (such as Total), you could specify the following:
sourcetype=access_* | top 3 action by referer_domain countfield=Total
The resulting window appears as shown in the following screenshot:

Top 3 Actions for referer_domain with Total Counts
Charting by the day of the week
You might also be interested in the top productId purchased on each of the seven weekdays. To get those results, you can enter the following:
buttercupgames | top 1 productId by date_wday
When you do this, you get the following result:

Top Product ID for Each Weekday
Putting days of the week in an alphabetical order
The previous screenshot is interesting, but you would probably like to format the result so that the days of the week are in the normal weekday order instead of in alphabetical order. To do this, you need to create two new fields: DayOfWeekA, that represents the alphabetic day of the week, and DayOfWeekN, that represents the numerical day of the week. (We're inventing the names of our new fields here.) We use a function, strftime, to evaluate the _time field and return the days of the week in the format we are looking for. %Aspecifies the alphabetical day of the week, and %u specifies the numerical day of the week; the combination here will give us our days in the proper order.
Note
For more information on this and other functions, refer to http://docs.splunk.com/Documentation/Splunk/6.1.3/SearchReference/Commonevalfunctions.
Then we ask for the events to be sorted first by DayofWeekN (numerically), and then followed by DayOfWeekA (alphabetically). The following code specifies this:
buttercupgames | eval DayOfWeekA=strftime(_time,"%A") | eval DayOfWeekN=strftime(_time,"%u")| top 1 productId by DayOfWeekN, DayOfWeekA
The result appears as follows:

Obtain top productId for each weekday, sorted in normal weekday order
Summary
In this chapter, we have learned more about how to search using Splunk. We have also introduced how to use the stats command and the eval command, as well as how to find top values, and how to create timecharts, tables, and visualizations.
We will continue to use what we have learned (in combination with some other commands) in Chapter 4, Splunk Reports, and we will learn how all these commands can be used to create useful reports and dashboards.
All materials on the site are licensed Creative Commons Attribution-Sharealike 3.0 Unported CC BY-SA 3.0 & GNU Free Documentation License (GFDL)
If you are the copyright holder of any material contained on our site and intend to remove it, please contact our site administrator for approval.
© 2016-2026 All site design rights belong to S.Y.A.