Splunk Essentials (2015)
Chapter 7. Monitoring and Creating Alerts in Splunk
In the past six chapters, we have introduced you to Splunk, its apps ecosystem, and how they work with data. We have also shown you how to use Splunk to create reports and dashboards. In this chapter, we will cover how to monitor and create alerts in Splunk. We will cover the following topics:
· Monitoring your system in Splunk
· Looking at geographic data
· What an alert is
Monitoring your system in Splunk
We often want to monitor data so that we can see what is happening with it and what it indicates about the system that is creating it. In a business, sensors, logs, and other types of data are produced that you need to keep track of by using metrics. You can set up reports to monitor these metrics using Splunk. Here are some ways to answer questions that businesses might have.
Analyzing the number of system users
Imagine that you've been having problems over the last couple of days and you want to simply measure how many people are on your system during each hour. To do this, enter the following code into the search bar:
sourcetype=access_* earliest=-2d@h latest=now | timechart count
Here we see the use of two time modifiers, earliest and latest, which can be used to indicate the relative start time that you want to use as well as the end time. In this case, earliest=-2d@h means that you should include events that occurred within the last two days (-2d), and round to the nearest hour (@h). When you use this code, the timechart count pipe provides a count of events for each hour over the last two days.
You will see a chart like this:

Using Time Modifiers (Earliest and Latest) with timechart
Discovering client IP codes that have not been used on certain days
You might want to find out if some clients have not used your system in the last few days. You can check this out with the code shown as follows:
* clientip !=211* | timechart count
This code searches all events for those where the clientip is not equal to 211* (!= means not equal and 211* refers to all IP addresses beginning with 211). The first part of an IP address (the first three digits) usually signifies the network. The following screenshot shows are the results, which show the IP codes beginning with 211 that engaged with the site a lot during one month, but did not during the next three months. Your data probably does not look like this though. We found this pattern because we downloaded thetutorialdata.zip twice, with three months between the first and the last download:
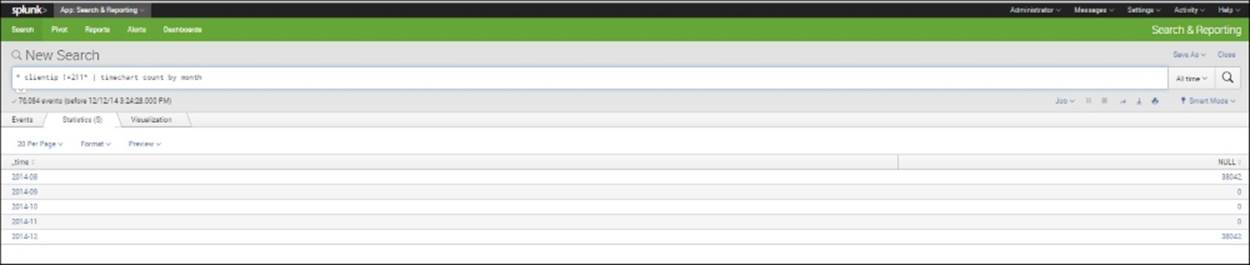
Search for Client IP Addresses that are Not Equal to 211* Using Timechart
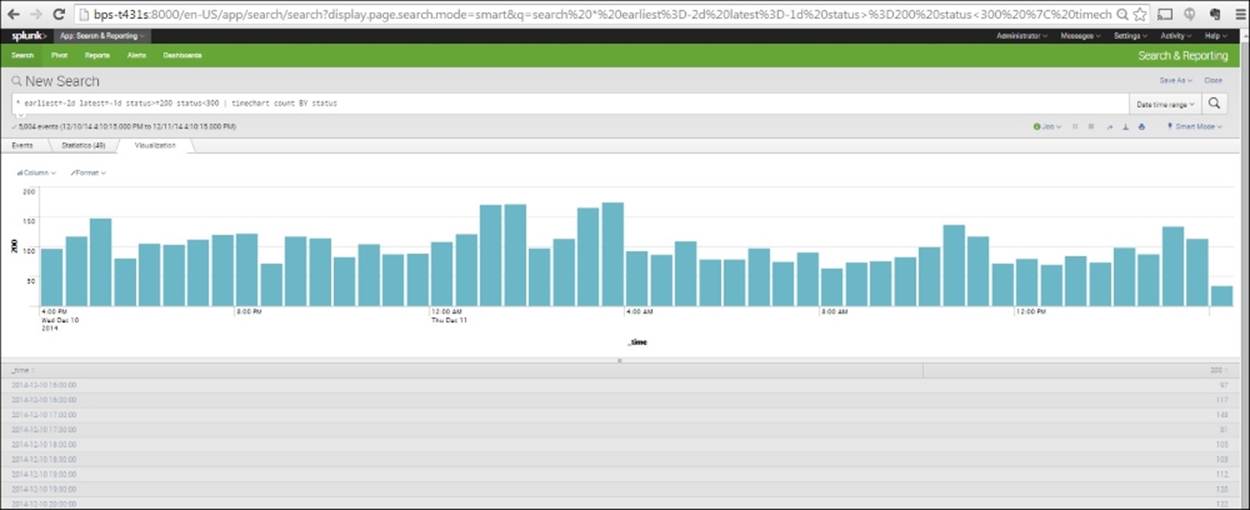
Checking the IP status
You might wish to test and see how successful your website traffic is. This can be done by looking at status codes. Successful status can be defined in various ways, but here it is defined as being coded from greater or equal to 200 to less than 300. You can use the following code:
* earliest=-2d latest=-1d status>=200 status<300 | timechart count BY status
The code indicates to include all events from 2 days ago to 1 day ago that have a status greater than 200 and less than 300, and create a chart showing hours by status. The timechart defaults to hours, given the setting of one day's time.
The table produced looks like the following screenshot:

Timechart of Counts of Status of Events in the Last Day, Ranging from >= 200 to <300
You can easily turn this into a column chart by clicking the Visualizations tab and selecting Column. Likewise, you could turn it into many other types of charts. If you use a column chart and don't need a legend (since there is only one color bar), you can get rid of the legend by selecting Format, Legend, None:
Column Chart Showing Counts of Status of Events in the Last Day, Ranging from >= 200 to <300
Looking at geographic data
Now let's look at some geographic data. Geographic data helps business analysts know where their business is coming from. Splunk has some built-in commands – iplocation and geostats – that will help us find and analyze geographic data. We will learn about these commands in the following sections.
Using the iplocation command
The iplocation command extracts geographic locations from a third-party dataset to help the Splunk user easily obtain geographic values for a client IP or Internet protocol address (the clientip field). The iplocation command, by default, returns the Country, City,Region, lat (latitude), and lon (longitude) fields associated with each event. In the following code snippet, we have used the buttercupgames data (used in earlier chapters) and created a table of the top 15 countries with the greatest counts:
buttercupgames | iplocation clientip | top limit=15 Country
As you can see here, Splunk gives both the counts and the percentages in its output:
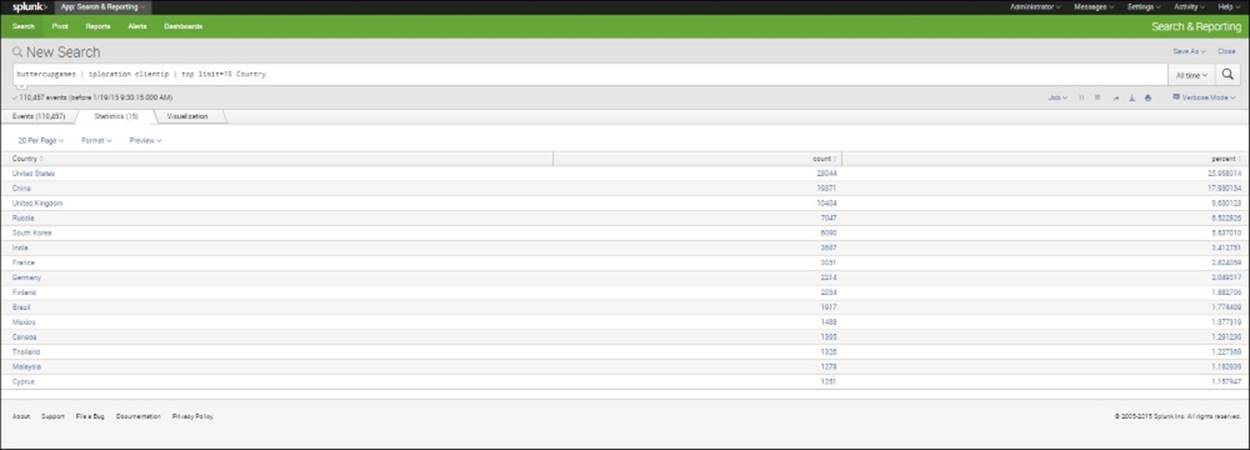
Top 15 Countries in Terms of Counts of IP Addresses
We can do the same type of analysis to create a table of the five most common cities that appear in our data, using the following code:
buttercupgames | iplocation clientip | top limit=5 City
And we get the following result:

Top 15 Cities in Terms of Counts of IP Addresses
Interestingly, you will notice that in this list the top geographic entity has no name. This is because it represents a group of all the clientip values that were not matched with a city.
Using the geostats command
Another useful tool for analyzing data geographically is the geostats command. This command allows us to easily take the lat and lon fields created by the iplocation command (and based on the clientip), and uses these to cluster the counts geographically and map them.
The code is simple:
buttercupgames | iplocation clientip | geostats count
And our results help us to quickly visualize the locations from which our data is coming:
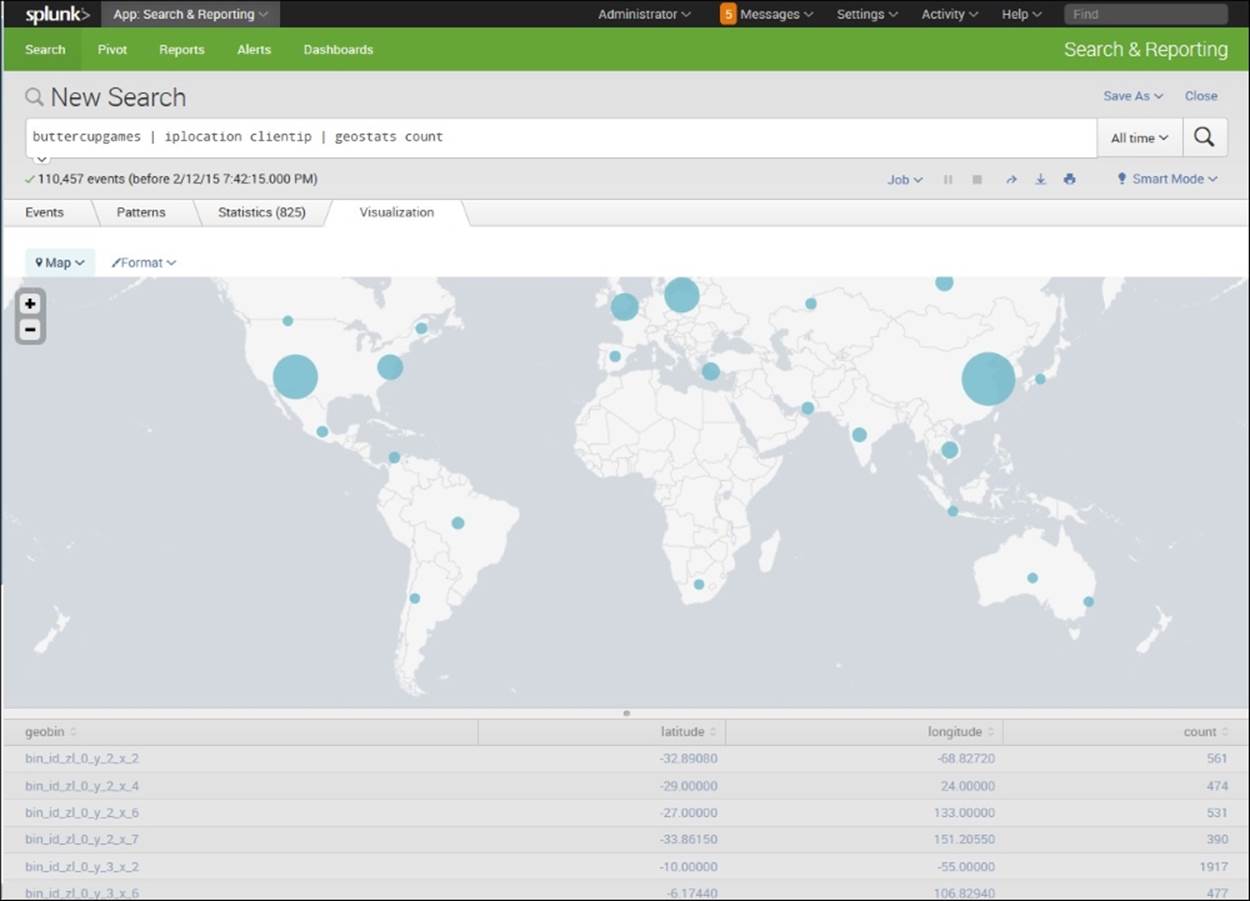
Mapped Locations for Counts of Client IP Addresses
In the map shown here, you can see that longitude and latitude data has been used to cluster the events into the geobins listed on the left. The counts and percentages falling into each of these geobins is shown, and the size of the bubbles indicate the relative counts in each geobin.
We can also search by using the field Region, using the following code:
buttercupgames | iplocation clientip | geostats count BY Region
The result will be as shown in the following screenshot:

Mapped Counts of Client IP Addresses by Region
Notice that in this screenshot, the counts of the clientip addresses coming from different regions have been mapped. However, due to the built-in defaults for the geostats command, large numbers coming from the Southwest area of the United States have been grouped together in a colored pie chart. When you mouseover the chart, you see the counts from California, Colorado, Other, Texas, and Value. You can zoom in and out on the map using the + and - signs on the left. When you do this, you can see bubbles representing California, Colorado, and Texas.
But you may be asking, what do the Other and Value labels mean? The Other category represents those client ip addresses that are associated with a count that is less than the default globallimit, which is 10. If you add the code globallimit=0, you will be able to see the mapped locations of all the client ip addresses, regardless of how many share each location. Value is used to represent those locations for which lat (latitude) and lon (longitude) cannot be determined. So, we can get rid of the Other category, but still have many in the "Value" category, when we use the following code:
buttercupgames | iplocation clientip | geostats count BY Region globallimit=0
The resulting map shows this change when we zoom in on the region:
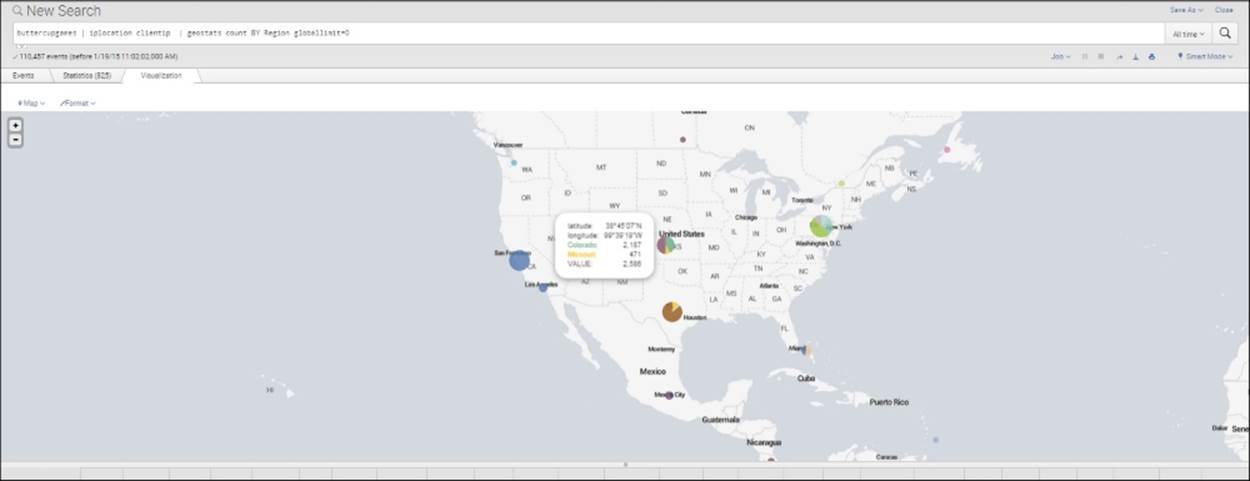
Results of Zooming In
Notice how the clustering algorithm used this time has grouped Colorado with Missouri. No Other category is found, but the Value label still applies to a large number of events.
Performing alerts in Splunk
Alerts are ways that business people, workers, managers, and others can receive notifications about something that they need to know has happened, or about something that is likely to happen soon. The usefulness of alerts in this age of machine data cannot be overstated; the amount of information out there is growing rapidly and it is important that it be monitored, and done so using automatic controls. It is beyond human capability to check large data streams, given the speed and volume at which it comes in. Furthermore, problems also need to be caught early. Fortunately, automatic alerts provide a solution.
Once an alert is set, there are various ways to convey alert information. Alerts can be set to send a message or e-mail, set off an alarm, run a script, produce an ad-hoc report, or take any number of other actions that can help to let people know something they need to become aware of.
Note
The alert feature will be accessible only to those with a full enterprise system.
Types of alerts
There are three basic types of alerts in Splunk. These are listed and described as follows:
1. Per result alert: This type of alert takes place when a trigger condition is met. So, for example, if a trigger is set to indicate when a product's sales have dropped below 70 percent of their average normal sales for a particular season, an alert like this would notify sales managers that there may be a problem.
2. Scheduled alert: A scheduled alert is set to occur on a schedule, set to notify according to set intervals, if a condition is met.
3. Rolling-window alert: This type of alert takes place if, within a rolling time window, an action or set of actions occurs. Such an alert can be particularly useful for fraud protection; for instance, actions such as large expenses charged in a short period of time can set off such alerts, allowing information about the problem to be shared quickly with those who need to know.
Setting an alert
Here we are going to set an alert based on a saved search. The search we will use is the number of products sold in the last week. First, let's create the search using the following code:
1. Type the following code in the search bar:
2. sourcetype=access_* earliest=-7d@d latest=now action="purchase"
| stats count(eval(action="purchase")) AS "Total Products Sold Last Week"
3. Now let's go on to create an alert.
4. In the right-hand corner, you will see a Save As icon. Click it and you will see a menu like the following screenshot:

Saving an Alert
5. Click on Alert.
6. In the screen that appears, select a name for your alert. Here we type Last Week Purchases Alert, but any descriptive name would work.
7. Choose Scheduled for the Alert type.
8. In the Time Range area, set your alert to Run every week (note that you could also choose other time periods), and then, in the boxes below, select the day and time you'd like to run it each week.
9. In the Trigger area, notice that you can choose a number of Trigger characteristics. Here, the ones chosen include Number of results (could also have chosen Number of Hosts, Number of Sources, or Custom), and is less than (could also have chosen other similar options) and a number (in this case 300). This alert is being set up to let management know when purchases during a given week drop below 300.
10. Then click Next.

Save as Alert screen
11. You will see a box asking you what type of action to trigger. Here you can choose from several options, as shown in the following screenshot:
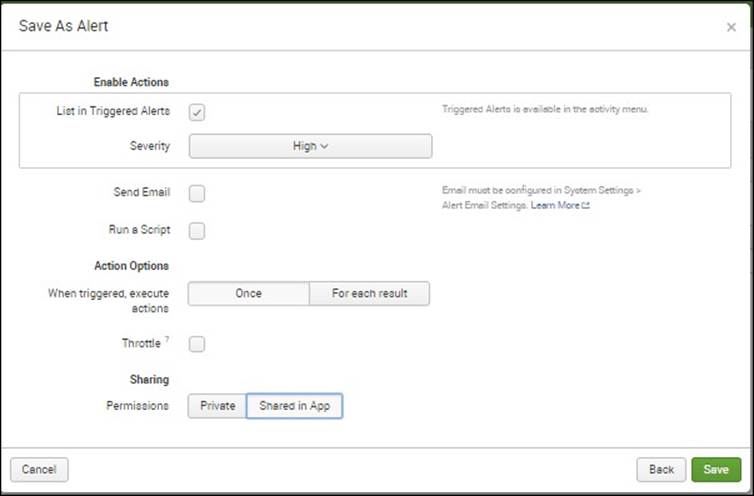
Save as Alert screen showing other options
12. Select List in Triggered Alerts, and, under Severity, High. Notice that you could also send an e-mail or run a script. If you choose to run a script, you could design it to take actions like shutting down the system, disallowing any more attempts at user log in, and other steps. Running a script is often used to curtail further access or to prevent problems until the system is fixed.
13. Click under When triggered | execute action | Once.
14. Notice that there is an option to Throttle. If you check the Throttle box, an area opens that asks you how long after executing actions to suppress alerts for. You can choose a number and a period of time (seconds, minutes, hours, or days). Throttling prevents the announcement of more alerts until a specified time after the first alert is issued. When you set a time for throttling, it needs to be based on the specifics involved. You wouldn't want to set it so that a crucial alert would be prevented, but you also don't need to see every alert go off once you know there is a problem. There is a fine balance to strike in order to set the throttling for the right amount of time. Here, however, we are not concerned about throttling and leave the box unchecked.
15. Finally, you choose whether to share the alert or not, and who to share it with. In the box you see here, select Shared in App.
16. Click Save.
Managing alerts
Alerts are managed within the Alert Manager, where you can choose to search, filter, or view the alerts according to the application (indicated by the This App's button), the severity of the alert, and the alert itself. You can also delete alerts. To view the results of the alert we just created, take the following steps:
1. From the Search Menu, click on Alerts.
2. If you have created an alert as indicated previously, you should see something like the following screenshot:

List of Alerts
3. Notice that you can select the All, Yours, or This App's buttons, and that you can filter the alerts by typing in a word or phrase.
4. You could edit the alert from here. Click the app you want to select, then Edit, and you can see the options of choosing various ways you can edit the alert, clone it, or delete it:

Edit the Alert
5. We have only one alert to show here, but we can go ahead and click it and see the results:

6. Notice that there have been no fired events for this alert, meaning that so far the purchases in the week have been greater than or equal to 300.
Another example of an alert
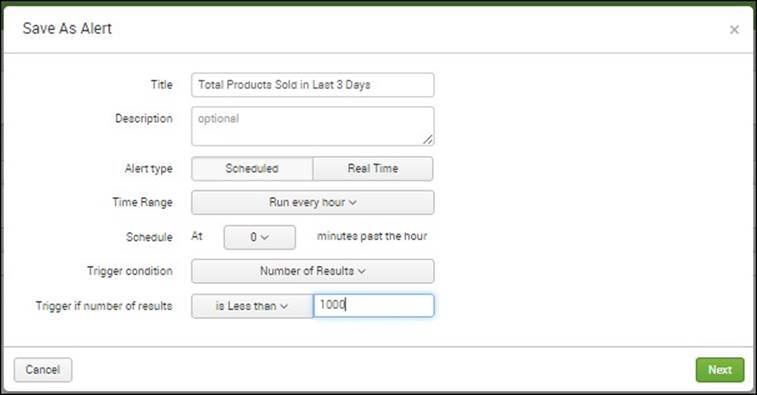
We'll do another example of an alert so that you can see what happens when an alert is triggered. This time, we will use the following search code:
sourcetype=access_* earliest=-3d latest=now action="purchase"
| stats count(eval(action="purchase")) AS "Total Products Sold in last 3 days"
The criteria we use are as follows:
· Title: Total Products Sold in Last 3 Days
· Alert Type: Scheduled
· Time Range: Run every hour
· Schedule: At 0 minutes past the hour
· Trigger Condition: Number of Results
· Trigger if number of results: is Less than, 1000
The criteria for the alert are specified as shown in the following screenshot:
Alert for Total Products Sold in Last 3 Days
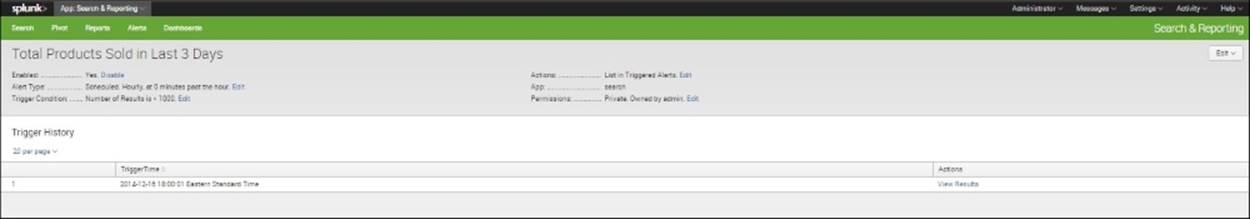
When we click on the Alert we created, we can see that the alert has been triggered. We can attain information on the time, type, condition, and actions of the alert, as well as the app associated with it (which, in this case, is the search app). Permissions are also shown, and private is indicated here:
Information from Triggered Alert
Summary
In this chapter, we learned how to use Splunk to monitor our data and to create alerts to let us quickly learn about any issues or foreseeable trends in the data. We have also learned about the different kinds of alerts, as well as about how to create settings so that the alerts will be useful for the different ways we can use them.
This brings our book to a conclusion, but please be aware that there is still a lot to learn about this useful software. We encourage you to delve deeper into the many ways you can use Splunk to learn more about your organizational and operational data, and to make your work more efficient and accurate. We suggest going to www.splunk.com and selecting Resources to see where you can get tutorials, videos, and information on apps, as well as learn many other ways you can build on your basic knowledge of Splunk. Happy Splunking!
All materials on the site are licensed Creative Commons Attribution-Sharealike 3.0 Unported CC BY-SA 3.0 & GNU Free Documentation License (GFDL)
If you are the copyright holder of any material contained on our site and intend to remove it, please contact our site administrator for approval.
© 2016-2026 All site design rights belong to S.Y.A.