HP Vertica Essentials (2014)
Chapter 3. Monitoring Vertica
Monitoring is one of the key database administration tasks. It allows you to find possible bottlenecks in database performance in the most pragmatic fashion. In Vertica, there are several sources of information through which monitoring can be performed. They are as follows:
· System tables
· Logfiles
· Management Console (Enterprise Edition only)
Monitoring through the system tables
Vertica stores most of its information about the various states of the database in system tables. The process of storing such information is completely automatic and runs in the background. By querying these system tables and by relating various types of information fetched from these tables, you can efficiently monitor Vertica. The advantage of using system tables is that we can use them, just like any other user table, to perform aggregation, analytics, and so on. There are more than 100 system tables; we can get the whole list by running the following query:
Select * from system_tables;
The table shown in the following screenshot shows the output of the query:
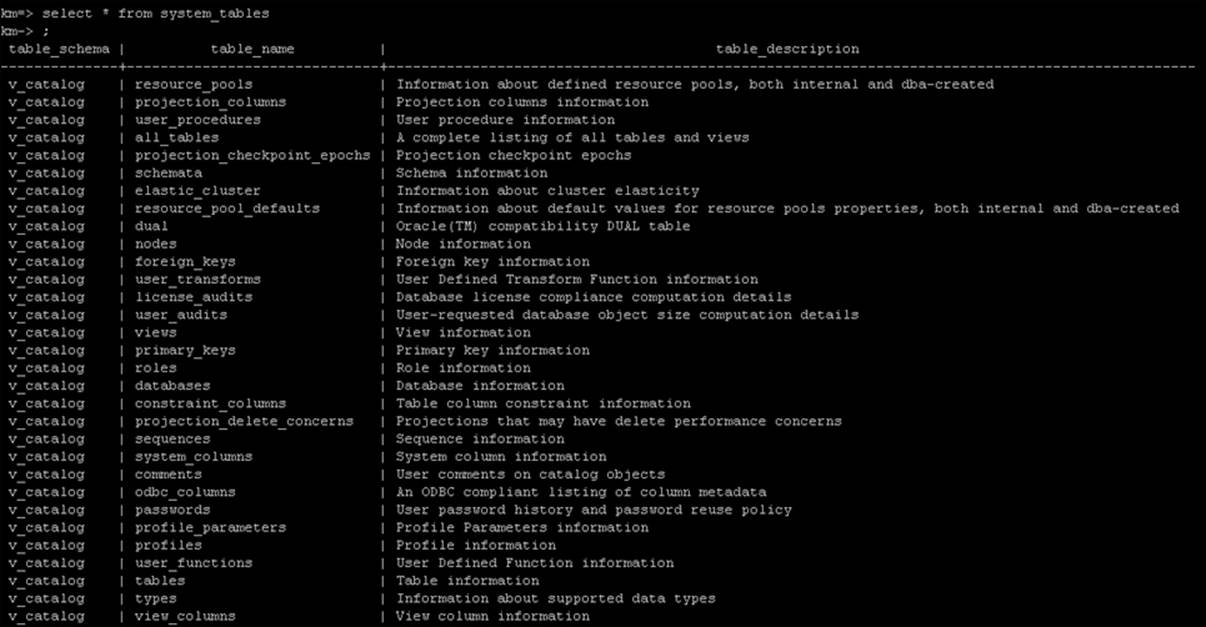
The system_tables table
On the basis of the type of information a system table stores, system tables can be grouped into the following categories:
· System information
· System resources
· Background processes
· Workload and performance
System tables are clustered into the following schemas (as shown in the preceding screenshot):
· V_CATALOG: This schema contains information about persistent objects in the catalog
· V_MONITOR: This schema contains information about the temporary system state
Examples of V_CATALOG tables include views, roles, nodes, databases, license_audits, and so on, while examples of V_MONITOR tables include locks, disk_storage, resource_usage, and so on.
We do not need to specify a schema (V_CATALOG or V_MONITOR) for querying system tables as they belong to the default schema. It should be noted that there are certain restrictions imposed on system tables; they are as follows:
1. Vertica provides a SQL-monitoring API that can be used on these system tables, but the database will not connect through this API if the Vertica cluster is in a recovering state.
2. Due to the nature of the data stored in these tables, it is not possible to perform Data Definition Language (DDL) and Data Manipulation Language (DML) operations on system tables.
Understanding a system table example
For example, we just need to run the following command to retrieve all the information from the tables of a database:
select * from tables;
The following screenshot shows the output of the command. Please note that in the table_schema and table_name tables, the columns are case sensitive.
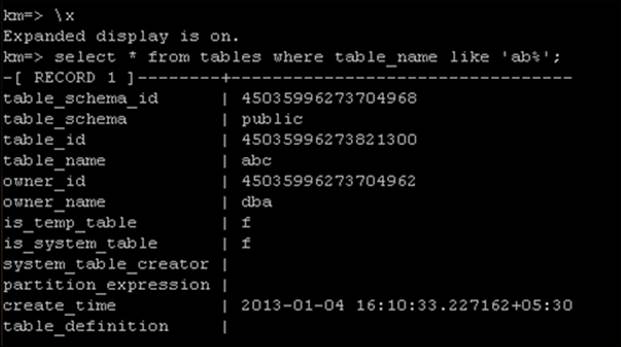
The tables system table
Looking at events
There are various events such as Emergency, Alerts, Critical, Errors, Warnings, Notices, Information, and Debugs that are logged by Vertica. Vertica logs these events in one of the following ways:
· In the Vertica.log file
· In the ACTIVE_EVENTS system table
· Using SNMP
· Using Syslog
This book will cover the usage of the Vertial.log files and the ACTIVE_EVENTS system table for logging events.
The following table lists the events that are logged:
|
Event name |
Event type |
Description |
|
Low Disk Space |
0 |
This event is logged either when there is not enough space in the physical disk or when there is a hardware issue. |
|
Read Only File System |
1 |
Vertica uses specific directories for storing Catalog or Data information. When Vertica is unable to create or write to files, this event is logged. Changing access rights may solve the issue. |
|
Loss Of K Safety |
2 |
Vertica defines the minimum number of nodes needed to run a database, particularly in the K-Safe mode. For example, for maintaining K-safety of level 2, we need at least five nodes; if the number of active nodes goes below five, this event will be logged. It should be ensured that all nodes are able to reach each other in the cluster. |
|
Current Fault Tolerance at Critical Level |
3 |
As discussed earlier, if a database loses K-safety, it shuts down, and this event is logged. |
|
Too Many ROS Containers |
4 |
This may occur due to many reasons, primarily if there are a large number of local segments or if Mergeout is not working efficiently. It is suggested that you stop the data load in such events, and the database should be allowed to recover. |
|
Node State Change |
6 |
This event occurs when the node state has changed. For example, a node can change its state from startup to up. |
|
Recovery Failure |
7 |
This event occurs when a database is not able to recover properly from a nonfunctional state. |
|
Recovery Error |
8 |
If the number of recovery errors exceeds the value of Max Tries defined in the vbr.py configuration file, this event is triggered. |
|
Recovery Lock Error |
9 |
This event is logged when a recovering node is not able to secure lock on tables. |
|
Recovery Projection Retrieval Error |
10 |
This event is logged when Vertica is unable to retrieve information about a projection. |
|
Refresh Error |
11 |
This event is logged when a database is not able to refresh itself. |
|
Refresh Lock Error |
12 |
This event is logged when a database is not able to obtain the necessary locks during refresh. |
|
Tuple Mover Error |
13 |
This event is logged when a database fails to move data from RAM (WOS) to physical disk (ROS or Read Optimized Store). |
|
Timer Service Task Error |
14 |
This event is logged when an error occurs in an internal scheduled task. |
|
Stale Checkpoint |
15 |
This event occurs when Write Optimized Store (WOS) data is not completely flushed into the Read Optimized Store (ROS) containers before shutdown. This may result in loss of data. |
Looking at events through logfiles
During database startup, Vertica writes logs to the dblog file. This file resides in the catalog-path/<database-name>/ directory path. For any information regarding the starting of data, in case of a failure or success, it is advisable to look into the dblog file. The following is the sample text of a dblog file:
Connected to spread at host 192.168.56.101(192.168.56.101) port 4803
[Thu 07 Mar 2013 16:41:49] SP_connect: DEBUG: Auth list is: NULL
Connected to spread at host 192.168.56.101(192.168.56.101) port 4803
After the database is up and running properly, Vertica starts writing logs to vertica.log. Just like the dblog file, the vertica.log file is also maintained on each node of the cluster. It resides in the catalog-path/<database-name>/<node-name_catalog> directory path. Thefollowing is a sample text:
2013-01-05 04:03:07.225 Main:0x1124df70 [Init] <INFO> Starting up Vertica Analytic Database v6.0.0-1
2013-01-05 04:03:07.225 Main:0x1124df70 [Init] <INFO> Project Codename: BunkerHill
2013-01-05 04:03:07.225 Main:0x1124df70 [Init] <INFO> vertica(v6.0.0-1) built by release@build2.verticacorp.com from releases/VER_6_0_RELEASE_BUILD_0_1_20120611@95490 on 'Mon Jun 11 10:40:47 2012' $BuildId$
2013-01-05 04:03:07.225 Main:0x1124df70 [Init] <INFO> 64-bit Optimized Build
2013-01-05 04:03:07.225 Main:0x1124df70 [Init] <INFO> Compiler Version: 4.1.2 20080704 (Red Hat 4.1.2-52)
2013-01-05 04:03:07.225 Main:0x1124df70 <LOG> @v_km_node0001: 00000/5081: Total swap memory used: 94208
Looking at events through the ACTIVE_EVENTS system table
The ACTIVE_EVENTS system table can be used to look at various events logged by Vertica. The following table describes the various fields of the ACTIVE_EVENTS system table:
|
Column |
Description |
|
node_name |
Internal name of the node |
|
event_code |
ID of the event type |
|
event_posted_timestamp |
Timestamp when the event was initiated |
|
event_expiration |
Timestamp when the event expired |
|
event_code_description |
Description of the event type |
|
event_problem_description |
Actual description of the event |
|
reporting_node |
Internal name of the node on which the event occurred |
The following screenshot shows the sample output when we query the ACTIVE_EVENTS system table:
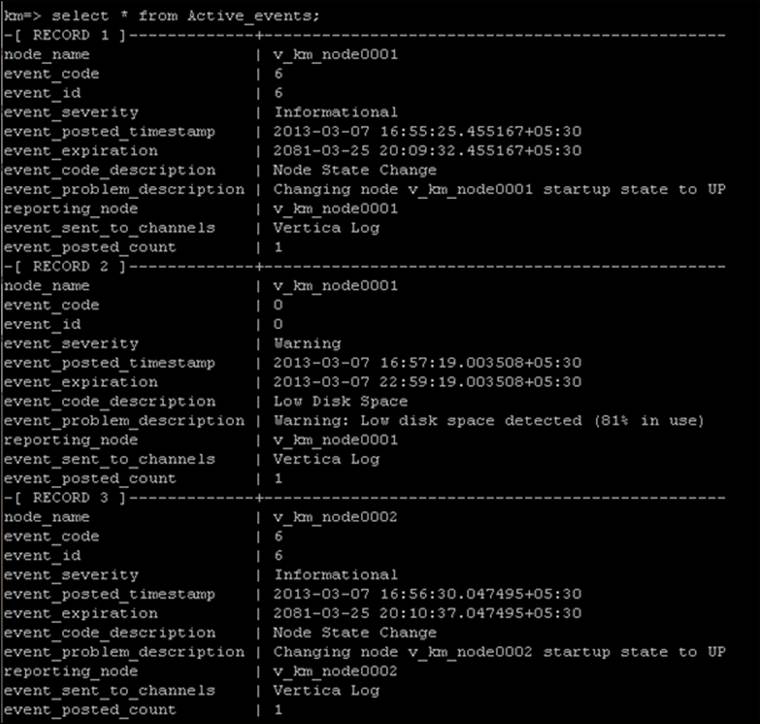
The ACTIVE_EVENTS system table
Monitoring Vertica through the Management Console
Vertica provides a very intuitive web console that can be installed and integrated with Vertica. Vertica Management Console is shipped only with the Enterprise Edition. It can help you perform almost every administration task that is possible through a command-based console.
Management Console runs only on browsers that support HTML5. By default, it is hosted on port 5450, which can be changed. To access it, we can just enter https://xx.xx.xx.xx:5450/webui, where xx.xx.xx.xx is the IP of the host on which the Management Console is hosted. It will prompt for a username and password; we can supply any credentials of any user who has admin rights. It is not advised to install Management Console on data-hosting nodes.
Retaining monitoring information
As discussed earlier, system tables provide a plethora of information regarding various processes running on a database, including queries. However, sometimes we need to store monitoring information. For this, we can employ Data Collector. Information retained by Data Collector is stored on a disk in the DataCollector directory under the Vertica catalog path.
Enabling and disabling Data Collector
To enable or disable Data Collector, we can use the SET_CONFIG_PARAMETER() function. Data Collector is on by default. To disable Data Collector, use the following command:
=> SELECT SET_CONFIG_PARAMETER('EnableDataCollector', '0');
Use the following command to enable Data Collector:
=> SELECT SET_CONFIG_PARAMETER('EnableDataCollector', '1');
Viewing the current data retention policy
To view the data retention policy, we can use the GET_DATA_COLLECTOR_POLICY() function. We can replace the component variable with the actual component name, as shown in the following line of code:
GET_DATA_COLLECTOR_POLICY( 'component' );
To get the whole list of components, we can query the V_MONITOR.DATA_COLLECTOR system table. In addition to the list, we will also get their current retention policies and statistics about how much data is retained.
Configuring data retention policies
We can set Data Collector policies using the SET_DATA_COLLECTOR_POLICY() function. Only a superuser can modify policies. This function, shown in the following line of code, allows us to change how much memory (in kb) and disk space (in kb) to retain for each component on all nodes:
SET_DATA_COLLECTOR_POLICY('component', 'memoryKB', 'diskKB')
Failed nodes are not ignored from the policy, as they will create policy anomalies in the cluster. Hence, when failed nodes rejoin, the latest policy is imposed on them.
Monitoring data collection components
As discussed earlier, when the DATA_COLLECTOR system table is queried, we are presented with a list of Data Collector components, their current retention policies, and statistics about how much data is retained and how much has been discarded. DATA_COLLECTOR also calculates the approximate collection rate to aid in sizing calculations. The following is a simple query that returns all the columns in this system table:
km=> \x
Expanded display is on.
km=> SELECT * FROM data_collector;
-[ RECORD 1 ]----------+-------------------------------------------------------------------------------------------------------------------
node_name | v_km_node0001
component | AllocationPoolStatistics
table_name | dc_allocation_pool_statistics
description | Information about global memory pools, which generally cannot be recovered without restart
access_restricted | t
in_db_log | f
in_vertica_log | f
memory_buffer_size_kb | 64
disk_size_kb | 256
record_too_big_errors | 0
lost_buffers | 0
lost_records | 0
retired_files | 64
retired_records | 29674
current_memory_records | 0
current_disk_records | 1786
current_memory_bytes | 0
current_disk_bytes | 251826
first_time | 2013-03-08 16:00:40.002042+05:30
last_time | 2013-03-08 16:15:32.001259+05:30
kb_per_day | 23813.3539369616
-[ RECORD 2 ]----------+-------------------------------------------------------------------------------------------------------------------
node_name | v_km_node0001
component | AllocationPoolStatisticsBySecond
table_name | dc_allocation_pool_statistics_by_second
description | Information about global memory pools, which generally cannot be recovered without restart (historical, by second)
access_restricted | t
in_db_log | f
in_vertica_log | f
memory_buffer_size_kb | 64
disk_size_kb | 256
record_too_big_errors | 0
lost_buffers | 0
lost_records | 0
retired_files | 292
retired_records | 29777
current_memory_records | 0
current_disk_records | 343
current_memory_bytes | 0
current_disk_bytes | 219173
first_time | 2013-03-08 16:12:41.002868+05:30
last_time | 2013-03-08 16:15:32.001287+05:30
kb_per_day | 107977.851408599
Summary
Vertica provides several ways to monitor various processes and facilitates the storage of the monitoring information. It is up to the administrator to determine how they can make the best use of it. In the next chapter, we will learn how to create a backup of Vertica databases and restore them.
All materials on the site are licensed Creative Commons Attribution-Sharealike 3.0 Unported CC BY-SA 3.0 & GNU Free Documentation License (GFDL)
If you are the copyright holder of any material contained on our site and intend to remove it, please contact our site administrator for approval.
© 2016-2026 All site design rights belong to S.Y.A.