Biologically Inspired Computer Vision (2015)
Part I
Fundamentals
Chapter 4
Modeling Natural Image Statistics
Holly E. Gerhard, Lucas Theis and Matthias Bethge
4.1 Introduction
Natural images possess complex statistical regularities induced by nonlinear interactions of objects (e.g., occlusions). Developing probabilistic models of these statistics offers a powerful means both to understanding biological vision and to designing successful computer vision applications. A long-standing hypothesis about biological sensory processing states that neural systems try to represent inputs as efficiently as possible by adapting to environmental regularities. With natural image models, it is possible to test specific predictions of this hypothesis and thereby reveal insights into biological mechanisms of sensory processing and learning. In computer vision, natural image models can be applied to a variety of problems from image restoration to higher-level classification tasks.
The chapter is divided into four major sections. First, we introduce some statistical qualities of natural images and discuss why it is interesting to model them. Second, we describe several models including the state of the art. Third, we discuss examples of how natural image models impact computer vision applications. And fourth, we discuss experimental examples of how biological systems are adapted to natural images.
4.2 Why Model Natural Images?
This chapter focuses on models of the spatial structure in natural images, that is, the content of static images as opposed to sequences of images. We will primarily focus on luminance as it carries a great deal of the structural variations in images and is a reasonable starting place for developing image models. In Figure 4.1, we analyze a single photographic image to illustrate some basic statistical properties of natural images. Photographic images tend to contain objects, an important cause for much of these properties. Because objects tend to have smoothly varying surfaces, nearby regions in images also tend to appear similar. As illustrated in Figure 4.1, natural images therefore contain not only local pairwise correlations between pixel intensities (Figure 4.1b), but also long-range pairwise correlations (Figure 4.1c) and higher-order regularities as well (Figure 4.1d). The interested reader can also refer to Simoncelli and Olshausen 1 for a more detailed, yet accessible introduction to image measurements revealing higher-order regularities in natural images.
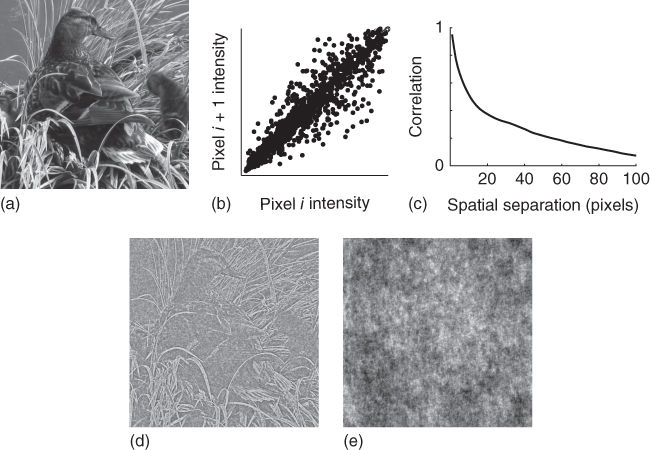
Figure 4.1 Natural images are highly structured. Here we show an analysis of a single image (a). The pairwise correlations in intensity between neighboring pixels are illustrated by the scatterplot (![]() = 0.95) in (b). Pairwise correlations extend well beyond neighboring pixels as shown by the autocorrelation function of the image in (c). We also show a whitened version of the image (d) and a phase scrambled version (e). Whitening removes pairwise correlations and preserves higher-order regularities, whereas Fourier phase scrambling has the opposite effect. Comparing the whitened and phase-scrambled images reveals that the higher-order regularities carry much of the perceptually meaningful structure. Second-order correlations can be modeled by a Gaussian distribution. The probabilistic models we will discuss are aimed at describing the higher-order statistical regularities and can be thought of as generalizations of the Gaussian distribution.
= 0.95) in (b). Pairwise correlations extend well beyond neighboring pixels as shown by the autocorrelation function of the image in (c). We also show a whitened version of the image (d) and a phase scrambled version (e). Whitening removes pairwise correlations and preserves higher-order regularities, whereas Fourier phase scrambling has the opposite effect. Comparing the whitened and phase-scrambled images reveals that the higher-order regularities carry much of the perceptually meaningful structure. Second-order correlations can be modeled by a Gaussian distribution. The probabilistic models we will discuss are aimed at describing the higher-order statistical regularities and can be thought of as generalizations of the Gaussian distribution.
One can consider each photographic image as a point in a high-dimensional space where dimensions correspond to individual pixel values. If one were to analyze a large ensemble of photographic images and plot each in this space, it would become clear that they do not fill the space uniformly but instead represent only a small portion of the space of possible images, precisely because natural images contain statistical regularities. The goal of a probabilistic image model is to distribute probability mass throughout this space to best account for the true distribution's shape. The challenge lies in capturing the complex statistical properties of images, which, as we will describe in Section 4.3, requires sophisticated machine learning techniques.
In Section 4.3, we will discuss several important approaches to tackling this challenge, but first we ask: why is modeling natural images important, and what is it good for? We will argue that it not only informs our understanding of the physical world but also our understanding of biological systems and can lead to improved computer vision algorithms.
A primary reason probabilistic natural image models are so powerful is prediction. If one had access to the full distribution of natural images, one would, practical considerations aside, also have access to any conditional distribution and would be able to optimally predict the content of one image region given any other region. If the model also included time, one could additionally predict how an image will change over time. Being able to anticipate the structure of the external environment is clearly advantageous in a variety of scenarios. Intriguingly, many similarities have been found between representations used by the brain and the internal representations used by successful image models. Examples of such similarities will be discussed as we present various models in Section 4.3. In computer vision, natural image models have been directly applied to prediction problems such as denoising and filling-in (described in Section 4.4).
Historically, much of the inspiration for modeling environmental statistics stems from the efficient coding hypothesis put forward by Barlow [2] and Attneave [3], which states that biological systems try to represent information as efficiently as possible in a coding theoretic sense, that is, using as few bits as possible. Knowledge of the distribution of natural images can be used to construct a representation which is efficient in precisely this sense. We will present examples of experimental links made between natural image statistics and biological vision in Section 4.5.
Probabilistic image models have also been used to learn image representations for various classification tasks [4, 5]. Modeling natural images has great potential for enhancing object recognition performance as there is a deep relationship between objects and correlations of image features, and it also provides a principled route to exploiting unlabeled data (discussed in Section 4.4).
Before proceeding, we note that many kinds of natural scene statistics, forexample, those related to color, depth, or object contours, are also active areas of research. The interested reader can consult [1, 6] for references to foundational work in those areas.
4.3 Natural Image Models
A wide spectrum of approaches to modeling the density of natural images has been proposed in the last two decades. Many have been designed to examine how biological systems adapt to environmental statistics, where the logic is to compare neural response properties to emergent aspects of the models after fitting to natural images. Similarities between the two are interpreted as indirect evidence that the neural representation is adapted to the image statistics captured by the model. This tradition stems from the efficient coding hypothesis [2, 3], which was originally formulated in terms of redundancy reduction. Intuitively, if an organism's nervous system has knowledge of the redundancies present in the sensory input, its neural representations can adapt to remove those redundancies and emphasize the interesting content of sensory signals.
Redundancy can be defined formally as the multi-information of a random vector ![]() ,
,
4.1![]()
where ![]() denotes (differential) entropy. The differential entropy in turn is defined as
denotes (differential) entropy. The differential entropy in turn is defined as
4.2![]()
where ![]() denotes the probability density at
denotes the probability density at ![]() . Intuitively speaking, the entropy measures the spread of a distribution. If all of the variables
. Intuitively speaking, the entropy measures the spread of a distribution. If all of the variables ![]() were independent of each other, the first term on the right-hand side of Eq. 4.1 would correspond to the entropy of the distribution over
were independent of each other, the first term on the right-hand side of Eq. 4.1 would correspond to the entropy of the distribution over ![]() , that is,
, that is, ![]() , the second term. The distribution of
, the second term. The distribution of ![]() would thus have zero multi-information, that is, no redundancies. This means that multi-information can be seen as measuring how much more concentrated the joint distribution is compared to a factorial (i.e., independent) version of it. This is visualized for two variables in Figure 4.2.
would thus have zero multi-information, that is, no redundancies. This means that multi-information can be seen as measuring how much more concentrated the joint distribution is compared to a factorial (i.e., independent) version of it. This is visualized for two variables in Figure 4.2.
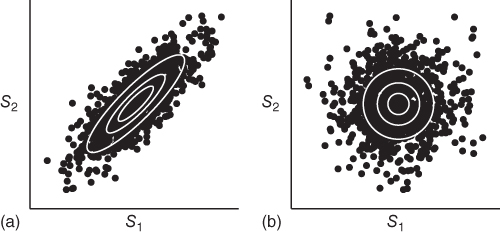
Figure 4.2 To illustrate how multi-information is measured as a proxy for how redundant a distribution is, we show an example joint distribution ![]() , visualized in (a) and its factorial form,
, visualized in (a) and its factorial form, ![]() , visualized in (b), that is, where the two variables are independent of each other. Multi-information is the difference between the joint distributions's entropy
, visualized in (b), that is, where the two variables are independent of each other. Multi-information is the difference between the joint distributions's entropy ![]() (corresponding to (a)) and the factorial form's entropy
(corresponding to (a)) and the factorial form's entropy ![]() (corresponding to (b)). Intuitively speaking, multi-information measures the difference of the spread of the two distributions. The illustrated joint distribution therefore has a relatively high degree of multi-information, meaning that it is highly redundant.
(corresponding to (b)). Intuitively speaking, multi-information measures the difference of the spread of the two distributions. The illustrated joint distribution therefore has a relatively high degree of multi-information, meaning that it is highly redundant.
The pixel values of natural images are highly redundant (e.g., Figure 4.1). To motivate the usefulness of redundancy reduction, imagine a world with white ![]() images each containing just a single black disk positioned at a random location and a random diameter
images each containing just a single black disk positioned at a random location and a random diameter ![]() . It is clearly much more efficient to describe the image in terms of the object's position and diameter – which can be achieved with
. It is clearly much more efficient to describe the image in terms of the object's position and diameter – which can be achieved with ![]() bits – than to describe the binary value of all
bits – than to describe the binary value of all ![]() pixels independently, which would require
pixels independently, which would require ![]() bits. Finally, we note that knowledge of the full probability distribution of images can be used to compute a representation in the form of a transformation such that all components become independent [7]. In other words, a system with perfect knowledge of the input distribution could remove all redundancies from the input. However, the resulting representation is not unique, that is, for a given distribution, there are many transformations which lead to an independent representation. Reducing multi-information is thus not sufficient for deriving a representation, but it may nevertheless be used to guide and constrain representations.
bits. Finally, we note that knowledge of the full probability distribution of images can be used to compute a representation in the form of a transformation such that all components become independent [7]. In other words, a system with perfect knowledge of the input distribution could remove all redundancies from the input. However, the resulting representation is not unique, that is, for a given distribution, there are many transformations which lead to an independent representation. Reducing multi-information is thus not sufficient for deriving a representation, but it may nevertheless be used to guide and constrain representations.
An elegant early examination of the second-order correlations of natural images demonstrated the potential for efficient coding theory to explain how biological vision functions. Instead of working with correlations between pixels directly, it is often convenient to work with the power spectrum of natural images, which can be computed as the Fourier transform of the autocorrelation function. Starting from the observation that the power spectrum of natural images falls off approximately as ![]() , Atick and Redlich [8] hypothesized that the goal of retinal processing is to remove this redundancy, that is, to decorrelate retinal input. They showed that previously measured contrast responses of monkey retinal ganglion cells are indeed consistent with the removal of the
, Atick and Redlich [8] hypothesized that the goal of retinal processing is to remove this redundancy, that is, to decorrelate retinal input. They showed that previously measured contrast responses of monkey retinal ganglion cells are indeed consistent with the removal of the ![]() regularity from natural input. In addition, they derived decorrelating filters which they showed could predict human psychophysical measurements of contrast sensitivity with high accuracy. (See Chapter 5 for information about psychophysical measurements.)
regularity from natural input. In addition, they derived decorrelating filters which they showed could predict human psychophysical measurements of contrast sensitivity with high accuracy. (See Chapter 5 for information about psychophysical measurements.)
One way to capture a distribution's pairwise correlations is to approximate it with a Gaussian distribution, where the covariance is set to be equal to the distribution's empirical covariance. In our review, we will discuss three main branches of approaches that extend from the Gaussian model (see Figure 4.3). Each branch adds additional modeling power by describing the higher-order correlations of natural images which are critically important for the structural or geometric shape-based content, for example, as illustrated in the whitened image in Figure 4.1(d), which highlights the higher-order correlations in the original photographic image. The Gaussian model, on the other hand, captures only as much content as is shown in the phase-scrambled image in Figure 4.1(e). Traversing down a branch in our diagram increases the degree of higher-order correlations captured by a model and hence its efficacy. On a technical note, each solid arrow points to a mathematically more general model which allows for even more types of regularities to be captured. (Dashed arrows indicate improved model efficacy but not increased generality.) For notational simplicity, we denote images by ![]() -dimensional column vectors
-dimensional column vectors ![]() where each dimension of
where each dimension of ![]() stores the intensity of a single pixel in the gray-scale image.
stores the intensity of a single pixel in the gray-scale image.
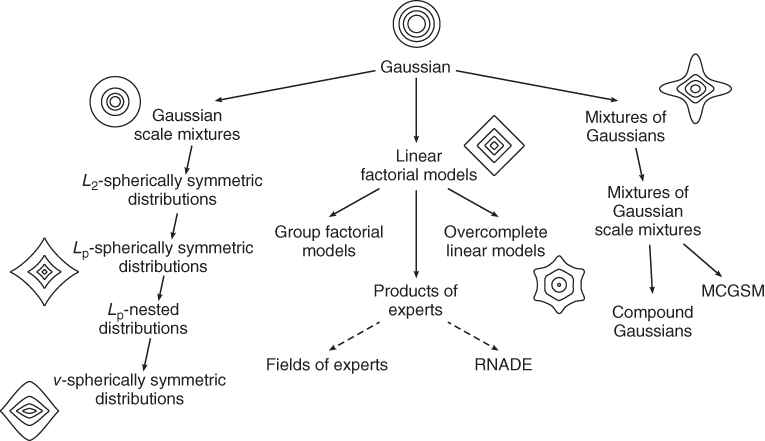
Figure 4.3 In this chapter, we review several important natural image models which we have organized into three branches of approaches, each extending the Gaussian distribution by certain higher-order regularities. Arrows with solid lines indicate a generalization of the model class.
We begin with linear factorial models. Conceptually simple yet highly influential, these models are an appropriate starting point for our review. Linear factorial models assume that an image of dimensionality ![]() is generated by a random linear superposition of
is generated by a random linear superposition of ![]() basis functions:
basis functions:
4.3![]()
where ![]() is the weight applied to the
is the weight applied to the ![]() th basis function,
th basis function, ![]() , which has the same dimensionality as the images. An example set of basis functions is shown in Figure 4.4(a) for images of size
, which has the same dimensionality as the images. An example set of basis functions is shown in Figure 4.4(a) for images of size ![]() pixels. In a linear factorial model, the
pixels. In a linear factorial model, the ![]() , often referred to as the “sources” of the image, are assumed to be independently distributed:
, often referred to as the “sources” of the image, are assumed to be independently distributed:
4.4![]()
meaning that an image's overall probability density factorizes into the sources' densities.
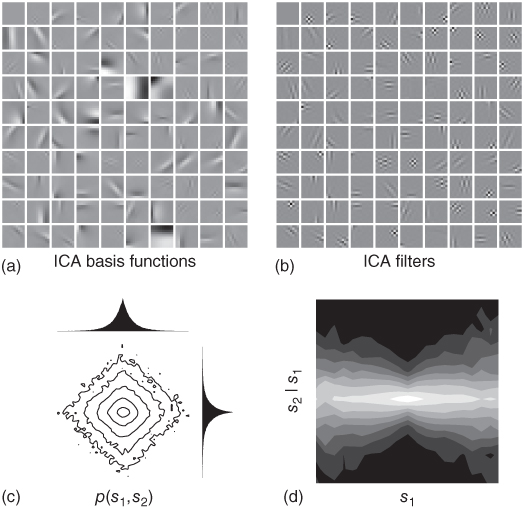
Figure 4.4 ICA filter responses are not independent for natural images. In panel a, we show a complete set of ICA basis functions (![]() ) trained on images
) trained on images ![]() pixels in size (“complete” meaning that there are as many basis functions, 100, as there are dimensions in the data). Panel b visualizes the corresponding set of filters (
pixels in size (“complete” meaning that there are as many basis functions, 100, as there are dimensions in the data). Panel b visualizes the corresponding set of filters (![]() ). The filters are oriented, bandpass, and localized – prominent features shared by the receptive fields of simple cells in the primary visual cortex. In panels c and d, we examine the filter responses or “sources” for natural images. (c) shows the joint histogram of two filter responses,
). The filters are oriented, bandpass, and localized – prominent features shared by the receptive fields of simple cells in the primary visual cortex. In panels c and d, we examine the filter responses or “sources” for natural images. (c) shows the joint histogram of two filter responses, ![]() , where
, where ![]() . The joint distribution exhibits a diamond-shaped symmetry, which is well captured by an
. The joint distribution exhibits a diamond-shaped symmetry, which is well captured by an ![]() -spherical symmetry with
-spherical symmetry with ![]() close to 1. We also show the two marginal distributions, which are heavy-tailed, sparse distributions with a high probability of zero and an elevated probability of larger nonzero values, relative to the Gaussian distribution (i.e., filter responses are typically either very small or very large). (d) The higher-order dependence of the filter responses is shown by plotting the conditional distribution
close to 1. We also show the two marginal distributions, which are heavy-tailed, sparse distributions with a high probability of zero and an elevated probability of larger nonzero values, relative to the Gaussian distribution (i.e., filter responses are typically either very small or very large). (d) The higher-order dependence of the filter responses is shown by plotting the conditional distribution ![]() for each value of
for each value of ![]() . The “bow-tie” shape of this plot reveals that the variance of
. The “bow-tie” shape of this plot reveals that the variance of ![]() depends on the value of
depends on the value of ![]() .
.
Under the assumptions of the linear factorial model, redundancies can be removed via a linear transformation ![]() with
with ![]() , which is often referred to as the filter matrix. In Figure 4.4(b), we visualize the corresponding filter matrix for the
, which is often referred to as the filter matrix. In Figure 4.4(b), we visualize the corresponding filter matrix for the ![]() pixel basis functions of Figure 4.4(a). The density of an image is also given by
pixel basis functions of Figure 4.4(a). The density of an image is also given by
4.5![]()
where ![]() denotes the
denotes the ![]() th row vector and
th row vector and ![]() the determinant of the filter matrix.
the determinant of the filter matrix.
One has several choices in how to determine the transformation ![]() . Principal component analysis (PCA) represents one way of computing a filter matrix which removes pairwise correlations but ignores higher-order correlations (i.e., a “decorrelating” transformation). This would be enough if images and hence the sources
. Principal component analysis (PCA) represents one way of computing a filter matrix which removes pairwise correlations but ignores higher-order correlations (i.e., a “decorrelating” transformation). This would be enough if images and hence the sources ![]() were Gaussian distributed. However, it is well known that even random filters, which do not respond to flat images, lead to highly non-Gaussian, kurtotic (also commonly referred to as sparse) filter responses. Two example distributions of filter responses are shown in Figure 4.4(c). These marginal distributions exhibit heavy tails and high probabilities of near-zero values.
were Gaussian distributed. However, it is well known that even random filters, which do not respond to flat images, lead to highly non-Gaussian, kurtotic (also commonly referred to as sparse) filter responses. Two example distributions of filter responses are shown in Figure 4.4(c). These marginal distributions exhibit heavy tails and high probabilities of near-zero values.
Unlike PCA, independent component analysis (ICA) tries to find the linear transformation which removes as much redundancy as possible by minimizing multi-information [9, 10]. In practice, this amounts to finding a set of filters with maximally sparse responses, an approach proposed by Olshausen and Field [11]. Equivalently, we can try to find the filter matrix with maximal likelihood under the linear factorial model. The resulting filters share three prominent features with the simple cells of the primary visual cortex: they are localized, oriented, and bandpass. ICA filters for ![]() pixel images are shown in Figure 4.4(b). The emergence of these features after training on natural images suggests that the primary visual cortex may also be optimized according to similar rules for extracting statistically independent structure from natural images.
pixel images are shown in Figure 4.4(b). The emergence of these features after training on natural images suggests that the primary visual cortex may also be optimized according to similar rules for extracting statistically independent structure from natural images.
However, linear factorial models fail to achieve a truly independent representation of natural images. In the bow-tie plot of Figure 4.4(d) we demonstrate how the ICA sources for natural images still exhibit dependencies between each other, even though ICA is the best possible linear factorial model. Detailed analyses have shown that even when linear factorial models are optimized to capture higher-order correlations, as ICA is, they achieve only quite small improvements in modeling power compared to decorrelating transformations such as PCA [12, 13]. The physical reason for this failure is that image formation simply does not obey the rules of linear superposition but rather results from several nonlinear interactions such as occlusion. The assumptions made by the linear model are clearly too strong.
Before describing extensions of the linear factorial model, we wish first to describe a related family of models (the left branch of our diagram in Figure 4.3) that has been designed to exploit ![]() -spherical symmetries exhibited by the natural image distribution. An example of such symmetry is shown in the joint histogram of natural image ICA sources in Figure 4.4(c) which exhibit an
-spherical symmetries exhibited by the natural image distribution. An example of such symmetry is shown in the joint histogram of natural image ICA sources in Figure 4.4(c) which exhibit an ![]() -spherical symmetry with
-spherical symmetry with ![]() close to
close to ![]() , that is, a diamond-shaped symmetry. Not only do the joint responses of pairs of ICA filters exhibit this symmetry but joint wavelet coefficients and many kinds of oriented filter responses to natural images also exhibit
, that is, a diamond-shaped symmetry. Not only do the joint responses of pairs of ICA filters exhibit this symmetry but joint wavelet coefficients and many kinds of oriented filter responses to natural images also exhibit ![]() -spherical symmetry. An
-spherical symmetry. An ![]() -spherical distribution's density only depends on the
-spherical distribution's density only depends on the ![]() -norm, that is,
-norm, that is,
for some function ![]() and
and ![]() . Note that the Euclidean norm corresponds to
. Note that the Euclidean norm corresponds to ![]() and elliptical symmetry, a special case of
and elliptical symmetry, a special case of ![]() -spherical symmetry which can also describe a range of other symmetries when different values of
-spherical symmetry which can also describe a range of other symmetries when different values of ![]() are used.
are used.
Gaussian scale mixtures (GSM) exploit this ![]() -spherical symmetry and can be used to generate sparse, heavy-tailed distributions. The GSM specifies the density of an image
-spherical symmetry and can be used to generate sparse, heavy-tailed distributions. The GSM specifies the density of an image ![]() as
as
4.6![]()
where ![]() is the scale factor,
is the scale factor, ![]() specifies a distribution over different scales,
specifies a distribution over different scales, ![]() determines the covariance structure, and
determines the covariance structure, and ![]() indicates the normal distribution. By mixing many Gaussian distributions with identical means and covariance structures yet different scale factors, one can generate distributions with very heavy tails. Wainwright and Simoncelli [14] introduced GSMs to the field of natural image statistics as a way of capturing the correlations between the wavelet coefficients of natural images, which are similar to the correlations shown in Figure 4.4(c) and (d), and Portilla and colleagues later successfully applied the model to denoising [15].
indicates the normal distribution. By mixing many Gaussian distributions with identical means and covariance structures yet different scale factors, one can generate distributions with very heavy tails. Wainwright and Simoncelli [14] introduced GSMs to the field of natural image statistics as a way of capturing the correlations between the wavelet coefficients of natural images, which are similar to the correlations shown in Figure 4.4(c) and (d), and Portilla and colleagues later successfully applied the model to denoising [15].
A generalization of the GSM is given by ![]() -elliptically symmetric models (L2) [13, 16, 17], which only assume that the isodensity contours of the natural image distribution are elliptically symmetric.
-elliptically symmetric models (L2) [13, 16, 17], which only assume that the isodensity contours of the natural image distribution are elliptically symmetric. ![]() -elliptically symmetric distributions can be defined in terms of a function of the Euclidean norm (i.e., the
-elliptically symmetric distributions can be defined in terms of a function of the Euclidean norm (i.e., the ![]() norm) after a whitening linear transformation
norm) after a whitening linear transformation ![]() , that is, one which removes pairwise correlations:
, that is, one which removes pairwise correlations:
4.7![]()
Importantly, the spherical symmetry assumption of L2 implies that it is invariant under arbitrary orthogonal transformations ![]() (as
(as ![]() ), meaning that the particular filter shapes in
), meaning that the particular filter shapes in ![]() are unimportant as applying an orthogonal transformation destroys filter shape. Nonetheless, L2 outperforms ICA in fitting the distribution of natural images [13]. The redundancies captured by L2 can be removed by applying a nonlinear transformation after whitening [16, 17].
are unimportant as applying an orthogonal transformation destroys filter shape. Nonetheless, L2 outperforms ICA in fitting the distribution of natural images [13]. The redundancies captured by L2 can be removed by applying a nonlinear transformation after whitening [16, 17].
The ![]() -spherically symmetric model (Lp), which replaces the
-spherically symmetric model (Lp), which replaces the ![]() -norm with an
-norm with an ![]() -norm in Equation (4.7), is even more general and allows for any shape of isoprobability contour in the class of
-norm in Equation (4.7), is even more general and allows for any shape of isoprobability contour in the class of ![]() spheres. Sinz and Bethge have shown that the optimal
spheres. Sinz and Bethge have shown that the optimal ![]() for natural image patches is approximately equal to 1.3 [17, 18], and they later also generalized the Lp model further to a class of models called the
for natural image patches is approximately equal to 1.3 [17, 18], and they later also generalized the Lp model further to a class of models called the ![]() -nested distributions [19]. All
-nested distributions [19]. All ![]() -spherical models fall into a general class of models called
-spherical models fall into a general class of models called ![]() -spherical distributions [19].
-spherical distributions [19].
Models exploiting the ![]() -spherical symmetry of natural images are intimately related to the contrast fluctuations in natural images. A common measure of local image contrast is root-mean-square contrast, which is also the standard deviation of the pixel intensities. Pixel standard deviation is directly proportional to
-spherical symmetry of natural images are intimately related to the contrast fluctuations in natural images. A common measure of local image contrast is root-mean-square contrast, which is also the standard deviation of the pixel intensities. Pixel standard deviation is directly proportional to ![]() if the mean intensity of
if the mean intensity of ![]() has been removed.
has been removed. ![]() -spherically symmetric models have thus been considered particularly apt for capturing contrast fluctuations and have also been linked with the physiological process of contrast gain control. Simoncelli and colleagues made this link by showing how a model of neural gain control, divisive normalization, can be used to remove correlations between filter responses [e.g., [14, 16, 17, 20]. Physiological measurements of population activity in the primary visual cortex demonstrate that such adaptive nonlinearities play an important role in the neural coding of natural images [21].
-spherically symmetric models have thus been considered particularly apt for capturing contrast fluctuations and have also been linked with the physiological process of contrast gain control. Simoncelli and colleagues made this link by showing how a model of neural gain control, divisive normalization, can be used to remove correlations between filter responses [e.g., [14, 16, 17, 20]. Physiological measurements of population activity in the primary visual cortex demonstrate that such adaptive nonlinearities play an important role in the neural coding of natural images [21].
We now return to the middle branch of the diagram in Figure 4.3. One straightforward way to extend linear factorial models is to use an overcomplete basis set ![]() where
where ![]() , that is, where there are more sources than dimensions in the data. The sparse coding algorithm proposed by Olshausen and Field [22] was the first to successfully learn an overcomplete basis resembling cortical representations. (See Chapter 14 for an overview of sparse models.) Subsequent analysis has shown that using overcomplete representations also yields a better fit to the distribution of natural images [23]. Sparse representations have additionally been highly influential in biological experiments of visual processing. In Section 4.5, we discuss examples of visual experiments examining whether sparse coding predicts neural activity.
, that is, where there are more sources than dimensions in the data. The sparse coding algorithm proposed by Olshausen and Field [22] was the first to successfully learn an overcomplete basis resembling cortical representations. (See Chapter 14 for an overview of sparse models.) Subsequent analysis has shown that using overcomplete representations also yields a better fit to the distribution of natural images [23]. Sparse representations have additionally been highly influential in biological experiments of visual processing. In Section 4.5, we discuss examples of visual experiments examining whether sparse coding predicts neural activity.
Group factorial models represent another important extension in which the source variables in ![]() are modeled as
are modeled as ![]() independent groups of variables:
independent groups of variables:
4.8
The independent feature subspace analysis (ISA) model [24] is a group factorial model that assumes each group of source variables is spherically symmetric distributed. More specifically, ISA assumes that the coefficients ![]() can be split into pairs, triplets, or
can be split into pairs, triplets, or ![]() -tuples that are independent from each other while the coefficients within an
-tuples that are independent from each other while the coefficients within an ![]() -tuple have a spherically symmetric distribution. The density of an image thus depends on the densities of each
-tuple have a spherically symmetric distribution. The density of an image thus depends on the densities of each ![]() -tuple's
-tuple's ![]() -norm:
-norm:
4.9
where there are ![]() independent
independent ![]() -tuples and
-tuples and ![]() is the set of indices in the
is the set of indices in the ![]() th group. The model is strikingly analogous to models of complex cells in the primary visual cortex – the individual filters
th group. The model is strikingly analogous to models of complex cells in the primary visual cortex – the individual filters ![]() can be thought of as simple cell-receptive fields so that the response of a complex cell (one
can be thought of as simple cell-receptive fields so that the response of a complex cell (one ![]() -tuple) can be identified with the sum of the squared responses to its input simple cells. When applied to natural images, the filter shapes of each
-tuple) can be identified with the sum of the squared responses to its input simple cells. When applied to natural images, the filter shapes of each ![]() -tuple are similar in orientation, location, and frequency but vary in phase, consistent with complex cell response properties [24]. Extensions of ISA that allow both the size of the subspace,
-tuple are similar in orientation, location, and frequency but vary in phase, consistent with complex cell response properties [24]. Extensions of ISA that allow both the size of the subspace, ![]() , and the linear filters,
, and the linear filters, ![]() , to be learned simultaneously perform even better at capturing natural image regularities [25].
, to be learned simultaneously perform even better at capturing natural image regularities [25].
A third important development in extending factorial models are products of experts (PoE) [26]. This class of models generalizes the linear factorial model to an overcomplete representation in a way which relaxes the assumption of statistically independent coefficients ![]() . A PoE defines the density of an image as the product of
. A PoE defines the density of an image as the product of ![]() functions of projections of the image (the “experts”),
functions of projections of the image (the “experts”),
4.10![]()
For ![]() , that is, when there are as many filters as dimensions in the data, and one-dimensional projections
, that is, when there are as many filters as dimensions in the data, and one-dimensional projections ![]() , that is, filters of the same size as the training images, PoE reduces to the linear factorial model as in Equation 4.5. The product of Student-
, that is, filters of the same size as the training images, PoE reduces to the linear factorial model as in Equation 4.5. The product of Student-![]() (PoT) distributions [27, 28] is a popular instance of the PoE in which the experts take the form
(PoT) distributions [27, 28] is a popular instance of the PoE in which the experts take the form
4.11![]()
Using heavy-tailed PoT distributions as experts encourages the model to find sparsely distributed features. PoT distributions also allow for efficient model training even for highly overcomplete models. Other PoE models and extensions which show great promise are those built on the restricted Boltzmann machine (RBM), such as the mcRBM or mPoT of Ranzato and colleagues [5] or the masked RBM of Heess and colleagues [29]. Each of these models has been successfully applied in computer vision tasks, some of which we discuss in Section 4.4.
An extension of the PoE to images of arbitrary size is given by the field of experts (FoE) [30, 31]. Up till now, our discussion has focused on patch-based image models, that is, rather than modeling large images, the previously described models capture the statistics of small image patches up to ![]() pixels in size. The patch-based approach is computationally convenient as the data contain far fewer dimensions. The FoE is able to model images of arbitrary size by applying the same experts to different parts of an image. If
pixels in size. The patch-based approach is computationally convenient as the data contain far fewer dimensions. The FoE is able to model images of arbitrary size by applying the same experts to different parts of an image. If ![]() is a neighborhood of
is a neighborhood of ![]() pixels centered around pixel
pixels centered around pixel ![]() , then the FoE's density can be written as
, then the FoE's density can be written as
4.12![]()
where the index ![]() runs over all pixel locations in the image and therefore the model considers all overlapping
runs over all pixel locations in the image and therefore the model considers all overlapping ![]() regions in the image. The key distinction from the PoE is the following: to train a PoE, one first gathers a large ensemble of small image patches and learns a set of experts assuming that the training samples are independent of each other. An FoE, on the other hand, is trained on all overlapping
regions in the image. The key distinction from the PoE is the following: to train a PoE, one first gathers a large ensemble of small image patches and learns a set of experts assuming that the training samples are independent of each other. An FoE, on the other hand, is trained on all overlapping ![]() regions in a large image and therefore explicitly captures the statistical dependencies existing between overlapping image regions. The same
regions in a large image and therefore explicitly captures the statistical dependencies existing between overlapping image regions. The same ![]() experts are used for all regions, so that the number of parameters depends on
experts are used for all regions, so that the number of parameters depends on ![]() , not on the size of the entire image, and therefore remains tractable. FoE has been highly successful in various image restoration tasks and will be discussed further in Section 4.4.
, not on the size of the entire image, and therefore remains tractable. FoE has been highly successful in various image restoration tasks and will be discussed further in Section 4.4.
We now turn our discussion to the final branch on the right of the diagram in Figure 4.3. Mixtures of Gaussians (MoG) are widely used in a variety of density estimation tasks and have been shown to perform very well as a model of natural image patches [e.g., [32, 33]]. Under MoG, image patches are modeled as a mixture of ![]() Gaussian distributions each with its own mean
Gaussian distributions each with its own mean ![]() and covariance
and covariance ![]()
4.13
where ![]() is the prior probability of the
is the prior probability of the ![]() th Gaussian. Modeling even small image patches with an MoG requires a large number of mixture components,
th Gaussian. Modeling even small image patches with an MoG requires a large number of mixture components, ![]() . The same performance can be achieved with far fewer components if Gaussians are replaced with Gaussian scale mixtures as in the mixture of GSMs (MoGSM),
. The same performance can be achieved with far fewer components if Gaussians are replaced with Gaussian scale mixtures as in the mixture of GSMs (MoGSM),
4.14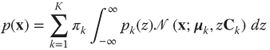
As presented earlier, a single GSM (Equation (4.6)) can be used to model a distribution with narrow peaks and heavy tails. This allows GSMs to capture the strong contrast fluctuations of natural images, but not to generate more structured content (see an example of GSM samples in Figure 4.7). By allowing for a mixture of different GSMs each with its own covariance structure, one attains a better approximation of the natural image distribution. Guerrero-Colon and colleagues extended the GSM of wavelet coefficients [14, 15] to MoGSMs and showed improved denoising performance [34].
Another model proposed by Karklin and Lewicki [35] can be viewed as a continuous (or compound) mixture of an infinite number of Gaussian distributions and like ISA has been linked to complex cells of the primary visual cortex.
An extension of MoGSM to images of arbitrary size is achieved by the mixture of conditional Gaussian scale mixtures (MCGSM) [36]. Any distribution can be decomposed into a set of conditional distributions via the chain rule of probability theory,
4.15![]()
Rather than modeling the distribution of natural images directly, an MCGSM tries to capture the distribution of one pixel ![]() given a neighborhood of pixels
given a neighborhood of pixels ![]() . Such a neighborhood is illustrated in Figure 4.5. Assuming that the distribution of natural images is invariant under translations of the image, one can use the same conditional distribution for each pixel
. Such a neighborhood is illustrated in Figure 4.5. Assuming that the distribution of natural images is invariant under translations of the image, one can use the same conditional distribution for each pixel ![]() , so that only a single conditional distribution has to be learned. The translation-invariance assumption is analogous to the weight-sharing constraint used in convolutional neural networks, a regularization method that was critical to make discriminative learning of deep neural networks feasible. Theis et al. [36] derive a form for
, so that only a single conditional distribution has to be learned. The translation-invariance assumption is analogous to the weight-sharing constraint used in convolutional neural networks, a regularization method that was critical to make discriminative learning of deep neural networks feasible. Theis et al. [36] derive a form for ![]() by assuming that the joint distribution of
by assuming that the joint distribution of ![]() is given by an MoGSM. The MCGSM greatly improves modeling power over the MoGSM as the same amount of parameters used by the MoGSM to model the full distribution of image pixels is used to capture a single conditional distribution.
is given by an MoGSM. The MCGSM greatly improves modeling power over the MoGSM as the same amount of parameters used by the MoGSM to model the full distribution of image pixels is used to capture a single conditional distribution.
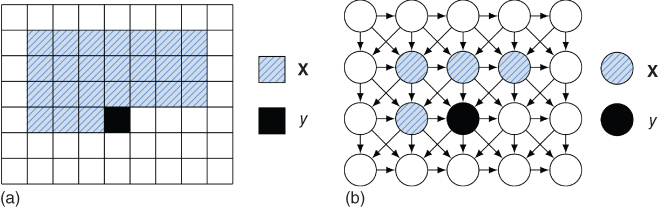
Figure 4.5 The MCGSM [36] models images by learning the distribution of one pixel, ![]() , given a causal neighborhood of pixels
, given a causal neighborhood of pixels ![]() (a). A graphical model representation of the MCGSM is shown in (b), where for visualization purposes the neighborhood consists of only four pixels. The parents of a pixel are constrained to pixels which are above it or in the same row and left of it, which allows for efficient maximum likelihood learning and sampling.
(a). A graphical model representation of the MCGSM is shown in (b), where for visualization purposes the neighborhood consists of only four pixels. The parents of a pixel are constrained to pixels which are above it or in the same row and left of it, which allows for efficient maximum likelihood learning and sampling.
One of the main advances made by the MCGSM over patch-based models is its ability to capture long-range correlations. This is possible because the model is not restricted to learning the structure of independent small image regions, but like the FoE model, it is trained using many overlapping neighborhoods. As a technical note, MCGSM has a practical advantage as well: unlike for FoEs, it is computationally tractable to evaluate the likelihood of an MCGSM. (We discuss such quantitative model comparisons in the following section.) The MCGSM is able to capture many kinds of perceptually relevant image structures, such as edges and texture features (see Figure 4.9 for some examples). By combining the MCGSM with a multiscale representation, the model's ability to capture correlations can be increased even further [36].
The same trick of turning a patch-based model into an image model has been applied to GSMs [37], MoG [38], and products of experts (RNADE) [39] to derive tractable models of natural images that scale well with image size.
4.3.1 Model Evaluation
In the previous section, we often alluded to how well the various models performed. An information-theoretic measure which quantifies how well a model distribution ![]() agrees with a target distribution
agrees with a target distribution ![]() is given by the Kullback–Leibler (KL) divergence,
is given by the Kullback–Leibler (KL) divergence,
4.16![]()
It describes the average additional cost (in bits) incurred by encoding ![]() using a coding scheme optimized for
using a coding scheme optimized for ![]() when the actual distribution is
when the actual distribution is ![]() . The KL divergence is always nonnegative, and it is zero if and only if
. The KL divergence is always nonnegative, and it is zero if and only if ![]() and
and ![]() are identical. Unfortunately, evaluating the KL divergence requires knowledge of the distribution
are identical. Unfortunately, evaluating the KL divergence requires knowledge of the distribution ![]() , which, in our case, is the distribution of natural images. However, using samples from
, which, in our case, is the distribution of natural images. However, using samples from ![]() , that is, a dataset of images, we can obtain an unbiased estimate of the first term, the negative log-likelihood or cross-entropy:
, that is, a dataset of images, we can obtain an unbiased estimate of the first term, the negative log-likelihood or cross-entropy:
4.17![]()
The KL divergence is invariant under reparameterization of ![]() . This property is lost when only considering the cross-entropy term. In practice, this means that changes to the way images are represented and preprocessed, for example, differently scaled pixel values, affect the numbers we measure. One should thus only consider differences between the log-likelihoods of different models, which correspond to differences between the models' KL divergences (because the entropy term cancels out).
. This property is lost when only considering the cross-entropy term. In practice, this means that changes to the way images are represented and preprocessed, for example, differently scaled pixel values, affect the numbers we measure. One should thus only consider differences between the log-likelihoods of different models, which correspond to differences between the models' KL divergences (because the entropy term cancels out).
A more robust measure is obtained when we try to estimate the multi-information (Equation (4.1)) by replacing the entropy with a cross-entropy,
4.18![]()
This measure is invariant under invertible pointwise nonlinearities and thus more meaningful on an absolute scale. In contrast to the KL divergence, it only requires knowledge of the marginal entropy of a pixel's intensity and this can be estimated relatively easily. Because the cross-entropy is always larger than the entropy, this yields an estimated lower bound on the true redundancy of natural images. It can thus be thought of as the amount of second- and higher-order correlations captured by a given model.
In Figure 4.6 we compare multi-information estimates for most of the models we reviewed. The parameters of all models were estimated using some form of maximum likelihood learning and a separate test set was used for evaluation. For patch-based models, we used ![]() patches sampled uniformly from the dataset of van Hateren and van der Schaaf [10] which were subsequently log-transformed; that is, instead of working with linear pixel intensities, we model
patches sampled uniformly from the dataset of van Hateren and van der Schaaf [10] which were subsequently log-transformed; that is, instead of working with linear pixel intensities, we model ![]() , as is common. By taking the logarithm, one tries to mimic the response properties of photoreceptors [40, 41]. We used 10,000 patches for evaluation. For some models,
, as is common. By taking the logarithm, one tries to mimic the response properties of photoreceptors [40, 41]. We used 10,000 patches for evaluation. For some models, ![]() could not be evaluated analytically but had to be estimated (DBN [32], OICA, PoT [23]). For the MCGSM, we used a
could not be evaluated analytically but had to be estimated (DBN [32], OICA, PoT [23]). For the MCGSM, we used a ![]() neighborhood as in Figure 4.5(a) and 200,000 data points for evaluation. In addition, because the image intensities of the van Hateren dataset were discretized, we added independent uniform noise before log-transforming the pixels and evaluating the MCGSM. This ensures that the differential entropy and hence the cross-entropy is bounded below. Without adding noise, the model's likelihood might diverge (both on the training and the test sets). We only empirically observed this problem with the MCGSM, whose conditional structure allows it to pick up on the discretization.
neighborhood as in Figure 4.5(a) and 200,000 data points for evaluation. In addition, because the image intensities of the van Hateren dataset were discretized, we added independent uniform noise before log-transforming the pixels and evaluating the MCGSM. This ensures that the differential entropy and hence the cross-entropy is bounded below. Without adding noise, the model's likelihood might diverge (both on the training and the test sets). We only empirically observed this problem with the MCGSM, whose conditional structure allows it to pick up on the discretization.
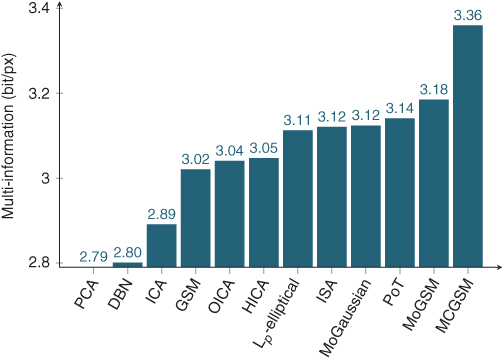
Figure 4.6 Redundancy reduction capabilities of various methods and models quantified in terms of estimated multi-information. PCA [12, 13] only takes second-order correlations into account and here serves as the baseline. ICA [12, 13] corresponds to the best linear transformation for removing second- and higher-order correlations. Overcomplete ICA (OICA) [23], ISA [25], and hierarchical ICA (HICA) [42] represent various extensions of ICA. Also included are estimates for deep belief networks (DBN), ![]() -elliptical models [19], MoG (32 components), PoT, mixtures of GSMs, and MCGSMs.
-elliptical models [19], MoG (32 components), PoT, mixtures of GSMs, and MCGSMs.
Figure 4.6 shows that the stationarity assumption of the MCGSM allows it to capture much more correlations than its patch-based counterpart. This is the case despite the fact that the MCGSM has much fewer parameters. We used 32 components for the MoGSM but only 8 components for the MCGSM, and each component of the MCGSM has fewer parameters than one component of the MoGSM, because it depends on fewer pixels. The figure also shows that relatively simple models such as ![]() -elliptical models can already capture much of the higher-order redundancies captured by more complex models such as MoG or PoT, which contain many more parameters and are more difficult to optimize.
-elliptical models can already capture much of the higher-order redundancies captured by more complex models such as MoG or PoT, which contain many more parameters and are more difficult to optimize.
Figure 4.7 shows samples generated by some of these models trained on image patches sampled from the van Hateren dataset [10]. It can be seen that the GSM improves over PCA by capturing the contrast fluctuations in natural images, and more sophisticated models introduce more and more structured content resembling branches. We note that the appearance of samples may change when a different dataset is used for training. For example, datasets used in computer vision more frequently contain urban scenes and handmade objects, leading to a stronger prevalence of high-contrast edges.
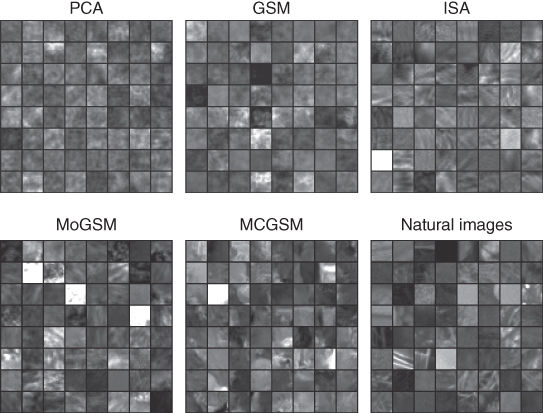
Figure 4.7 Image patches generated by various image models. To enhance perceptual visibility of the difference between the samples from the different models, all models were trained on natural images with a small amount of additive Gaussian noise.
An important question is whether the differences in likelihood are perceptually meaningful. Recent psychophysical experiments in which human observers discriminated true natural images from model samples showed that even small changes in likelihood lead to appreciable perceptual differences and more generally that likelihood seems to have good predictive power about perceptual relevance [43]. Those experiments tested a wide range of patch-based models including a model capturing only second-order correlations, ICA, L2, Lp, and MoGSM. People performed very well on the task whenever images were ![]() pixels in size or larger, indicating that the human visual system possesses far more detailed knowledge of the natural image distribution than any model tested. Moreover, human performance depended on the model likelihood such that samples from lower likelihood models were easier to distinguish from natural images than samples from higher likelihood models were. (We will discuss this work in more detail in Section 4.5 when we discuss experimental links between biological vision and natural image models.)
pixels in size or larger, indicating that the human visual system possesses far more detailed knowledge of the natural image distribution than any model tested. Moreover, human performance depended on the model likelihood such that samples from lower likelihood models were easier to distinguish from natural images than samples from higher likelihood models were. (We will discuss this work in more detail in Section 4.5 when we discuss experimental links between biological vision and natural image models.)
Although likelihood provides an objective measure for model comparison that also shows good predictive power about perceptual relevance, it is not an absolute measure of model performance because the total amount of correlations present in natural images is unknown. Another difficulty is that it is not always straightforward or computationally tractable to evaluate model likelihood. Psychophysical discrimination measures can provide an absolute performance measure – either a model succeeds at fooling the human visual system, in which case, human observers will be at chance to discriminate its samples from real natural images, or not, but the technique developed in Ref. [43] requires the experimenter to generate model samples matched in joint probability to a set of natural images, which can be difficult for some models. Furthermore, it should be used in concert with likelihood estimation as it is trivial to construct a model which would bring human performance to chance but assigns a density of zero to almost all natural images (e.g., a model which assigns probability ![]() to each image in a training set of
to each image in a training set of ![]() images). Other methods for model evaluation have also been suggested, such as denoising performance [e.g., [34]], inpainting [e.g., [30, 31]], or measuring the similarity between model samples and true natural images [e.g., [44]].
images). Other methods for model evaluation have also been suggested, such as denoising performance [e.g., [34]], inpainting [e.g., [30, 31]], or measuring the similarity between model samples and true natural images [e.g., [44]].
4.4 Computer Vision Applications
Knowledge of natural image statistics is proving useful in a variety of computer vision applications. We will describe two important areas: image restoration and classification. We chose this focus because image models have an established and direct role in restoration and because contributions to classification applications show great promise for future impact as modeling techniques advance.
All image restoration tasks require a way of predicting the true content of an image from a corrupted version of the image. (Note that Chapter 16 also discusses image restoration.) A probabilistic image model tells us which images are a priori more likely and are thus clearly useful in such a setting. As an example, Figure 4.8 shows filling-in of missing pixels by computing the most likely pixel values under the distribution defined by an MCGSM.
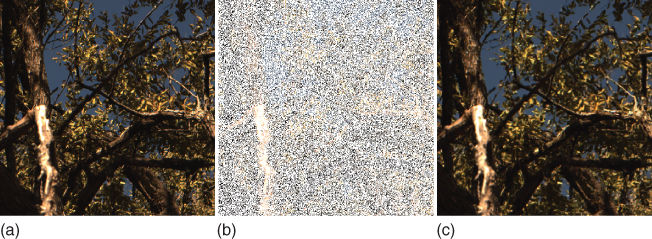
Figure 4.8 After removing 70% of the pixels from the image (a), the missing pixels from (b) were estimated by maximizing the density defined by an MCGSM (c).
For removing noise from an image, the common recipe starts with separately modeling the noise and the image distribution. One of the earlier examples is the GSM model of Portilla and colleagues [15]. In their approach, images are first transformed using a particular overcomplete wavelet transformation called the steerable pyramid, and dependencies between coefficients of the resulting representation are modeled using a GSM. In this model, noisy coefficients are assumed to result from the sum of a GSM and a Gaussian random variable. To denoise, the covariances of the GSM and the random Gaussian variable are estimated for each subband of the wavelet transformation and a Bayesian least squares estimator is used to predict the denoised coefficients. Guerrero-Colon and colleagues [34] extended the approach by using a finite MoGSM, a more sensitive image model that allows for variations in pixel covariance across different subregions of the image. It substantially outperforms a single GSM (in agreement with the models' likelihood ordering).
Another prominent example of modeling applied to image restoration is the work of Roth and Black [30, 31]. They used a FoE and showed that it performs well on both denoising and the related task of inpainting, in which unwanted parts of an image such as scratches are removed. Ranzato and colleagues [5] have shown that PoE can be made to achieve competitive denoising performance by combining it with the nonlocal means algorithm [45]. Interestingly, the state-of-the-art denoising technique of Mairal and colleagues (LSSC) [46] relies on a combination of a sparse image model similar to that of Olshausen and Field [22] and a nonparametric heuristic exploiting the similarity of local regions across an image. Finally, Zoran and Weiss [33] achieved denoising results similar to LSSC using only large mixtures of Gaussians.
The success of natural image models at capturing perceptually meaningful image content is also highlighted in another application – texture modeling. Image models trained on various textures, that is, visually homogeneous images rather than scenes which typically contain many textures, can be used to develop useful image representations and to aid in discriminating textures and synthesizing new samples of a given texture. In Figure 4.9, we illustrate an example of natural textures and synthesized samples generated using the MCGSM model.
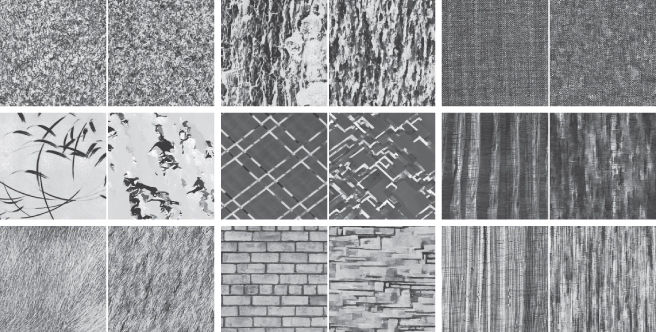
Figure 4.9 Computer vision applications of image models include the synthesis, discrimination, and computation of representations of textures. Here we illustrate the performance of one model in capturing the statistics of a variety of textures. The left image of each pair shows a random ![]() pixel crop of a texture [47]. The right image of each pair shows a histogram-matched sample from the MCGSM trained on the texture. The samples provide a visual illustration of the kind of correlations the model can capture when applied to various visual textures.
pixel crop of a texture [47]. The right image of each pair shows a histogram-matched sample from the MCGSM trained on the texture. The samples provide a visual illustration of the kind of correlations the model can capture when applied to various visual textures.
A more recent development is the application of natural image models to classification tasks. In this area, models have been used to design powerful image representations that often improve discriminability over methods relying on well-engineered features such as SIFT (See Chapter 15, Section 15.4.1 for a description). Ranzato and colleagues have published a variety of recent results showing how natural image models can be brought to bear on high-level classification tasks, summarized in Ref. [5]. They applied a particular class of hierarchical image models based on the RBM that includes the mcRBM which is specialized to capture mean and covariance fluctuations across images and the mPoT, an extension of PoT. Their results show that the model-extracted representations lead to competitive performance on scene classification, object recognition, and recognition of facial expressions under occlusion.
A principled approach to improving classifiers using unlabeled data is to define a joint model of class labels ![]() and images
and images ![]() ,
, ![]() , and to optimize the model's parameters with respect to the joint log-likelihood,
, and to optimize the model's parameters with respect to the joint log-likelihood,
![]()
where the first sum is over labeled data and the second sum is over unlabeled data. Using a hierarchical extension of PoT, Ngiam and colleagues [4] showed that taking into account the joint density instead of performing purely discriminative training can have a regularizing effect and improve classification performance even in the absence of additional unlabeled data.
4.5 Biological Adaptations to Natural Images
Since the 1980s, several researchers have endeavored to directly measure how biological systems are adapted to the statistical regularities present in the environment. Although this goal remains highly challenging, several studies of biological vision have provided clear examples. In this section, we will focus on a small selection of some of the most compelling results. Our review will proceed from studies of early visual processing stages, such as those occurring in the eyes, to studies of the later processing stages occurring in subcortical and cortical sites of the mammalian visual pathway.
We start with one of the earliest experiments to connect biological vision with image statistics using efficient coding principles. In an elegant comparison of computational predictions and physiological measurements, Laughlin [48] illustrated how the contrast statistics of natural scenes are efficiently represented by the cells that code contrast in the fly's compound eye. Laughlin used a photodiode rig that replicated the imaging process of a fly photoreceptor to measure the contrast distribution over a variety of natural scenes. He then measured the physiological responses to contrast in the contrast-coding cells of the fly's compound eye. In the key comparison, the physiological response distribution was shown to be extremely well matched to the cumulative distribution of the measured contrast values, the optimal coding function for maximizing information transmission of a single input parameter using a single output parameter. This response distribution ensures that more frequent contrast values are represented with finer resolution in the space of possible physiological response states. This finding was one of the first to reveal a biological adaptation to natural visual input at the single-cell level.
In a recent analysis of primate retina (see Chapter 3 for an overview of retinal processing), Doi and colleagues [49] conducted a similarly elegant comparison of measured responses and efficient coding predictions. Their focus was on the retinal circuitry connecting cones, the photoreceptors active in daylight conditions, to complete populations of different classes of retinal ganglion cells, the cells relaying visual information from the eyes to the brain. They derived the optimal connectivity matrix of weights between cone inputs and retinal ganglion cells, that is, the one maximizing information transmission for natural images while also taking physiological constraints into account. The receptive field structures associated with the optimal connectivity matrix were remarkably similar to the measured ones. Doi and colleagues further showed that the information transmission of the measured ganglion cells was highly efficient relative to that of the optimal population, achieving 80% efficiency. This work beautifully illustrated that biological adaptations to natural images are also present in the connectivity structures linking visual neurons together.
In Section 4.3, we described earlier theoretical work by Atick and Redlich [8] which demonstrated that the responses of primate retinal ganglion cells are adapted for the ![]() power spectrum of natural images. Dan et al. [50] extended this work with physiological measurements in the cat lateral geniculate nucleus (LGN), a subcortical way station along the mammalian visual pathway where visual input is processed before being relayed to cortical areas. As with retinal ganglion cells, the receptive fields of LGN cells act as local spatial bandpass filters. Dan and colleagues measured LGN responses to natural movies and to white noise movies (free of both spatial and temporal correlations). The LGN responses to natural movies, but not to white noise stimuli, were flat in the frequency domain as predicted, which indicated the cells were adapted for removing temporal correlations in visual input.
power spectrum of natural images. Dan et al. [50] extended this work with physiological measurements in the cat lateral geniculate nucleus (LGN), a subcortical way station along the mammalian visual pathway where visual input is processed before being relayed to cortical areas. As with retinal ganglion cells, the receptive fields of LGN cells act as local spatial bandpass filters. Dan and colleagues measured LGN responses to natural movies and to white noise movies (free of both spatial and temporal correlations). The LGN responses to natural movies, but not to white noise stimuli, were flat in the frequency domain as predicted, which indicated the cells were adapted for removing temporal correlations in visual input.
Studies of the primary visual cortex in the mammalian visual pathway (V1) have revealed several forms of adaptation to natural images. Berkes and colleagues [51] measured neural activity in ferret V1 across the lifespan to identify developmental adaptations to natural images. Rather than testing predictions about efficient information transmission, they pursued an entirely different approach to measuring how neural processes adapt to the environment's statistical properties. Their motivation was to understand how organisms make inferences about the world despite ambiguous sensory input. They hypothesized that animals build an internal statistical model of the environment over the course of development and that this model should be reflected in the spontaneous activity of V1 neurons in the absence of visual stimulation. By comparing neural activations in the dark with activations evoked in response to natural movies and to non-natural control movies, they showed that as ferrets aged, their spontaneous activity grew more similar to the activity evoked by natural movies, an effect which was not present for activity evoked by non-natural movies. These measurements indicated that statistical properties of natural images can also influence complex neural dynamics in the absence of input, in a manner consistent with learning an internal model of the environment. (See Chapter 9 for a related discussion of perceptual inference using internal models of the visual world.)
Sparse coding is a mechanism proposed for learning in neural systems [11, 22] (introduced in our discussion of linear factorial models in Section 4.3 and discussed in detail in Chapter 14), and identifying evidence for sparse coding has been the target of several physiological experiments. Vinje and Gallant [52] first demonstrated that the responses of V1 neurons become more selective under natural viewing conditions, an effect causing an individual neuron's responses to be elicited less often (i.e., more sparsely) and causing pairs of neurons to become decorrelated. It is important to note that this effect did not depend on the spatiotemporal structure of the visual input: both grating patterns and natural images resulted in the same sparsity effects. The important factor was instead whether an individual neuron alone was stimulated or whether several neurons processing neighboring parts of the image were also stimulated simultaneously (as in natural viewing conditions) by an image having greater visual extent. A more recent study examined how the spatiotemporal correlations of natural input affect V1 population-level responses. Using a state-of-the-art, three-dimensional neural imaging technique, Froudarakis and colleagues [53] simultaneously measured the responses of up to 500 cells in mouse V1 while either natural movies or phase-scrambled versions were shown (containing the same second-order spatial-temporal correlations yet lacking the higher-order correlations of natural movies). The results confirmed that population activity during natural movies was sparser than during the phase-scrambled movies. The sparser representation allowed for better discrimination of the different natural movie frames shown, illustrating that sparsity is linked with improved readout of the neural signal. Importantly, Froudarakis and colleagues also showed that these results rested on a nonlinearity that rapidly adapts to the statistics of the visual input or a contrast gain control mechanism being active during natural but not unnatural stimulation. This work is one of the first to demonstrate the specific importance of higher-order natural scene regularities in shaping the complex population-level activity of V1 neurons.
Evidence for adaptations to the higher-order regularities of natural images can also be observed at the behavioral level using rigorous psychophysical methods. We previously developed a technique for evaluating natural image models using the human visual system ([43], introduced in Section 4.3.1). The experimental manipulation highlighted the local variations present in natural scenes. Subjects saw two sets of image patches arranged in tightly tiled square grids (Figure 4.10). They were told that one set was cut from real photographic images, whereas the other was a set of impostor images, and their task was to select the true set of photographic images. The impostors on each trial were model samples matched in joint-likelihood to the true images, such that a perfect model, that is, one capturing at least as much of the regularities as the human visual system represents, would force observers to be at chance on the discrimination task. We tested the efficacy of several natural image models in this way, from a model capturing only second-order correlations up to the patch-based model at the state of the art for capturing higher-order correlations (MoGSM). The results clearly showed that human observers were sensitive to more of the higher-order correlations present in the natural images than were captured by any of the models, which held true whenever the image patches were ![]() pixels in size or greater.
pixels in size or greater.
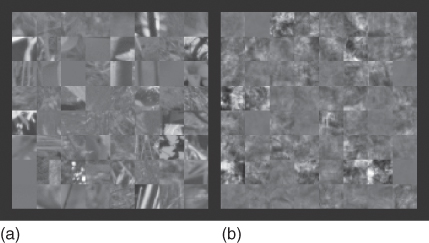
Figure 4.10 Illustration of a psychophysical stimulus pitting natural images against model samples following [43]. Observers viewed two sets of tightly tiled images. They were told that one set included patches from photographs of natural scenes, whereas the other contained impostors, and their task was to identify the true set ((a) here). The “imposters” here are samples from the ![]() -spherically symmetric model. The model samples were always matched in joint probability to the natural images (under the particular model being tested, i.e., under Lp here). In this example, the patches are
-spherically symmetric model. The model samples were always matched in joint probability to the natural images (under the particular model being tested, i.e., under Lp here). In this example, the patches are ![]() pixels in size. As shown, the model samples fail to capture several prominent features of natural images, particularly their detailed geometric content.
pixels in size. As shown, the model samples fail to capture several prominent features of natural images, particularly their detailed geometric content.
The same psychophysical technique can also be used to test specific hypotheses about the image features that human observers use to discriminate model samples from true natural images. We did so by performing a series of control experiments that were identical to the main experiment except that only select image features were made available in the stimuli. The results of the various feature-controlled experiments revealed three key model shortcomings: first, linear factorial models fail to capture the marginal distribution of natural images, second, ![]() -spherical models fail to capture local contrast fluctuations across images, and third, all models fail to capture local shape statistics sufficiently. The third shortcoming was underscored by an experiment in which the image patches making up the stimuli were binarized, a manipulation emphasizing the shapes of the luminance contours present in the images, which, for example, relate to object silhouettes and shading patterns across three-dimensional objects. The human observers were able to discriminate natural images from model samples even with the impoverished binary stimuli, and the MoGSM trials were as easy as the second-order model trials. Taken together, the feature identification experiments suggested that increases in model likelihood were mostly driven by improvements in capturing local luminance and contrast statistics, rather than improvements in representing the detailed geometric content of natural scenes, an aspect to which human observers are highly sensitive.
-spherical models fail to capture local contrast fluctuations across images, and third, all models fail to capture local shape statistics sufficiently. The third shortcoming was underscored by an experiment in which the image patches making up the stimuli were binarized, a manipulation emphasizing the shapes of the luminance contours present in the images, which, for example, relate to object silhouettes and shading patterns across three-dimensional objects. The human observers were able to discriminate natural images from model samples even with the impoverished binary stimuli, and the MoGSM trials were as easy as the second-order model trials. Taken together, the feature identification experiments suggested that increases in model likelihood were mostly driven by improvements in capturing local luminance and contrast statistics, rather than improvements in representing the detailed geometric content of natural scenes, an aspect to which human observers are highly sensitive.
In summary, a variety of neuroscience techniques have already revealed several ways biological visual systems are adapted for natural scenes: from the single-cell level, to connectivity and population dynamic effects, up to perceptual effects. Future improvements in natural image modeling ought to allow for exciting new possibilities for generating well-controlled experimental stimuli that could be used to probe further aspects of how visual neurons are adapted for natural scenes and also, importantly, to probe the learning mechanisms that support these adaptations. This in turn may well lead to new insights for designing improved machine and computer vision applications.
4.6 Conclusions
In summary, natural image models have been useful in the area of image restoration, show promise as a means to do unsupersived learning of representations for classification tasks, and have provided insights into the image representations used by biological vision systems. In Figure 4.11, we illustrate the types of image features captured by state-of-the-art natural image models by comparing natural images with model samples. Several meaningful aspects of natural images are clearly represented, such as texture and edge features, yet current state-of-the-art image models are still unable to represent more object-like structures. An important question for future research is thus how to achieve higher-level image representations.
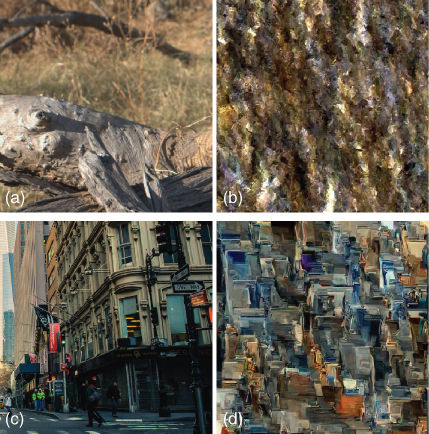
Figure 4.11 (a) A crop of an example image from a natural image dataset collected by Tkačik et al. [54]. (b) A corresponding sample of an MCGSM trained on the dataset, illustrating the kind of correlations captured by a current state-of-the-art probabilistic model of natural images. As with textures (Figure 4.9), the nature of the samples depends highly on the training images. When trained on an urban scene (a crop of the scene is shown in (c); photograph by Matt Wiebe [55]), the samples express much more vertical and horizontal structure (d).
It is important to note that many of the advances in density estimation performance are due to an improved ability to model contrast fluctuations. This is in large part due to the fact that model likelihood is very sensitive to the model's ability to capture luminance and contrast fluctuations. While objects themselves affect the pattern of contrast fluctuations apparent in an image, a lot of the variability in natural images is generated by changes in the illumination. It would be clearly advantageous for a model to be able to separate illumination effects from other variations in the scene's content. One way to focus more modeling power on other image content is to model contrast fluctuations separately, as is done by ![]() -spherical models. An alternative approach would be to model other image representations than the pixel representation. For example, representations of image contours – e.g., binary black-and-white images showing only object silhouettes – already contain a great deal of relevant information for object recognition. Such representations are also much more stable under changes of lighting conditions than the pixel representation. Thus, modeling the statistics of black-and-white images would likely provide new insights for the development of useful image representations. A third approach could be to abandon likelihoods altogether and instead maximize other functions of the model's image distribution.
-spherical models. An alternative approach would be to model other image representations than the pixel representation. For example, representations of image contours – e.g., binary black-and-white images showing only object silhouettes – already contain a great deal of relevant information for object recognition. Such representations are also much more stable under changes of lighting conditions than the pixel representation. Thus, modeling the statistics of black-and-white images would likely provide new insights for the development of useful image representations. A third approach could be to abandon likelihoods altogether and instead maximize other functions of the model's image distribution.
A complementary line of research has recently made it possible to learn high-level image representations using neural networks in a purely supervised manner [56, 57]. These techniques require huge amounts of labeled training data and even then can only be stopped from overfitting by using clever regularization techniques. An interesting question is whether the generalization performance of neural networks can be further improved using unsupervised learning, for example, by combining objectives from image modeling and classification in a semi-supervised setting as done by Ngiam and colleagues [4].
Although a few image models have been extended to video sequences, videos still provide a largely untapped source of information for unsupervised learning of image representations using probabilistic models. Obtaining large amounts of labels of high quality for videos is a more challenging endeavor than obtaining labels for images, so that we anticipate unsupervised learning to play a particularly important role for learning representations from videos.
To conclude, the field of image modeling is still in its formative stages, and the last couple of years have shown particularly promising bounds forward in terms of model performance, which is due partly to developments in machine learning techniques and partly to technological advances in computing. We expect this trend to continue in the coming years and the density estimation performance of image models to increase. As advances are made, one of the most exciting questions for future research will be how natural image statistics can be exploited to effectively improve visual inference in computer vision systems.
References
1. 1. Simoncelli, E.P. and Olshausen, B.A. (2001) Natural image statistics and neural representation. Annu. Rev. Neurosci., 24, 1193–1216.
2. 2. Barlow, H.B. (1959) Sensory mechanisms, the reduction of redundancy, and intelligence, in The Mechanisation of Thought Processes, Her Majesty's Stationery Office, London, pp. 535–539.
3. 3. Attneave, F. (1954) Some informational aspects of visual perception. Psychol. Rev., 61 (3), 183–193.
4. 4. Ngiam, J., Chen, Z., Koh, P.W., and Ng, A.Y. (2011) Learning deep energy models. Proceedings of the 28th International Conference on Machine Learning, pp. 1105–1112.
5. 5. Ranzato, M., Mnih, V., Susskind, J.M., and Hinton, G.E. (2013) Modeling natural images using gated MRFs. IEEE Trans. Pattern Anal. Mach. Intell., 35 (9), 2206–2222.
6. 6. Geisler, W.S. (2008) Visual perception and the statistical properties of natural scenes. Annu. Rev. Psychol., 59, 167–192.
7. 7. Chen, S.S. and Gopinath, R.A. (2000) Gaussianization, in Advances in Neural Information Processing Systems, MIT Press, vol. 13, pp. 423–429.
8. 8. Atick, J. and Redlich, A. (1992) What does the retina know about natural scenes? Neural Comput., 4, 196–210.
9. 9. Bell, A. and Sejnowski, T. (1997) The “Independent Components” of natural scenes are edge filters. Vision Res., 37 (23), 3327–3338.
10.10. van Hateren, J.H. and van der Schaaf, A. (1998) Independent component filters of natural images compared with simple cells in primary visual cortex. Proc. R. Soc. London, Ser. B, 265 (1394), 359–366.
11.11. Olshausen, B.A. and Field, D.J. (1996) Emergence of simple-cell receptive field properties by learning a sparse code for natural images. Nature, 381, 607–609.
12.12. Bethge, M. (2006) Factorial coding of natural images: how effective are linear models in removing higher-order dependencies? J. Opt. Soc. Am. A, 23 (6), 1253–1268.
13.13. Eichhorn, J., Sinz, F., and Bethge, M. (2009) Natural image coding in V1: how much use is orientation selectivity? PLoS Comput. Biol., 5 (4), 1–16, doi: 10.1371/journal.pcbi.1000336.
14.14. Wainwright, M. and Simoncelli, E. (2000) Scale mixtures of Gaussians and the statistics of natural images, in Advances in Neural Information Processing Systems, MIT Press, vol. 12, pp. 855–861.
15.15. Portilla, J., Strela, V., Wainwright, M.J., and Simoncelli, E.P. (2003) Image denoising using scale mixtures of Gaussians in the wavelet domain. IEEE Trans. Image Process., 12 (11), 1338–1351.
16.16. Lyu, S. and Simoncelli, E.P. (2009) Nonlinear extraction of independent components of natural images using radial Gaussianization. Neural Comput., 21 (6), 1485–1519.
17.17. Sinz, F. and Bethge, M. (2009) The conjoint effect of divisive normalization and orientation selectivity on redundancy reduction, in Advances in Neural Information Processing Systems, MIT Press, vol. 21, pp. 1521–1528.
18.18. Sinz, F. and Bethge, M. (2008) The conjoint effect of divisive normalization and orientation selectivity on redundancy reduction, in Advances in Neural Information Processing Systems, MIT Press, vol. 21, pp. 1521–1528.
19.19. Sinz, F. and Bethge, M. (2010) ![]() -nested symmetric distributions. J. Mach. Learn. Res., 11, 3409–3451.
-nested symmetric distributions. J. Mach. Learn. Res., 11, 3409–3451.
20.20. Schwartz, O. and Simoncelli, E.P. (2001) Natural signal statistics and sensory gain control. Nat. Neurosci., 4 (8), 819–825.
21.21. Heeger, D.J. (1992) Normalization of cell responses in cat striate cortex. Visual Neurosci., 9, 181–197.
22.22. Olshausen, B.A. and Field, D.J. (1997) Sparse coding with an overcomplete basis set: a strategy employed by V1. Vision Res., 37, 3311–3325.
23.23. Theis, L., Sohl-Dickstein, J., Bethge, M. (2012) Training sparse natural image models with a fast Gibbs sampler of an extended state space, in Advances in Neural Information Processing Systems, MIT Press, vol. 25, pp. 1133–1141.
24.24. Hyvärinen, A. and Hoyer, P. (1999) Emergence of topography and complex cell properties from natural images using extensions of ICA, in Advances in Neural Information Processing Systems, MIT Press, pp. 827–833.
25.25. Hyvärinen, A. and Köster, U. (2007) Complex cell pooling and the statistics of natural images. Netw. Comput. Neural Syst., 18 (2), 81–100.
26.26. Hinton, G.E. (2002) Training products of experts by minimizing contrastive divergence. Neural Comput., 14 (8), 1771–1800.
27.27. Welling, M., Hinton, G., and Osindero, S. (2003) Learning sparse topographic representations with products of student-t distributions, in Advances in Neural Information Processing Systems, MIT Press, vol. 15, pp. 1383–1390.
28.28. Teh, Y.W., Welling, M., Osindero, S., and Hinton, G.E. (2003) Energy-based models for sparse overcomplete representations. J. Mach. Learn. Res., 4, 1235–1260.
29.29. Heess, N., Le Roux, N., and Winn, J. (2011) Weakly supervised learning of foreground-background segmentation using masked RBMs, in Artificial Neural Networks and Machine Learning, Springer-Verlag, pp. 9–16.
30.30. Roth, S. and Black, M.J. (2005) Fields of experts: a framework for learning image priors. IEEE Computer Society Conference on Computer Vision and Pattern Recognition, 2005. CVPR 2005, pp. 860–867.
31.31. Roth, S. and Black, M.J. (2009) Fields of experts. Int. J. Comput. Vision, 82 (2), 205–229.
32.32. Theis, L., Gerwinn, S., Sinz, F., and Bethge, M. (2011) In all likelihood, deep belief is not enough. J. Mach. Learn. Res., 12, 3071–3096.
33.33. Zoran, D. and Weiss, Y. (2011) From learning models of natural image patches to whole image restoration. 2011 IEEE International Conference on Computer Vision (ICCV), pp. 479–486.
34.34. Guerrero-Colon, J., Simoncelli, E., and Portilla, J. (2008) Image denoising using mixtures of Gaussian scale mixtures. 15th IEEE International Conference on Image Processing, 2008. ICIP 2008, pp. 565–568.
35.35. Karklin, Y. and Lewicki, M.S. (2009) Emergence of complex cell properties by learning to generalize in natural scenes. Nature, 457 (7225), 83–86, http://www.ncbi.nlm.nih.gov/pubmed/19020501, doi: 10.1038/nature07481.
36.36. Theis, L., Hosseini, R., and Bethge, M. (2012) Mixtures of conditional Gaussian scale mixtures applied to multiscale image representations. PLoS ONE, 7 (7), doi: 10.1371/journal.pone.0039857.
37.37. Hosseini, R., Sinz, F., and Bethge, M. (2010) Lower bounds on the redundancy of natural images. Vision Res., 50 (22), 2213–2222.
38.38. Domke, J., Karapurkar, A., and Aloimonos, Y. (2008) Who killed the directed model? IEEE Computer Society Conference on Computer Vision and Pattern Recognition, doi: 10.1109/CVPR.2008.4587817.
39.39. Uria, B., Murray, I., and Larochelle, H. (2013) RNADE: the real-valued neural autoregressive density-estimator. Advances in Neural Information Processing Systems, MIT Press, vol. 26, pp. 2175–2183.
40.40. Naka, K.I. and Rushton, W.A. (1966) S-potentials from colour units in the retina of fish. J. Physiol., 185, 536–555.
41.41. Norman, R.A. and Werblin, F.S. (1974) Control of retinal sensitivity. I. Light and dark adaptation of vertebrate rods and cones. J. Gen. Physiol., 63, 37–61.
42.42. Hosseini, R., Sinz, F., and Bethge, M. (2010) New estimate for the redundancy of natural images, doi: 10.3389/conf.fncom.2010.51.00006.
43.43. Gerhard, H.E., Wichmann, F.A., and Bethge, M. (2013) How sensitive is the human visual system to the local statistics of natural images? PLoS Comput. Biol., 9 (1), doi: doi/10.1371/journal.pcbi.1002873.
44.44. Heess, N., Williams, C.K.I., and Hinton, G.E. (2009) Learning generative texture models with extended fields-of-experts. British Machine Vision Conference.
45.45. Buades, A., Coll, B., and Morel, J. (2005) A non-local algorithm for image denoising. IEEE Conference on Computer Vision and Pattern Recognition, vol. 2, pp. 60–65.
46.46. Mairal, J., Bach, F., Ponce, J., Sapiro, G., and Zisserman, A. (2009) Non-local sparse models for image restoration. 2009 IEEE 12th International Conference on Computer Vision, pp. 2272–2279.
47.47. Brodatz, P. (1966) Textures: A Photographic Album for Artists and Designers, Dover Publications, New York.
48.48. Laughlin, S. (1981) A simple coding procedure enhances a neuron's information capacity. Z. Naturforsch. C, 36 (910), 910–912.
49.49. Doi, E., Gauthier, J.L., Field, G.D., Shlens, J., Sher, A., Greschner, M., Machado, T.A., Jepson, L.H., Mathieson, K., Gunning, D.E., Litke, A.M., Paninski, L., Chichilnisky, E.J., and Simoncelli, E.P. (2012) Efficient coding of spatial information in the primate retina. J. Neurosci., 32 (46), 16 256–16 264.
50.50. Dan, Y., Atick, J.J., and Reid, R.C. (1996) Efficient coding of natural scenes in the lateral geniculate nucleus: experimental test of a computational theory. J. Neurosci., 16 (10), 3351–3362.
51.51. Berkes, P., Orbán, G., Lengyel, M., and Fiser, J. (2011) Spontaneous cortical activity reveals hallmarks of an optimal internal model of the environment. Science, 331 (6013), 83–87.
52.52. Vinje, W.E. and Gallant, J.L. (2000) Sparse coding and decorrelation in primary visual cortex during natural vision. Science, 287 (5456), 1273–1276.
53.53. Froudarakis, E., Berens, P., Ecker, A.S., Cotton, R.J., Sinz, F.H., Yatsenko, D., Saggau, P., Bethge, M., and Tolias, A.S. (2014) Population code in mouse V1 facilitates read-out of natural scenes through increased sparseness. Nat. Neurosci., 17, 851–857.
54.54. Tkačik, G., Garrigan, P., Ratliff, C., Milčinski, G., Klein, J.M., Seyfarth, L.H., Sterling, P., Brainard, D.H., and Balasubramanian, V. (2011) Natural images from the birthplace of the human eye. PLoS ONE, 6 (6), e20 409, doi: 10.1371/journal.pone.0020409.
55.55. Wiebe, M. (2014) Freedom Tower, https://goo.gl/Egh9jx.
56.56. Krizhevsky, A., Sutskever, I., and Hinton, G. (2012) Imagenet classification with deep convolutional neural networks, in Advances in Neural Information Processing Systems, MIT Press, vol. 25, pp. 1097–1105.
57.57. Zeiler, M.D. and Fergus, R. (2013) Visualizing and understanding convolutional networks, arXiv.org, abs/1311.2901.
All materials on the site are licensed Creative Commons Attribution-Sharealike 3.0 Unported CC BY-SA 3.0 & GNU Free Documentation License (GFDL)
If you are the copyright holder of any material contained on our site and intend to remove it, please contact our site administrator for approval.
© 2016-2026 All site design rights belong to S.Y.A.