The Android Developer’s Cookbook: Building Applications with the Android SDK, Second Edition (2013)
Chapter 16. Debugging
Debugging software can easily take as long as or longer than the development itself. Understanding the different ways to debug common problems can save a lot of time and effort. This chapter introduces the basic approach of debugging Android applications, and it examines the many tools available. First, the common Eclipse IDE debugging tools are discussed. Then, the Android tools provided from the Android SDK are discussed. Finally, the tools available on the Android system are discussed. Each application is different, so the appropriate debugging methodology depends on the characteristics of the application itself.
Android Test Projects
The Android testing framework gives developers a set of tools that can be used for application testing. The testing suites for Android are based on JUnit. Those familiar with JUnit will take comfort in knowing that it can be used to test classes of a project that do not extend Android components. An Eclipse installation that contains Android Development Tools (ADT) will already have all of the tools needed to create test suites. Without Eclipse or ADT, tests can be created using the android command-line tool.
Test projects are created as stand-alone projects that use instrumentation to connect to the application that will be tested.
Recipe: Creating a Test Project
It is strongly recommended that test projects be created using Eclipse, as all of the tooling required to set up a test (including directory structure) is built in.
To get started from Eclipse, choose File → New → Other from the menu. In the wizard that appears, choose the Android section and click on Android Test Project, then click the Next button. Figure 16.1 shows the New Project wizard.
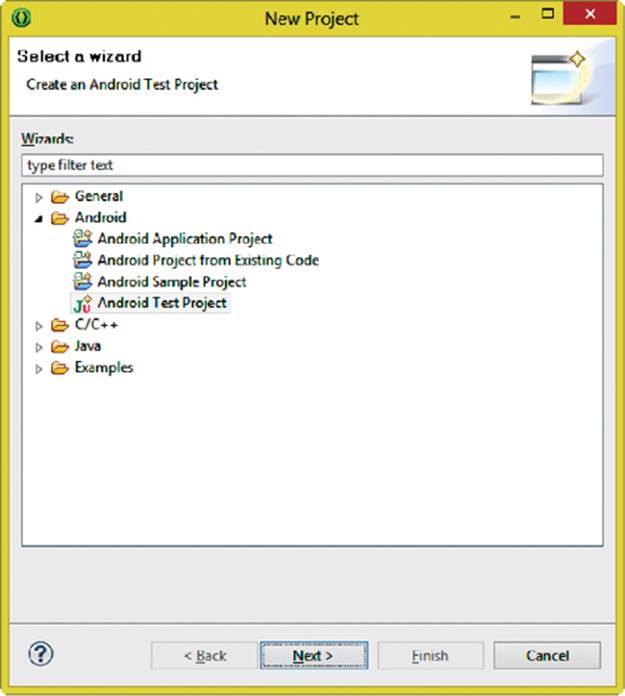
Figure 16.1 New Project wizard
In the Project Name field, choose a name that is suitable to what the test will be for. This can be as simple as the name of the application to be tested with the word Test appended to it, or it may be as complex as what type of testing the application will do and for what project. For this project, the name HelloWorldTest will be used. The location of where the project will be stored may be changed. Use the default settings and click the Next button. Figure 16.2 shows the naming step of the project.
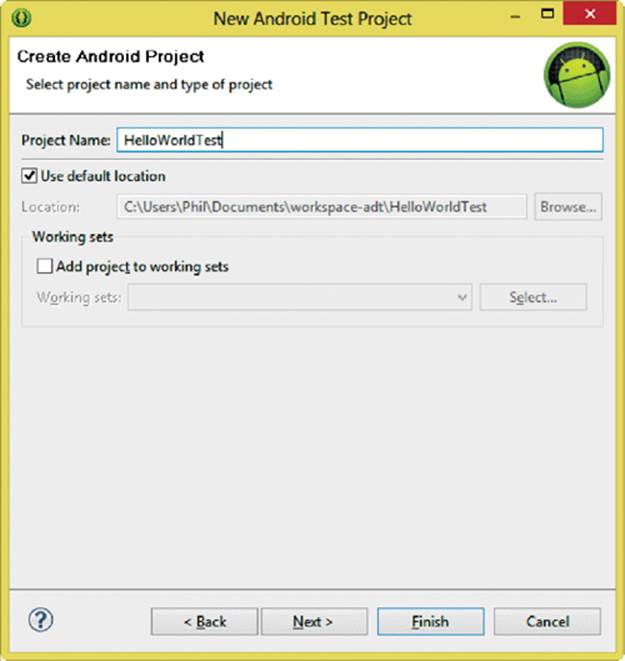
Figure 16.2 Naming the test project
The next step of the wizard allows a choice of the target project with which the test project will be working. If multiple projects are open, make sure to select the right one. Figure 16.3 shows an example target of MainActivity, which is the only project open in this Eclipse workspace.
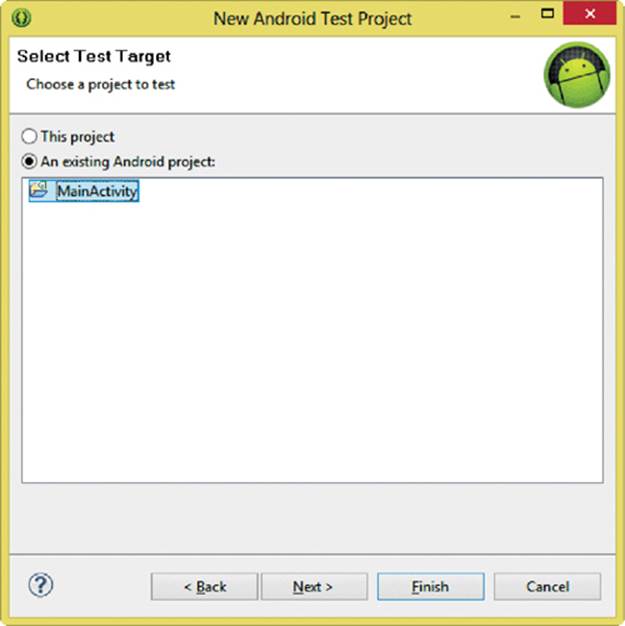
Figure 16.3 Choosing the target project
To pick a specific build level as a target, click the Next button and choose from a list. Figure 16.4 shows the build target portion of the wizard. If there is no specific build level to test, click the Finish button.
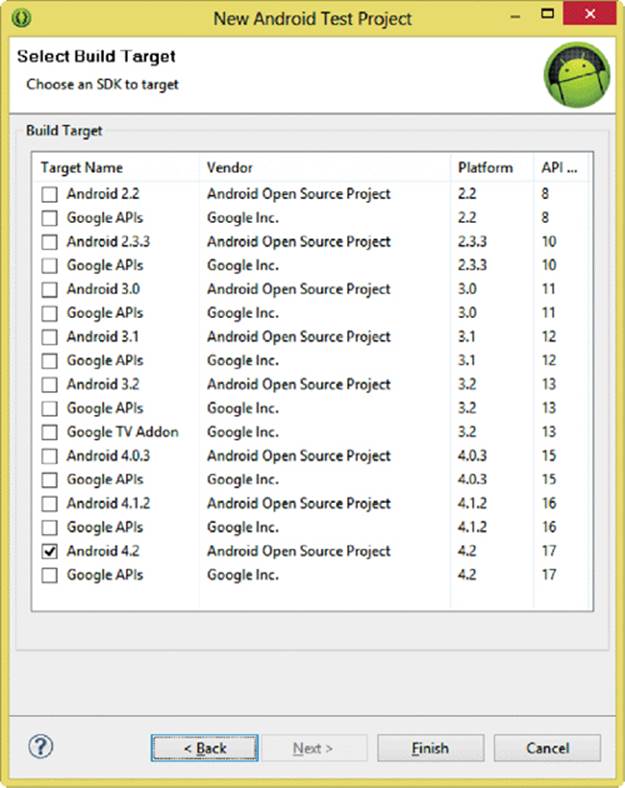
Figure 16.4 Selecting a target API level to fine-tune testing
Recipe: Populating Unit Tests on Android
Once a test project has been created, it is time to populate it with the tests to be run. This is done by adding classes to the test package, which is found under src/com.yourtargetproject.projectname.test, where com.yourtargetproject.projectname refers to the package name of the target project. For the superclass, put in ActivityInstrumentationTestCase2<MainActivity>, where MainActivity is the name of the activity in the target project to be used. ActivityInstrumentationTestCase2 is a testing class that is used to test a single activity.
When the class has been created, use an import for the activity to be tested and add a test case constructor. The constructor should be set up as follows:
public HelloWorldTest(Class<MainActivity> activityClass) {
super(activityClass);
}
The setUp() method is used for every test and is used to set variables and run any cleanup from previous tests. For those familiar with JUnit testing, it is worth mentioning that the tearDown() method can also be used. Listing 16.1 is a skeleton that can be used to create and use the setUp()method:
Listing 16.1. Maintenance Methods Used in Testing
protected void setUp() throws Exception {
super.setUp();
setActivityInitialTouchMode(false);
mActivity = getActivity();
// Test something in the activity by using mActivity.findViewById()
}
protected void tearDown() throws Exception {
super.tearDown();
}
Note that setActivityInitialTouchMode(false) must be used in order to use the setUp() method.
After the test values have been added, the test can be run by right-clicking on the test project and selecting Run As → Android JUnit Test. This will open up the JUnit view, which will display how the test performs, including runs, errors, failures, and a summary.
Recipe: Using Robotium
Robotium is a utility that helps developers write and execute various tests. To start using it, first download the .jar file from http://code.google.com/p/robotium/downloads/list and then include it in the test project (at the time of writing, the most current .jar is robotium-solo-3.6.jar).
To include it in a project, create a folder named libs at the root of the project and put the robotium-solo.3.6.jar file there. In Eclipse, refresh the project to make sure that the changes have been picked up. Navigate to the folder and right-click on the robotium-solo.3.6.jar file. In the context menu, click on Build Path → Add to Build Path.
If the .jar file is to be stored in a separate location, open the properties of the test project and choose Java Build Path and then click on Add (external) Jar. This will allow finding the .jar file and including it in a project.
After the .jar file has been added, open the class file being used for the test project. Inside this file, add the following import:
import com.jayway.android.robotium.solo.Solo;
Then, add a new variable:
private Solo solo;
The solo object is the main way to interact with Robotium; it contains all of the methods needed for testing. Then, add the following to the setUp() method:
solo = new Solo(getInstrumentation(), getActivity());
Now that the solo object has been initialized, it can be used in custom functions for testing.
The following is a sample function taken from the Robotium sample test project that shows how the solo object is used to perform testing:
public void testMenuSave() throws Exception {
solo.sendKey(Solo.MENU);
solo.clickOnText("More");
solo.clickOnText("Prefs");
solo.clickOnText("Edit File Extensions");
Assert.assertTrue(solo.searchText("rtf"));
solo.clickOnText("txt");
solo.clearEditText(2);
solo.enterText(2, "robotium");
solo.clickOnButton("Save");
solo.goBack();
solo.clickOnText("Edit File Extensions");
Assert.assertTrue(solo.searchText("application/robotium"));
}
More information about Robotium and an in-depth tutorial can be found at http://code.google.com/p/robotium/wiki/RobotiumTutorials.
Eclipse Built-In Debug Tools
The Eclipse IDE included with the ADT plugin is a user-friendly development environment. It includes a what-you-see-is-what-you-get (WYSIWYG) user interface and the tools needed to convert resource layout files into the necessary ingredients to build an Android executable. A step-by-step guide to setting up the configuration is included in the following recipe. The ADT version of Eclipse (3.7 Indigo as of this writing) is assumed, although most steps are the same between Eclipse versions.
Recipe: Specifying a Run Configuration
The run configuration is a separate profile for each application. It tells Eclipse how to run the project and start the activity and whether to install the application on the emulator or a connected device. The ADT automatically creates a run configuration for each application when it is first created, but it can be customized as described in this recipe.
To create a new run configuration or edit an existing one, select Run → Run Configurations... (or Debug Configurations...) in Eclipse to launch the Run Configurations menu shown in Figure 16.5. Inside the run configuration, there are three tabs related to application testing, which contain settings that must be set:
![]() Android—Specify the project and activity to launch.
Android—Specify the project and activity to launch.
![]() Target—Select the virtual device upon which the application will run. For the emulator environment, the launch parameters are specified here, such as the network speed and latency. This allows for a more realistic simulation of the wireless link conditions to test how the application behaves. Developers can also choose to wipe out the persistent storage of the emulator with every launch.
Target—Select the virtual device upon which the application will run. For the emulator environment, the launch parameters are specified here, such as the network speed and latency. This allows for a more realistic simulation of the wireless link conditions to test how the application behaves. Developers can also choose to wipe out the persistent storage of the emulator with every launch.
![]() Common—Specify where the run configuration settings are saved and also whether the configuration is displayed in the Favorite menu.
Common—Specify where the run configuration settings are saved and also whether the configuration is displayed in the Favorite menu.
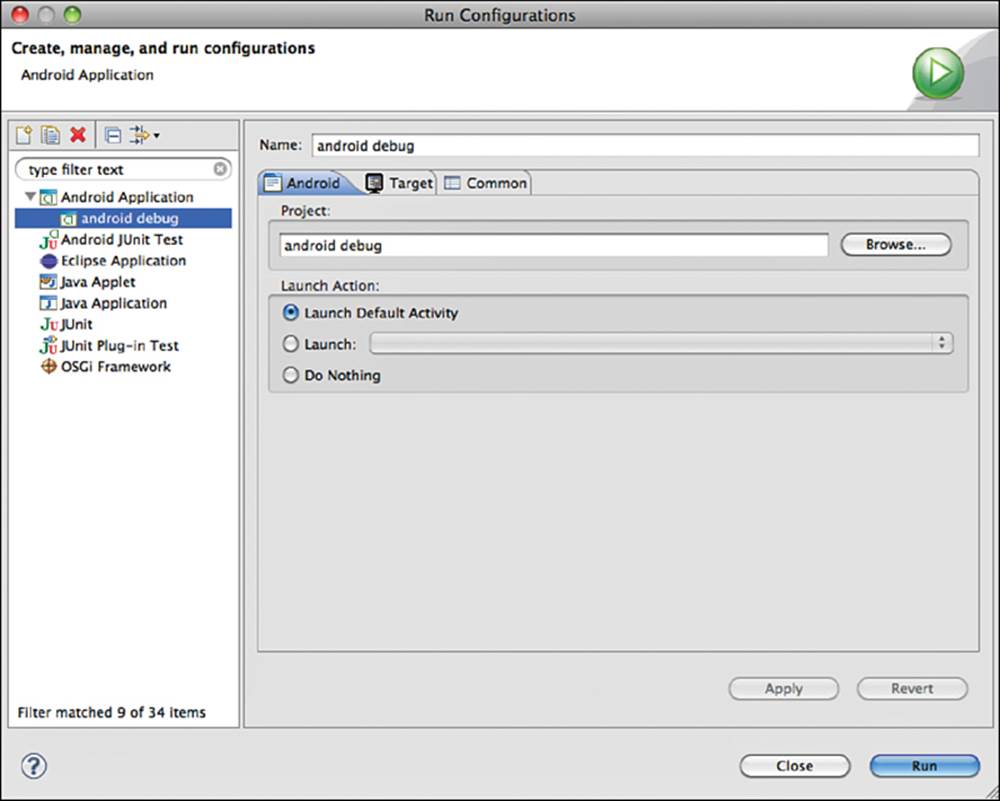
Figure 16.5 The Run Configurations menu in Eclipse
After these settings are properly set, the application can be run on the target device with a single click of the Run button. If an actual Android device is not connected to the host computer or the target chosen is a virtual device, the emulator is launched to run the application.
Recipe: Using the DDMS
After the application is run on a target, the Dalvik Debug Monitoring Server (DDMS) can be opened to examine the status of the device, as shown in Figure 16.6. DDMS can be run from the command line or by selecting Window → Open Perspective → DDMS in Eclipse.
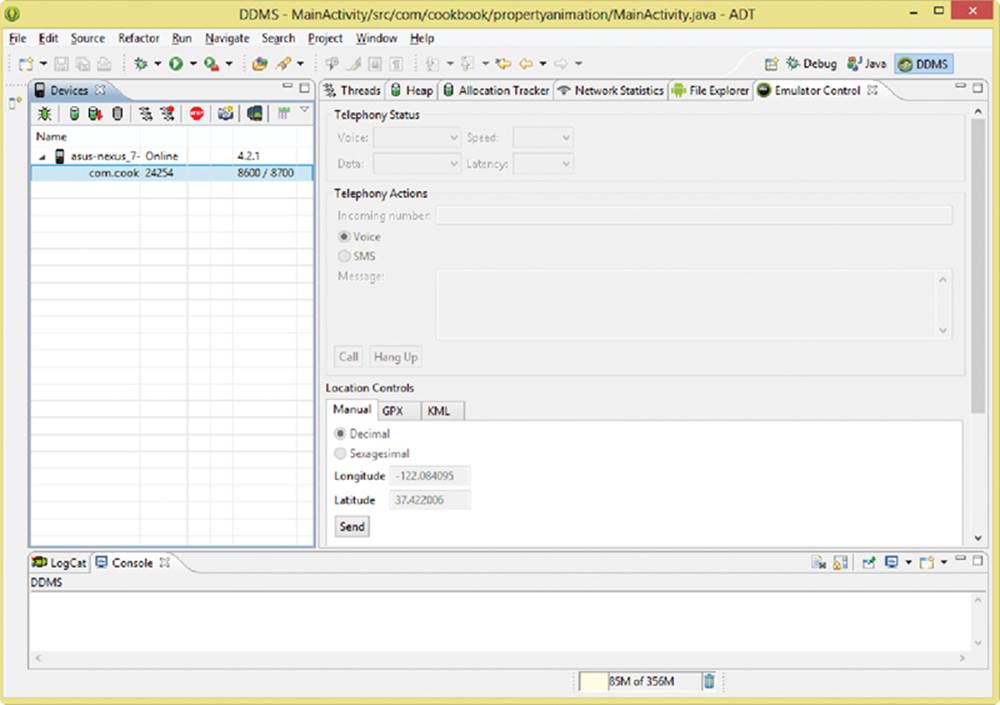
Figure 16.6 The DDMS control panel
Inside the DDMS are three panels that provide different kinds of debugging data:
![]() Devices—Displays the connected Android devices, including emulators and actual Android devices.
Devices—Displays the connected Android devices, including emulators and actual Android devices.
![]() Bottom panel—Contains two tabs: LogCat and Console. The LogCat tab shows all the logging data from the device in real time. It includes system log messages and user-generated log messages accessed using the Log class in applications. The Console tab may be familiar to Eclipse users, as this tab displays SystemOut messages as well as some errors during compilation or run-time.
Bottom panel—Contains two tabs: LogCat and Console. The LogCat tab shows all the logging data from the device in real time. It includes system log messages and user-generated log messages accessed using the Log class in applications. The Console tab may be familiar to Eclipse users, as this tab displays SystemOut messages as well as some errors during compilation or run-time.
![]() Top right panel—Contains six tabs: Threads, Heap, Allocation Tracker, Network Statistics, File Explorer, and the Emulator Control. These are mostly used to analyze the process and network bandwidth. The Emulator Control has several options for controlling voice and data format, network speed, and latency. It also contains options for creating fake phone calls (for testing), as well as GPS spoofing options to help with testing locations in the emulator. Clicking the device in the Devices tab can cause these four tabs to reflect the currently selected device/emulator’s running values, as shown in Figure 16.7.
Top right panel—Contains six tabs: Threads, Heap, Allocation Tracker, Network Statistics, File Explorer, and the Emulator Control. These are mostly used to analyze the process and network bandwidth. The Emulator Control has several options for controlling voice and data format, network speed, and latency. It also contains options for creating fake phone calls (for testing), as well as GPS spoofing options to help with testing locations in the emulator. Clicking the device in the Devices tab can cause these four tabs to reflect the currently selected device/emulator’s running values, as shown in Figure 16.7.
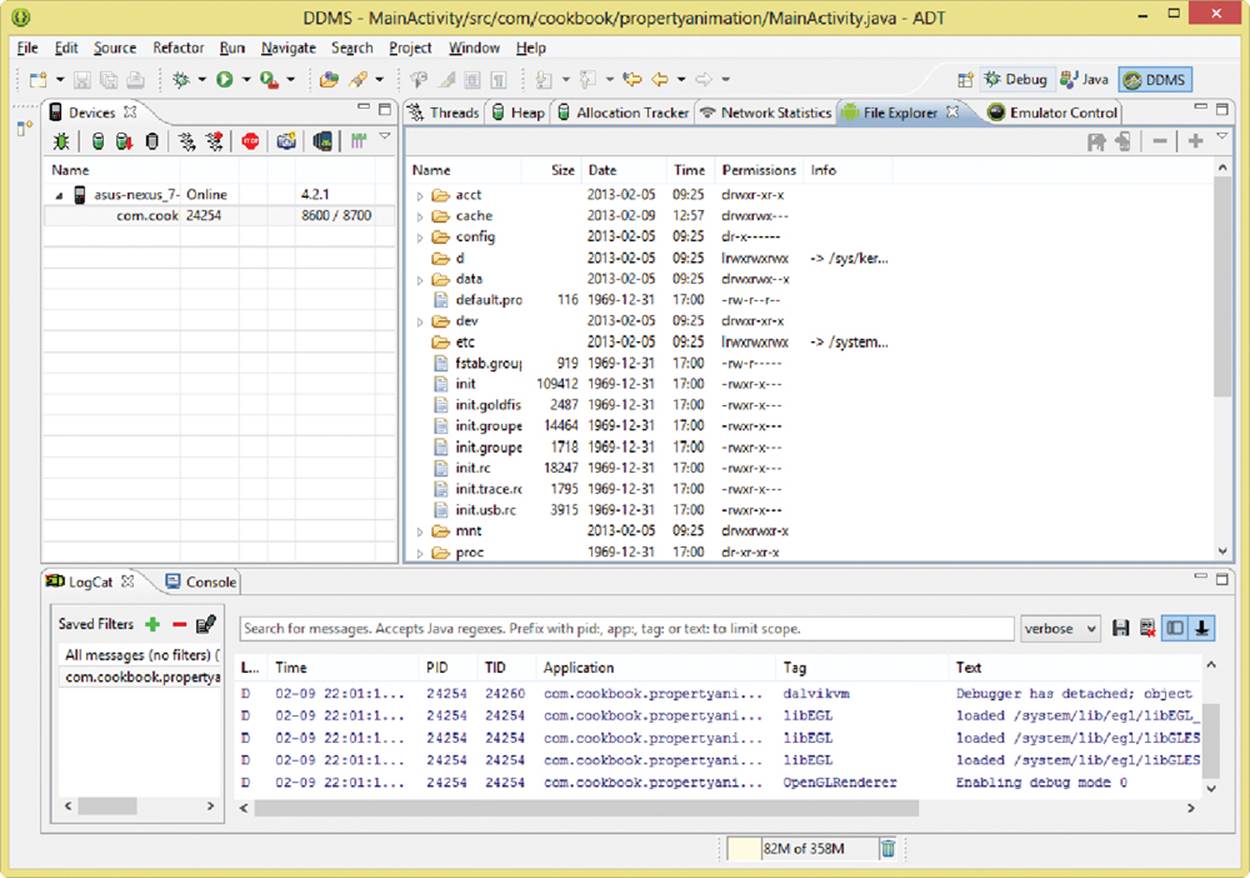
Figure 16.7 The DDMS control panel with the File Explorer, LogCat, and Devices panels open
Recipe: Debugging through Breakpoints
Developers can also run applications in debug mode and insert breakpoints to freeze an application in run-time. First, the application needs to be launched in debug mode, which displays the dialog shown in Figure 16.8. If “Yes” is selected, it switches to the Debug perspective shown inFigure 16.9.
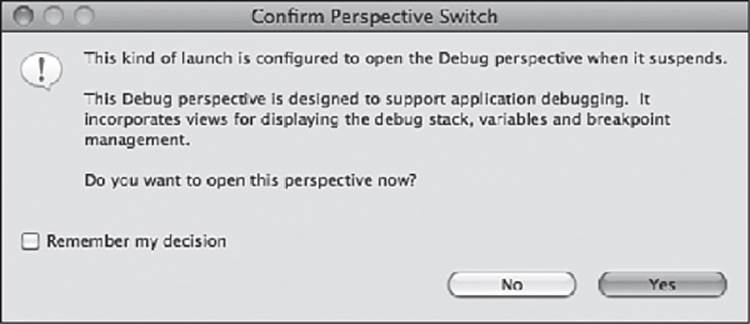
Figure 16.8 The Confirm Perspective Switch dialog box
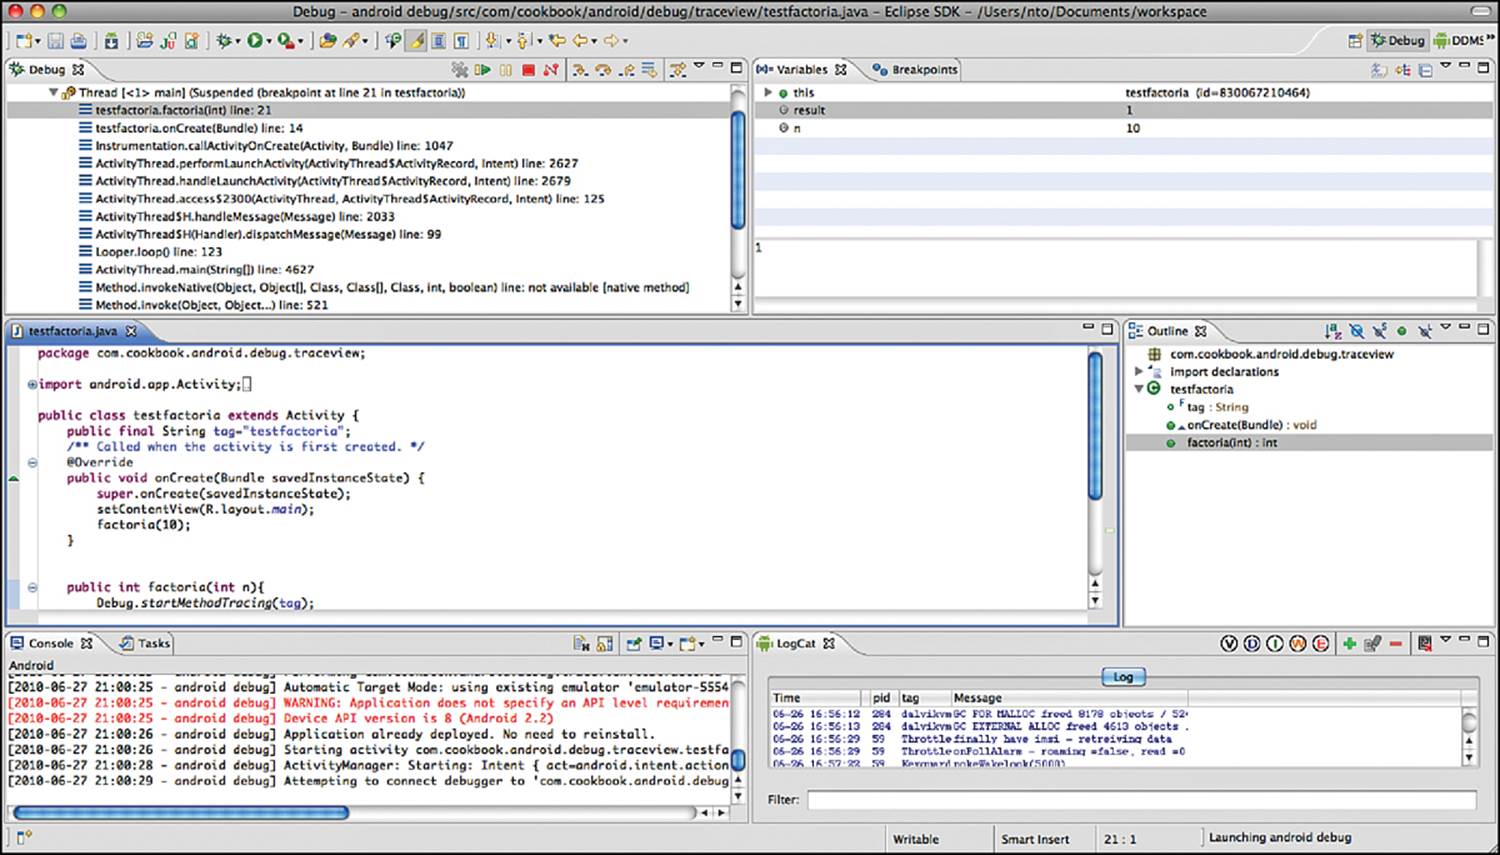
Figure 16.9 The Debug perspective in Eclipse
The Debug perspective displays the source file in a window along with some other windows, including Variables, Breakpoints, Outline, and others. Developers can toggle a breakpoint by double-clicking in the left-hand margin next to the line where the code execution should freeze. A breakpoint is set when a small blue circle is present on that line.
Using breakpoints is a standard debug method for embedded programmers. The ability to stop at an instruction, step through functions, see variable values in memory, and modify values in run-time provides a powerful method to chase down complicated bugs and unexpected behavior.
Android SDK Debug Tools
The Android SDK provides multiple stand-alone tools for debugging. The Android Debug Bridge, LogCat, Hierarchy Viewer, and TraceView tools are discussed in the following recipes. They can be found in the tools/ directory of the Android SDK installation.
Recipe: Starting and Stopping the Android Debug Bridge
The Android Debug Bridge (ADB) provides a way to manage the state of an emulator instance or USB-connected Android device. The ADB is built of three components: a client, a server, and a daemon. The client component is initiated by the adb shell script on the development machine. The server component runs as a background process on the development machine. This server can be started or stopped using one of the following commands:
> adb start-server
> adb kill-server
The daemon component is a background process that runs on the emulator or Android device.
Recipe: Using LogCat
LogCat is the real-time logging tool Android provides. It collects all system and application log data in circular buffers, which can then be viewed and filtered. It can be accessed as a stand-alone tool or as part of the DDMS tool.
LogCat can be used in the device after executing the adb shell to log in to the device or by using the logcat command through the adb:
> [adb] logcat [<option>] ... [<filter-spec>] ...
All the messages that use the android.util.Log class have an associated tag and priority. The tag should be meaningful and related to what the activity does. The tag and priority make the logging data easier to read and filter. Possible tags are:
![]() V—Verbose (lowest priority) displays as much information as possible in the logs.
V—Verbose (lowest priority) displays as much information as possible in the logs.
![]() D—Debug displays errors, information, and variable values.
D—Debug displays errors, information, and variable values.
![]() I—Info displays information only, such as a connection status.
I—Info displays information only, such as a connection status.
![]() W—Warning displays warning messages that are not necessarily errors but deserve attention.
W—Warning displays warning messages that are not necessarily errors but deserve attention.
![]() E—Error displays errors that occur during run-time.
E—Error displays errors that occur during run-time.
![]() F—Fatal displays information only when a crash occurs.
F—Fatal displays information only when a crash occurs.
![]() S—Silent is the highest priority, on which nothing is ever printed.
S—Silent is the highest priority, on which nothing is ever printed.
The logcat data has a multitude of information, and filters should be used to avoid overload by specifying the tag:priority argument to the logcat command:
> adb logcat ActivityManager:V *:S
This shows verbose (V) data on the ActivityManager while silencing (S) all other log commands.
A circular buffer system is used inside Android logging. By default, all information is logged to the main log buffer. There are two other buffers: one that contains radio/telephony-related messages and one that contains event-related messages. Different buffers can be enabled using the -bswitch:
> adb logcat -b events
This buffer also shows event-related messages:
I/menu_opened( 135): 0
I/notification_cancel( 74): [com.android.phone,1,0]
I/am_finish_activity( 74):
[1128378040,38,com.android.contacts/.DialtactsActivity,app-request]
I/am_pause_activity( 74):
[1128378040,com.android.contacts/.DialtactsActivity]
I/am_on_paused_called( 135): com.android.contacts.RecentCallsListActivity
I/am_on_paused_called( 135): com.android.contacts.DialtactsActivity
I/am_resume_activity( 74): [1127710848,2,com.android.launcher/.Launcher]
I/am_on_resume_called( 135): com.android.launcher.Launcher
I/am_destroy_activity( 74):
[1128378040,38,com.android.contacts/.DialtactsActivity]
I/power_sleep_requested( 74): 0
I/power_screen_state( 74): [0,1,468,1]
I/power_screen_broadcast_send( 74): 1
I/screen_toggled( 74): 0
I/am_pause_activity( 74): [1127710848,com.android.launcher/.Launcher]
Another example follows:
> adb logcat -b radio
This shows radio/telephony-related messages:
D/RILJ ( 132): [2981]< GPRS_REGISTRATION_STATE {1, null, null, 2}
D/RILJ ( 132): [2982]< REGISTRATION_STATE {1, null, null, 2, null, null,
null, null, null, null, null, null, null, null}
D/RILJ ( 132): [2983]< QUERY_NETWORK_SELECTION_MODE {0}
D/GSM ( 132): Poll ServiceState done: oldSS=[0 home T - Mobile T - Mo-
bile 31026 Unknown CSS not supported -1 -1RoamInd: -1DefRoamInd: -1]
newSS=[0 home T - Mobile T - Mobile 31026 Unknown CSS not supported -1 -
1RoamInd: -1DefRoamInd: -1] oldGprs=0 newGprs=0 oldType=EDGE newType=EDGE
D/RILJ ( 132): [UNSL]< UNSOL_NITZ_TIME_RECEIVED 10/06/26,21:49:56-28,1
I/GSM ( 132): NITZ: 10/06/26,21:49:56-28,1,237945599 start=237945602
delay=3
D/RILJ ( 132): [UNSL]< UNSOL_RESPONSE_NETWORK_STATE_CHANGED
D/RILJ ( 132): [2984]> OPERATOR
D/RILJ ( 132): [2985]> GPRS_REGISTRATION_STATE
D/RILJ ( 132): [2984]< OPERATOR {T - Mobile, T - Mobile, 31026}
D/RILJ ( 132): [2986]> REGISTRATION_STATE
D/RILJ ( 132): [2987]> QUERY_NETWORK_SELECTION_MODE
D/RILJ ( 132): [2985]< GPRS_REGISTRATION_STATE {1, null, null, 2}
D/RILJ ( 132): [2986]< REGISTRATION_STATE {1, null, null, 2, null, null,
null, null, null, null, null, null, null, null}
D/RILJ ( 132): [2987]< QUERY_NETWORK_SELECTION_MODE {0}
LogCat is useful when using Java-based Android applications. However, when applications involve native components, it is harder to trace. In this case, the native components should log to System.out or System.err. By default, the Android system sends stdout and stderr (system.out andsystem.err) output to /dev/null. These can be routed to a log file with the following ADB commands:
> adb shell stop
> adb shell setprop log.redirect-stdio true
> adb shell start
This stops a running emulator/device instance; use the shell command setprop to enable the redirection of output and restart the instance.
Recipe: Using the Hierarchy Viewer
A useful way to debug and understand the user interface is by using the Hierarchy Viewer. It provides a visual representation of the layout’s view hierarchy and a magnified inspector of the display (shown in the Pixel Perfect window). Please note that while the Hierarchy Viewer can still be used, many of the features it contained have been moved into the Android Debug Monitor, which also contains the DDMS.
The Hierarchy Viewer is accessed using the tool hierarchyviewer. Executing this program launches the interface shown in Figure 16.10. It displays a list of Android devices that are currently connected to the development machine. When a device is selected, a list of running programs on the device is shown. It is then possible to select the program intended for debug or user interface optimization.
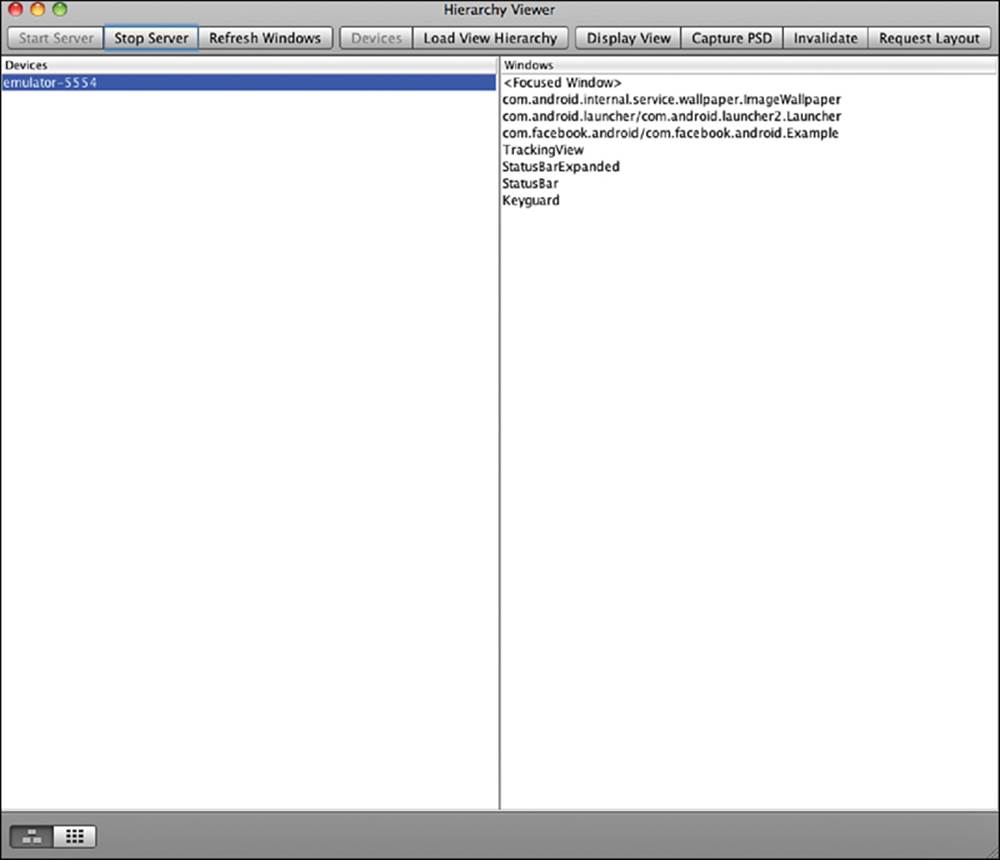
Figure 16.10 The Hierarchy Viewer tool
After the program is selected, Load View Hierarchy can be selected to see the View Tree constructed by the Hierarchy Viewer. It contains four views:
![]() Tree View pane—A hierarchy diagram of the views on the left
Tree View pane—A hierarchy diagram of the views on the left
![]() Tree Overview pane—A bird’s-eye view of the hierarchy diagram
Tree Overview pane—A bird’s-eye view of the hierarchy diagram
![]() Properties View pane—A list of the selected view’s properties on the top right
Properties View pane—A list of the selected view’s properties on the top right
![]() Layout View pane—A wire-frame drawing of the layout on the bottom right
Layout View pane—A wire-frame drawing of the layout on the bottom right
This is shown in Figure 16.11.
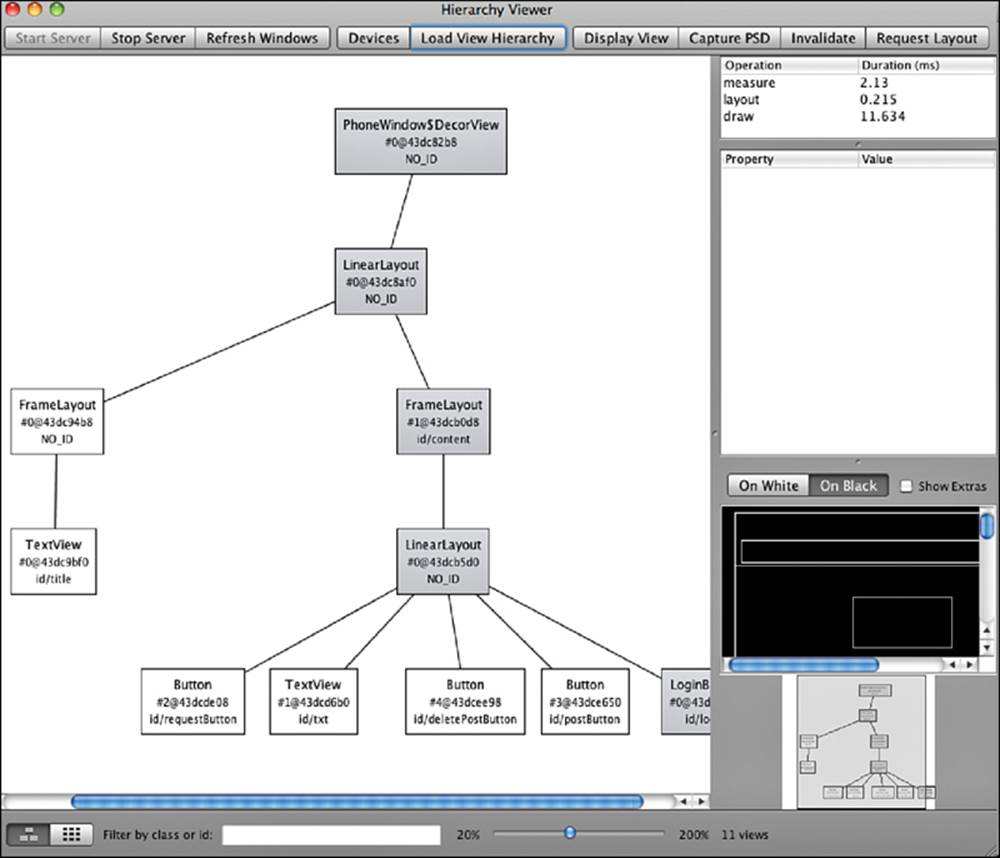
Figure 16.11 The Layout View in the Hierarchy Viewer tool
These four views are used to display different information about the hierarchy to help optimize the UI. When one node of the view is selected, the properties view and wire-frame view are updated. In an Android system, there is a limitation on the View Tree that each application can generate. The depth of the tree cannot be deeper than 10 and the width of the tree cannot be broader than 50. In Android 1.5 or earlier, a stack overflow exception is thrown when the View Tree passes that limit. Although it is good to know the limitations, a shallow layout tree always makes applications run faster and smoother. This can be accomplished using merge or RelativeLayout instead of LinearLayout to optimize the View Tree.
Recipe: Using TraceView
TraceView is a tool to optimize performance. To leverage this tool, the Debug class needs to be implemented in the application. It creates log files containing the trace information for analysis. This recipe specifies a factorial method and another method that calls the factorial method. Listing 16.2 shows the main activity.
Listing 16.2. src/com/cookbook/android/debug/traceview/TestFactorial.java
package com.cookbook.android.debug.traceview;
import android.app.Activity;
import android.os.Bundle;
import android.os.Debug;
public class TestFactorial extends Activity {
public final String tag="testfactorial";
@Override
public void onCreate(Bundle savedInstanceState) {
super.onCreate(savedInstanceState);
setContentView(R.layout.main);
factorial(10);
}
public int factorial(int n) {
Debug.startMethodTracing(tag);
int result=1;
for(int i=1; i<=n; i++) {
result*=i;
}
Debug.stopMethodTracing();
return result;
}
}
The factorial() method contains two calls to the Debug class; the trace is started in a file called testfactorial.trace when startMethodTracing() is called. When the stopMethodTracing() method is called, the system continues buffering the generated trace data. After the methodfactorial(10) returns, the trace file should be generated and saved in /sdcard/. After the file is generated, it can be retrieved to the development machine using the following command:
> adb pull /sdcard/testfactorial.trace
The traceview tool in the Android SDK tools folder can then be used to analyze the trace file:
> traceview testfactorial.trace
After the script command is run, it produces an analysis screen, as shown in Figure 16.12.
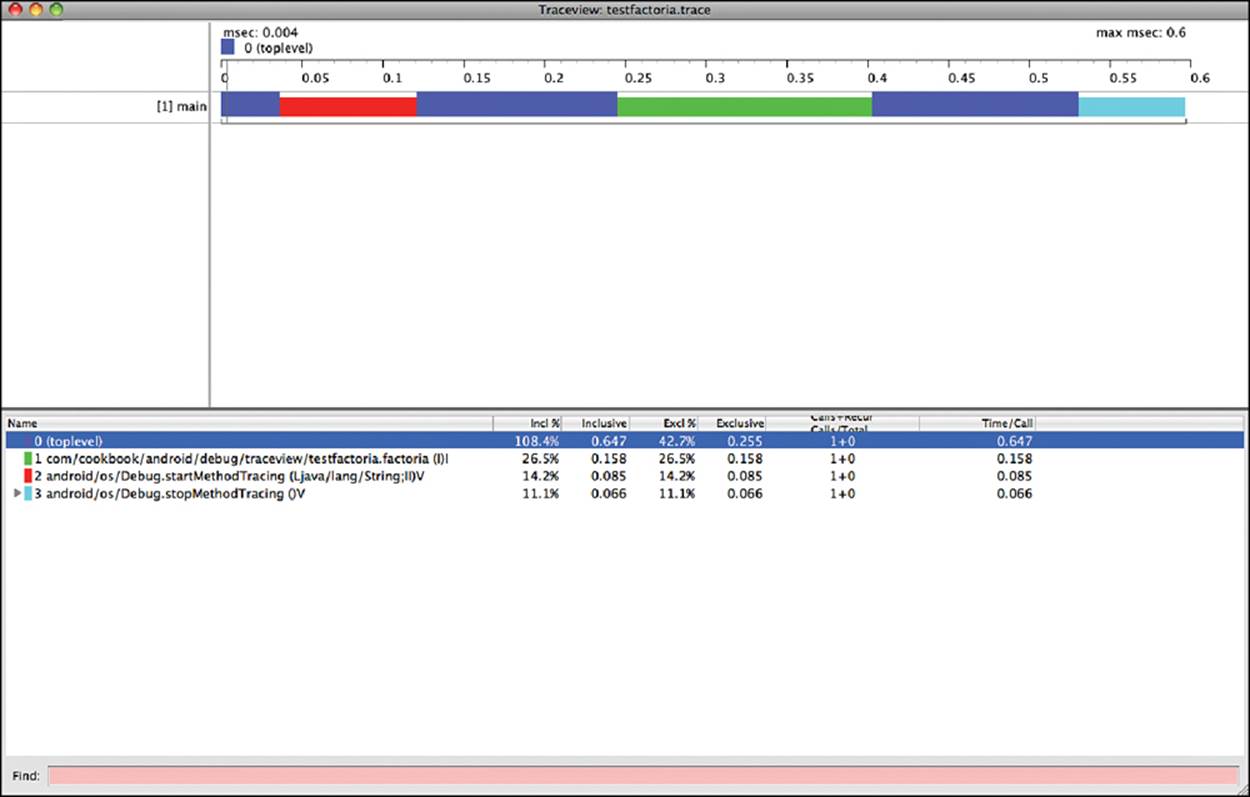
Figure 16.12 The TraceView analysis screen
The screen shows a Timeline Panel and a Profile Panel. The Timeline Panel on the top half of the screen describes when each thread and method started and stopped. The Profile Panel on the bottom half of the screen provides a summary of what happened inside the factorial method. When the cursor is moved around in the Timeline Panel, it displays the time when the tracing started, when the method was called, and when the tracing ended.
The Profile Panel shows a summary of all the time spent in the factorial method. The panel also shows both the inclusive and exclusive times (in addition to the percentage of the total time). Exclusive time is the time spent in the method. Inclusive time is the time spent in the method plus the time spent in any called functions.
The *.trace file is constructed by a data file and a key file. The data file is used to hold the trace data. The key file provides a mapping from binary identifiers to thread and method names. If an older version of TraceView is used, the key file and data file need to be combined into a trace file manually.
There is another way to generate a graphical call-stack diagram from trace log files in Android: dmtracedump. This tool requires the installation of the third-party Graphviz dot utility to create the graphical output.
Recipe: Using lint
lint is a tool that has been included with ADT from version 16 and beyond. This is run automatically inside Eclipse and is responsible for validating code by highlighting it when it may not function as expected or when it will fail upon compilation. For developers who are not using Eclipse and would prefer to run lint on projects from the command line, this can be done by running lint from the tools directory inside the SDK installation directory.
The following is an example of running lint from the command line. Note that this was done in the command line of Windows, so the slashes may need to be adjusted when running on different platforms. Also, when running from the command prompt, the lines will automatically be broken and may appear exactly as follows:
lint \temp\PropertyAnimation
Scanning PropertyAnimation: . . . . . . . . . . . . .
Scanning PropertyAnimation (Phase 2): . . . . . . . .
src\com\cookbook\propertyanimation\MainActivity.java:32: Error: Call requires API level 11 (current min is 8): android.animation.ObjectAnimator#ofInt [NewApi]
ValueAnimator va = ObjectAnimator.ofInt(btnShift, "backgroundColor", start, end);
~~~~~
src\com\cookbook\propertyanimation\MainActivity.java:32: Error: Class requires API level 11 (current min is 8): android.animation.ValueAnimator [NewApi]
ValueAnimator va = ObjectAnimator.ofInt(btnShift, "backgroundColor", start, end);
~~~~~~~~~~~~~
src\com\cookbook\propertyanimation\MainActivity.java:33: Error: Call requires API level 11 (current min is 8): android.animation.ValueAnimator#setDuration [NewApi]
va.setDuration(750);
~~~~~~~~~~~
src\com\cookbook\propertyanimation\MainActivity.java:34: Error: Call requires API level 11 (current min is 8): android.animation.ValueAnimator#setRepeatCount [NewApi]
va.setRepeatCount(1);
~~~~~~~~~~~~~~
src\com\cookbook\propertyanimation\MainActivity.java:35: Error: Call requires API level 11 (current min is 8): android.animation.ValueAnimator#setRepeatMode [NewApi]
va.setRepeatMode(ValueAnimator.REVERSE);
~~~~~~~~~~~~~
src\com\cookbook\propertyanimation\MainActivity.java:36: Error: Call requires API level 11 (current min is 8): android.animation.ValueAnimator#setEvaluator [NewApi]
va.setEvaluator(new ArgbEvaluator());
~~~~~~~~~~~~
src\com\cookbook\propertyanimation\MainActivity.java:36: Error: Call requires API level 11 (current min is 8): new android.animation.ArgbEvaluator [NewApi]
va.setEvaluator(new ArgbEvaluator());
~~~~~~~~~~~~~
src\com\cookbook\propertyanimation\MainActivity.java:37: Error: Call requires API level 11 (current min is 8): android.animation.ValueAnimator#start [NewApi]
va.start();
~~~~~
res\menu\activity_main.xml: Warning: The resource R.menu.activity_main appears to be unused [UnusedResources]
res\values\strings.xml:5: Warning: The resource R.string.hello_world appears to be unused [UnusedResources]
<string name="hello_world">Hello world!</string>
~~~~~~~~~~~~~~~~~~
res\layout\activity_main.xml:13: Warning: [I18N] Hardcoded string "Rotate", should use @string resource [HardcodedText]
android:text="Rotate" />
~~~~~~~~~~~~~~~~~~~~~
res\layout\activity_main.xml:21: Warning: [I18N] Hardcoded string "Shift", should use @string resource [HardcodedText]
android:text="Shift" />
~~~~~~~~~~~~~~~~~~~~
res\layout\activity_main.xml:29: Warning: [I18N] Hardcoded string "Sling Shot", should use @string resource [HardcodedText]
android:text="Sling Shot" />
~~~~~~~~~~~~~~~~~~~~~~~~~
8 errors, 5 warnings
As you can see from this output, this particular project has several errors that will need to be corrected, as well as five warnings or suggestions for how it could better follow standards.
Developers may wish to force lint to skip some requirement checks by passing –disable, followed by what type of errors or warnings are to be skipped. For example, if possible unused resources, unused IDs, and hard-coded text were not concerns, the command could be changed to the following:
lint –disable UnusedResources,UnusedIds,HardcodedText \temp\PropertyAnimation
Due to all of the warnings being disabled, the only thing the command will return now is the errors that need to be fixed.
Android System Debug Tools
Android is built on top of Linux, so many Linux tools can be leveraged. For example, to show the applications currently running and the resources they are using, the top command can be used. The following command can be issued at the command line when a device is connected to a host computer through a USB cable or when the emulator is running:
> adb shell top
An example output from this command is shown in Figure 16.13.
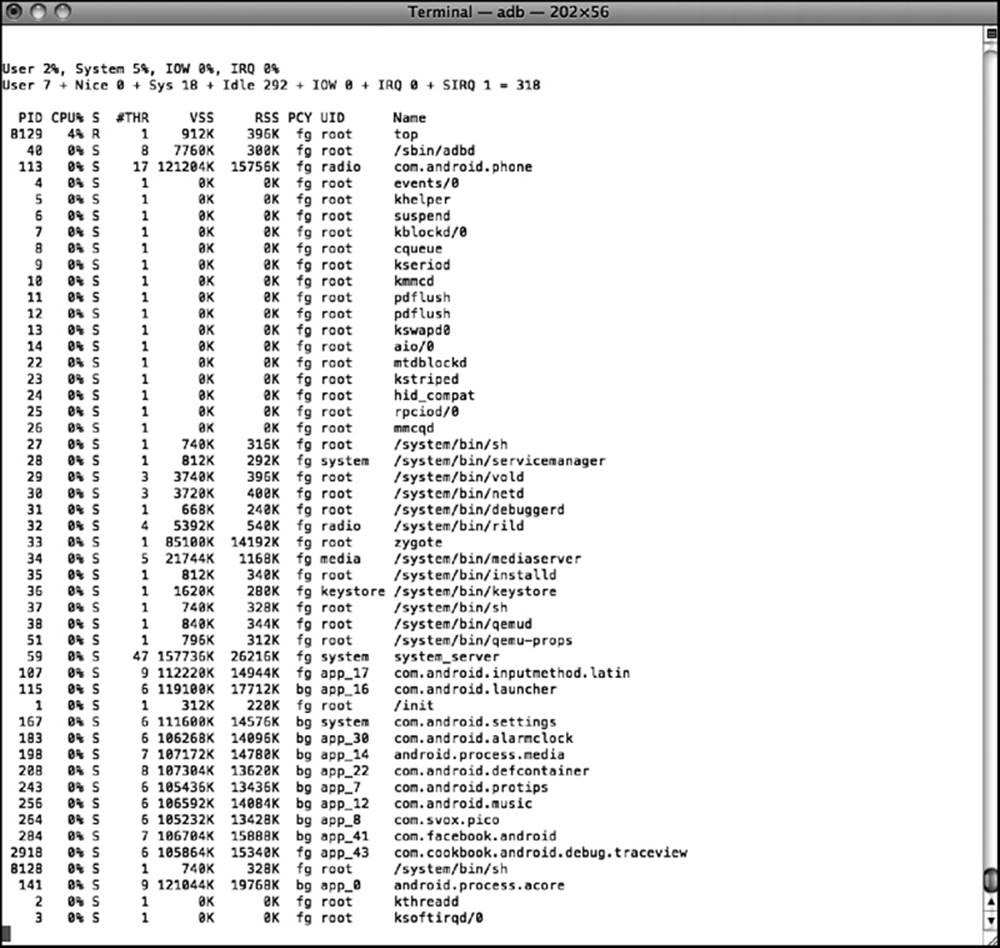
Figure 16.13 Sample output from the top command
The top command also shows the percentage of CPU and memory used in the overall system.
Another important tool is ps, which lists all the processes currently running on the Android system:
> adb shell ps
An example output from this command is shown in Figure 16.14.
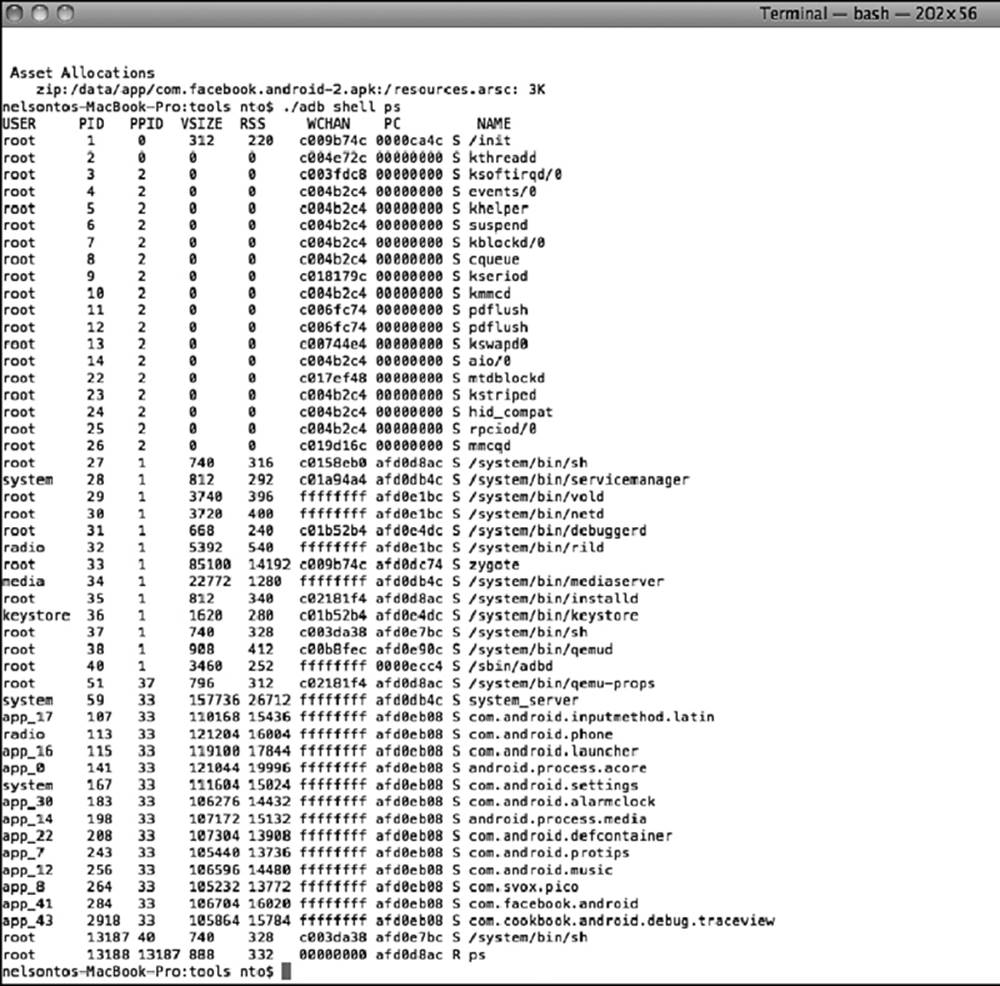
Figure 16.14 Sample output from the ps command
This provides the process ID (PID) and user ID of each running process. Memory allocation can be seen by using dumpsys:
> adb shell dumpsys meminfo <package name>
An example output from this command is shown in Figure 16.15.
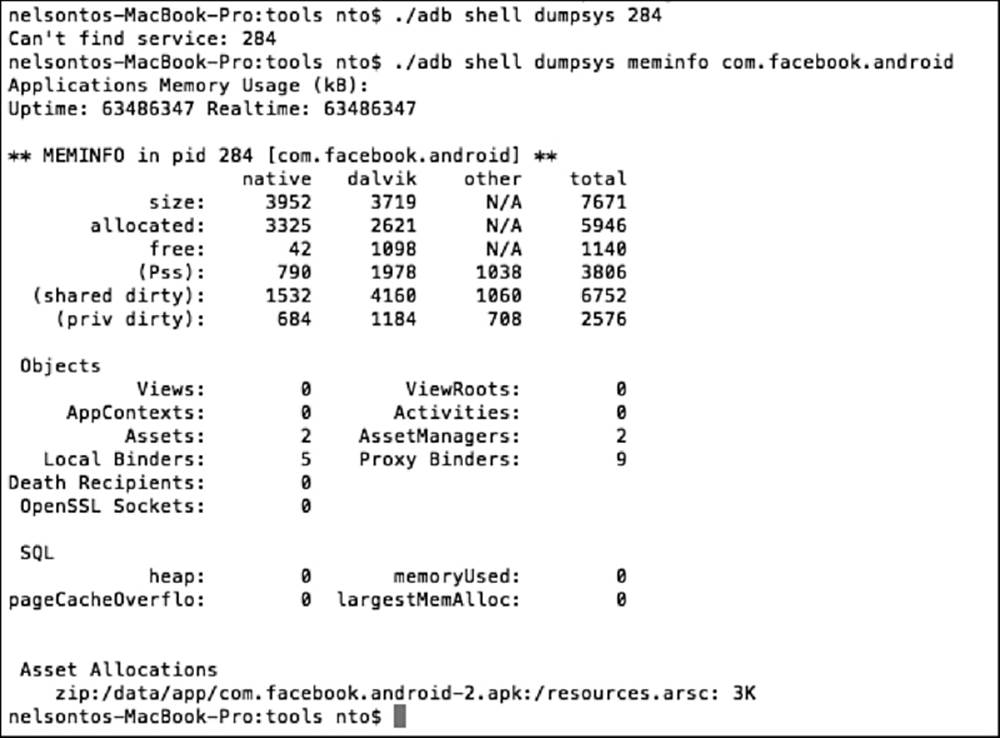
Figure 16.15 Sample output from the dumpsys command
These commands provide information on Java and native components. This information is therefore useful for optimizing and analyzing NDK applications. In addition to memory information, it includes how many views are used in the process, how many activities are used, how many application contexts are used, and so on.
Recipe: Setting Up GDB Debugging
The GNU Project Debugger (GDB) is a common way to debug programs on Linux. In Android, a GDB tool is available to debug native libraries. In NDK-r8, every native library is generated; it also generates gdbserver and gdb.setup. The following commands can be used to install GDB:
> adb shell
> cd /data/
> mkdir myfolder
> exit
> adb push gdbserver /data/myfolder
To run GDB, the following command can be used:
> adb shell /data/myfolder/gdbserver host:port <native program>
For example, with a program named myprogram running on an Android device with IP address 10.0.0.1 and port number 1234, the following command starts the server:
> adb shell /data/myfolder/gdbserver 10.0.0.1:1234 myprogram
Then, open another terminal and run GDB on the program:
> gdb myprogram
(gdb) set sysroot ../
(gdb) set solib-search-path ../system/lib
(gdb) target remote localhost:1234
At the GDB prompt, the first command sets the root directory of the target image, the second command sets the search path of shared libraries, and the last command sets the target. After the target remote localhost:1234 is running, debugging in the GDB environment can begin. For more information about the GDB project, visit www.gnu.org/software/gdb/.
All materials on the site are licensed Creative Commons Attribution-Sharealike 3.0 Unported CC BY-SA 3.0 & GNU Free Documentation License (GFDL)
If you are the copyright holder of any material contained on our site and intend to remove it, please contact our site administrator for approval.
© 2016-2025 All site design rights belong to S.Y.A.