Google Drive and Docs in 30 Minutes (2nd Edition) – The unofficial guide to the new Google Drive, Docs, Sheets & Slides (2015)
Chapter 3. Google Sheets and Google Forms
Just as Google Docs duplicates much of the functionality of Microsoft Word, Google Sheets takes aim at Microsoft Excel.
While Google Sheets is good, it comes up short in a few key areas, such as formatting and working with large sets of data. That said, for basic calculations, charts, and sorting, Sheets is more than adequate. It’s also easy to use, and comes with the following online sharing options that advanced users will appreciate:
●Integration with data from online sources.
●The ability to create online forms using Google Forms.
●Online collaboration (see Chapter 6).
Since we only have a limited amount of time, I am going to show you how to get started with the basic features of Sheets. If you are relatively new to spreadsheet programs, it would be a good idea to open Sheets and try some of the simple exercises below. As with all of the exercises in this guide, I recommend using Sheets in the Google Chrome browser, which is available for Windows, Macs, and Linux desktop and laptop computers.
If you are interested in more advanced examples and instructions, Excel Basics In 30 Minutes (2nd Edition) covers Google Sheets and recent versions of Microsoft Excel. Visit in30minutes.com for more information.
How to create and rename spreadsheets
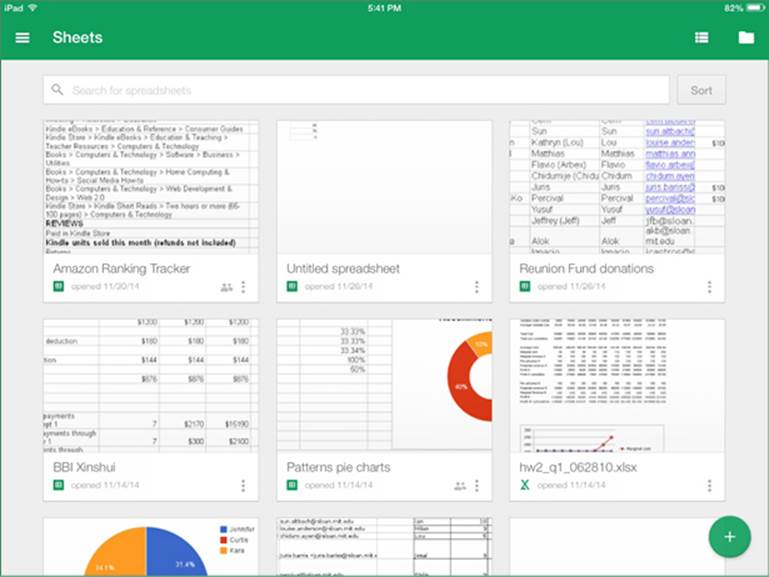
Making a new spreadsheet starts with the New button in Google Drive, or the “+” icon in Google Sheets. Sheets automatically saves information as you type.
To rename a spreadsheet in the browser or Chromebook versions of Google Sheets, simply click on the name at the top of the browser window. If you are using the Google Sheets mobile app, click the More icon or Information icon and select Rename.
Import options
The browser and Chromebook versions of Google Drive (but not the mobile app) can import .xls and .xlsx files and convert them into Sheets files for editing, collaboration, and Web forms.
If you are using Google Drive in a browser, follow these steps to import an Excel file:
1.Click the New button, and select File upload.
2.Locate the Excel file and select it.
3.Google Drive may automatically convert the Excel file to Google Sheets, depending on your settings. The newly converted spreadsheet will appear in My Drive.
4.If the Excel file is not converted, open it in Google Sheets and select File > Save as Google Sheets.
Note that the formatting and other functions may not be preserved during the conversion process.
Sheets allows limited editing of Microsoft Excel documents. Refer to Working with Microsoft Office formats in Chapter 1 for more information.
Export options
Google Sheets can export files as .xlsx (Excel), OpenDocument (.ods), PDF, text, .csv (comma-separated values), .tsv (tab-separated values) and HTML. Open the spreadsheet in a browser or Chromebook, and select File > Download as to see the available options.
Export options for the Google Sheets app for Android and iOS are limited to .xlsx files. On the main screen of the app, follow these steps:
1.Tap the More icon (three vertical dots)
2.Select Share & export
3.Select Save as Excel (.xlsx)
Functions and calculations
Microsoft Excel, Google Sheets, and other spreadsheet programs were designed for crunching numbers. If you’re used to Excel, the basic layout, commands and math/business functions carry over to Sheets.
However, the programs are not identical. Google has done a lot to streamline Sheets’ interface, which makes it easy to perform simple calculations and tasks.
Another important difference between Excel and Sheets: Excel has more power, and is better able to handle large spreadsheets. If you are working with an exceptionally large dataset (more than 500 rows or columns) the Sheets application may become unresponsive or display errors.
The next few exercises are intended for people who have never used Excel or any other spreadsheet program. Experienced users can skip ahead.
Spreadsheet terminology
When you create a new spreadsheet in Google Sheets, the grid that you see in front of you is called a worksheet. A spreadsheet file can have more than one worksheet, and they will be layered on top of each other and accessible via tabs at the bottom of the grid.
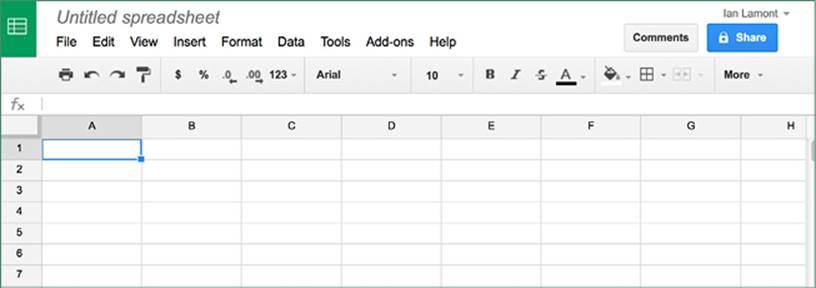
The small rectangles that fill a worksheet are called cells. They are designed to hold numbers (for instance, 5, 26.2, $500 or 98%) as well as text (“Sarah”, “Account past due”, “245-BNX”, column headers, etc.). Sometimes, people will use a cell to refer to other cells that are part of a formula (more on that later).
Because there are so many cells, worksheets use a simple system to identify each one. The top of each column is labeled with letters, while the rows running down the left side of the window are labeled with numbers. It’s just like the game Battleship, in which you identify a specific location on the grid by calling out “A7” or “J3”. If the worksheet has more than 26 columns, the 27th column is labeled AA, the 28th column is labeled AB, etc.
You can use arrow keys or sliders to move quickly around the worksheet. If you enter numbers or text into a cell, and the cell is not big enough to display the contents, the width of all cells in the same column can be adjusted by hovering the mouse over the dividing line between two cells until a tiny right-facing arrow appears. Grab the arrow with the mouse and drag it to the right or left to adjust the width of the column.
Your first formula
Let’s do a quick exercise. You can use Google Sheets in a browser or a Chromebook, or use the mobile app for Android and iOS:
●Create a new spreadsheet in Google Sheets. Rename it “Sample spreadsheet” or any other name.
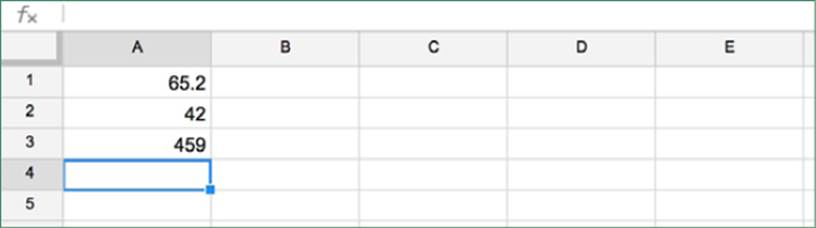
●Find cell A1. In it, type the number 65.2 and press Return/Enter. If you are using the Google Sheets app on your phone or tablet, select the cell and then use the Formula Bar (marked with fx) to enter the number.
●In cell A2, enter the number 42.
●In cell A3 enter the number 459.
Your worksheet should look like this:
Adding these numbers together in our heads would be slow, and we might make mistakes. Doing it with a pen and paper would be time-consuming. But spreadsheet formulas make it easy.
The formula will be placed in an empty cell that will calculate the total of the three cells. It can be the cell immediately below the numbers, or it can be a cell that’s located several columns away. The calculation can be completed anywhere on the worksheet, and will refer back to the cells that contain the values to be added together.
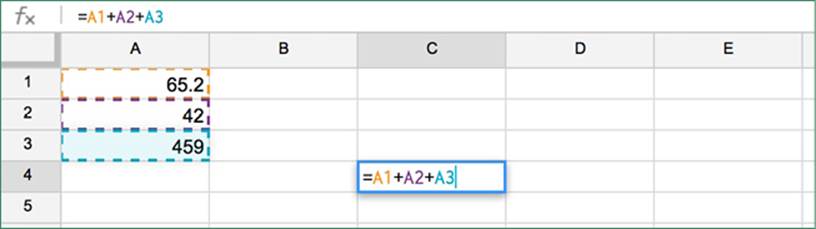
Let’s select a cell two columns over—cell C4. In it, type the following text. But don’t press Return/Enter yet:
=A1+A2+A3
This is a formula. All formulas and functions entered into a spreadsheet have to start with an equal sign (“=”). It looks backwards, but starting with an equal sign tells Excel or Sheets that you are entering a formula or function, as opposed to typing text or numbers.
A1, A2, and A3 are references to the cells that contain numerical values. References can be typed as lowercase (“a3”) but Sheets will convert them to uppercase.
As you type each reference into your formula, the cell in question will have a colored rectangle drawn around it. The color of the text being typed changes color to match it.
The colored outlines verify that you are typing the correct cell references. For instance, if you mistakenly typed B3 instead of A3, an empty cell would be highlighted, instantly letting you know that you had entered the wrong cell reference.
As you type, you may also notice that the Formula Bar shows exactly what you are typing:
Press Return/Enter. The result of adding the three cells is shown in cell C4. Select cell C4 again. The number in the cell stays the same, but the Function Bar still displays the formula you entered. This is a handy way of determining how a cell’s value was calculated.
How to create a series of numbers using Auto-fill
When you are working with spreadsheets, it’s common to create a series of numbers in a row or column. For instance, you may need to make the top cell of each column show all of the years from 2015 through 2025. Typing each year would be time consuming and prone to error. Fortunately, there is an easy way to create a series of numbers in a spreadsheet. It’s called Auto-fill. The following exercise for Google Sheets in a browser or a Chromebook demonstrates how Auto-fill works:
1.Create a new spreadsheet.
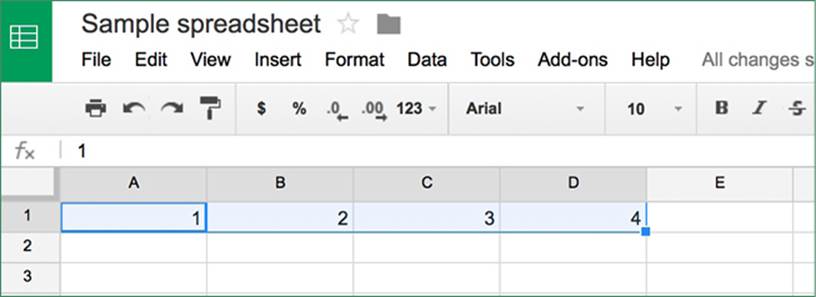
2.In the top row, type “1” in the cell A1.
3.Type “2” in cell B1.
4.Highlight both cells by dragging across the two cells with your mouse button held down.
5.On the lower right corner of cell B1, you will see a small blue square or dot. Grab it with your mouse, and drag to the right (see screenshot below).
6.Cell C1 will show the number 3, cell D1 will show the number 4, etc.
Additional notes
1.The same function works for years, months (date or name), and days of the week (date or name).
2.You also can use Auto-fill to quickly generate results for mathematical functions and formulas across many columns (see example later in this chapter).
3.Clear the numbers in the spreadsheet by highlighting all of the cells and pressing the “delete” key.
4.The Google Sheets app for Android and iOS devices does not support Auto-fill.
SUM and simple math functions
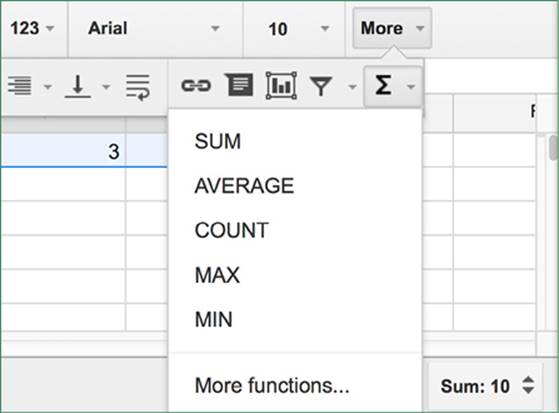
In the browser and Chromebook versions of Google Sheets, the toolbar is located above the worksheet. It contains buttons and drop-down menus for common commands and functions, which are alternate ways of expressing mathematical formulas. The Greek Sigma symbol is a drop-down menu for various math functions:
The toolbar and functions are not displayed in the Google Sheets app for Android and iOS, although it is possible to manually type the functions on mobile devices.
Here are some examples that use the SUM function:
Example: Single-column addition
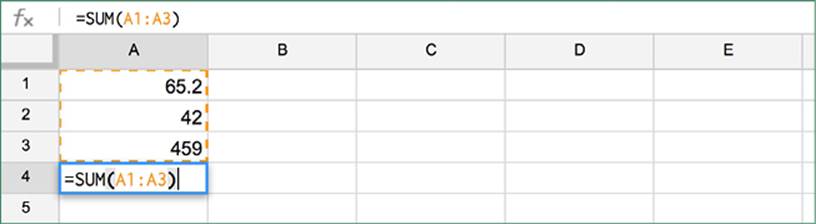
1.In column A, type three single-digit numbers in the first three rows (A1, A2 and A3). You can use the same numbers from the previous exercise demonstrating formulas.
2.Highlight the cells.
3.Click the Sigma symbol to bring up a list of common math functions.
4.Select SUM.
5.In the cell A4 (see example below), you will see =SUM(A1:A3). Sheets is asking, “Show the result for the sum of all numbers between cell A1 and A3?”
6.Press Return/Enter to confirm.
7.The sum of the three cells is shown in cell A4.
Example: Multiple column addition and average:
1.In column A, type three numbers in the first three rows (A1, A2 and A3).
2.In column B, type three different numbers in the first three rows (B1, B2 and B3).
3.In column C, type three more numbers in the first three rows (C1, C2 and C3).
4.Highlight cells in the first row (A1, A2 and A3). Do not highlight any other cells.
5.Click the Sigma symbol, and select SUM.
6.In the cell A4 (immediately below the highlighted cells), you will see “=SUM(A1:A3)”.
7.Press Return/Enter on your keyboard to confirm.
8.The sum of the three cells is shown in cell A4.
9.Select cell A4 to highlight it.
10.You will see a small dot in the corner of cell A4. Grab it with your mouse and drag it to the right, over the empty cells B4 and C4.
11.Auto-fill will be activated. Cells B4 and C4 will show the totals of their respective columns.
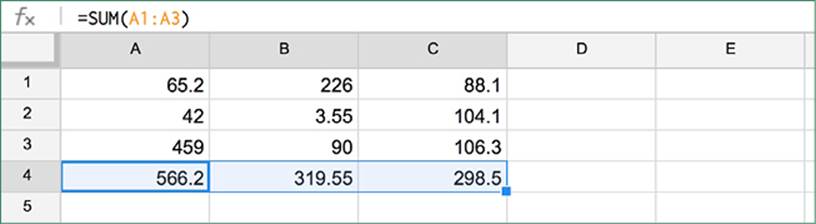
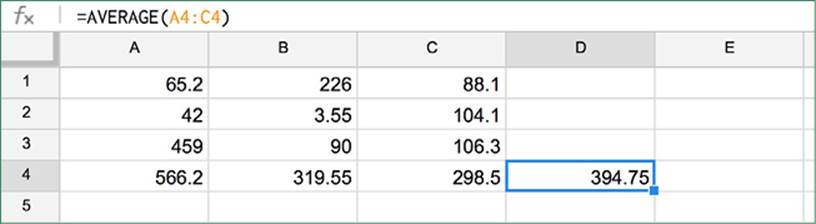
Example: To calculate the average of all three sums:
1.Highlight cells A4, B4 and C4.
2.Click the Sigma symbol, and select AVERAGE.
3.In cell D4, you will see “=AVERAGE(A4:C4)”.
4.Press Return/Enter on your keyboard to confirm.
5.The average will appear in cell D4.
You can experiment with other functions. Common ones include:
●COUNT: Counts the number of highlighted cells with numerical data in them.
●MAX and MIN: Displays the highest and lowest numerical value in the selected cells.
Additional notes
You can see a full list of functions by selecting More functions under the Sigma symbol. The list is exhaustive and covers mathematical, business, and practical functions. For instance, Example: “=TODAY( )” displays today’s date in the cell.
As with Excel, it’s possible to combine/nest functions in Sheets. Here’s an example:
=SUM(A1:A3)+AVERAGE(B1:B3)
This function will add the sum of the first column of numbers to the average of the second column of numbers.
For complicated functions or nested functions, I often type them in a different text editor and then paste them into Sheets. It’s quicker to make changes this way.
All functions must begin with an equal sign (“=”). Using the wrong type of data in a function will also generate errors. Example: Attempting to use AVERAGE( ) on a column and mistakenly including the header text in the range will generate an error, because text cannot be averaged.
Formatting numbers and cells
The toolbar in Sheets will contain many familiar buttons to change formatting. Some are the same as those used in Docs—for example, buttons to bold or align the contents of a cell, or increase the font size.
Numbers have their own formatting buttons. They include:
●Dollar: Instantly formats a number in U.S. dollars. To select another nation’s currency, go to Format > More formats > More currencies or use the More currencies option under the 123 button.
●%: Instantly converts the data to a percentage.
●123: Selects other formats, including:
●Round up to the nearest whole number.
●Round to two decimal places.
●Round to n decimal places.
●Financial
●Example: –1000 rendered as (1,000)
●Scientific
●Example: –1000 rendered as –1.00E+03
●Dates and Times
Sorting and filtering data
These powerful features, enabled through the Filter button (see screenshot, below), let users pick out pieces of data from large datasets and order them. An example would be reordering the rows from highest to lowest based on the values in column C.
Without getting too technical, here are some basic examples:
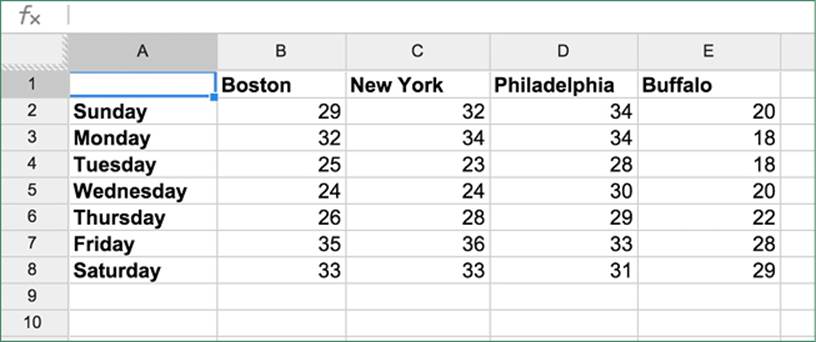
Temperatures example
Let’s take a look at the weekly high temperatures for four U.S. cities. The first view shows the raw data:
It’s also possible to show the data filtered for those days when the temperature in Buffalo was 20 degrees:
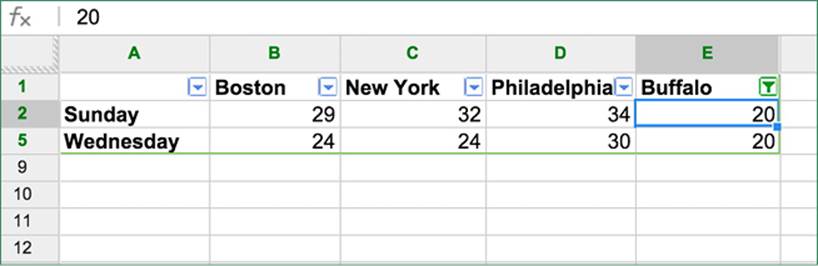
To duplicate the above results from the original raw data, the following steps are required:
1.In column E, under the Buffalo heading, select the first cell that contains the number 20 (cell E2).
2.Select Data > Filter.
3.Tiny triangles will appear at the top of every column. Click the triangle at the top of column E to display the Sort/Filter options.
4.Clear the checkmarks next to the numbers (which correspond to the data in that column).
5.Select 20, and click the OK button.
Finally, I sorted the original view to have the colder temperatures under Philadelphia appear higher up in the list:
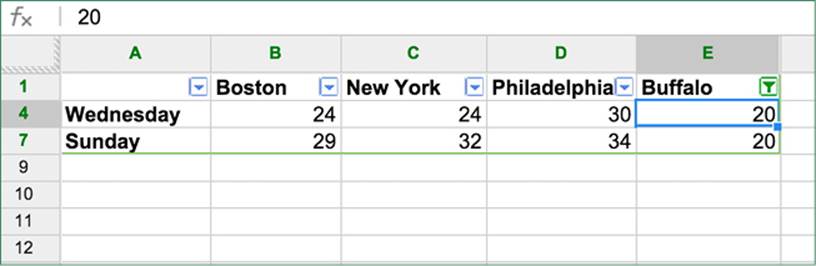
I did this by pressing the Sort/Filter triangle next to Philadelphia, and then selected Sort A-Z, which arranges the data in that column from smallest to largest. It also altered the order of all of the other columns, so that Wednesday is in the first row below the header (Wednesday contains the lowest temperature for Philly).
It’s easy to imagine how these features could be used to quickly isolate and order data from large lists. Examples include:
●Listing the highest-paid workers in a department with hundreds of employees.
●Identifying struggling students in a large high school, based on grades.
●Tracking a transaction in a list of thousands of sales records, based on a specific amount.
How to make a manual list
If you’ve manually built lists in Excel, you can do the same thing in Sheets.
1.In the top row, enter your headers that describe the data. In a training session scenario, the headers might be Last Name, First Name, Department, etc.
2.Manually enter the data. A typical scenario would involve the owner of the spreadsheet gradually entering the data as people sign up via email or phone.
3.Manipulate the data. Filter and Sort can really help, especially for large lists (Boss: “Get me a list of staff whose last name begins with the letter ‘N’, pronto!”).
Charts and graphs
Sheets can generate simple charts and graphs. For people who are familiar with Excel’s powerful graphing features, Google’s tools may seem primitive. But they are more than adequate for basic uses. They even include a few advanced features.
How to make a chart or graph
At a very basic level, making a graph involves selecting a group of data and pressing the Insert chart button on the Sheets toolbar.
In the following example, I’ve selected all of the cells in the Weekly High Temperatures spreadsheet, and then pressed the Chart button, which brings up the Chart Editor window. Sheets recommends the following chart:
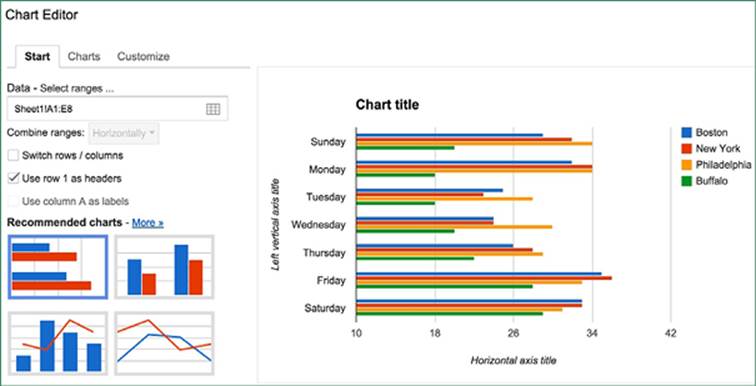
However, the thin, colorful lines aren’t suitable, as they make it difficult to compare temperatures in specific cities from day to day. By exploring the other chart options, I found a simple line chart without any fill colors:
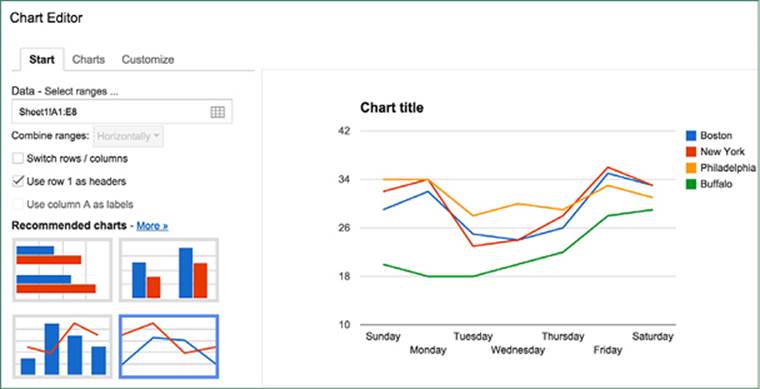
Note that certain types of charts require certain types of spreadsheet data in order to work. For instance, columns that contain lists of names cannot be used to make line, bar, or pie charts, because these types of charts require numbers, not text.
Taking spreadsheets to the next level with Google Forms
While early spreadsheet programs were created to help businesses with their finances, office workers soon found another use: entering text into cells to make lists.
For instance, someone might create a list of the names and departments of attendees at a training session, or the participants in an office betting pool, and then manipulate the data using filtering and sorting functions.
Google Forms takes the list concept a step further with a form creation tool that puts custom forms on the Web and feeds the data into Google Sheets.
How to use Google Forms to gather data
Google Forms is a tool that lets you create an online form. Data entered into the form will automatically be entered into a spreadsheet in Google Sheets.
The forms can really change the way you gather data. Think about it: Instead of manually entering data, you can make a simple form or survey, post it on the Web and let other people do the work for you! This tool is perfect for signup forms and simple reporting.
Once a form has been created, it can be accessed via a Google link that you can email or post on a social network. The form can also be embedded on a blog or company Web page. Customization options can make the form look more professional, or match the fonts and colors you want to use. The data from the form feeds directly into a spreadsheet, which is only visible to you and designated collaborators (as described in Chapter 6).
How to create a form
1.You can either use an existing spreadsheet (select Tools > Create a form) or make a new form from Google Drive’s main screen by pressing the New button and selecting More > Google Forms.
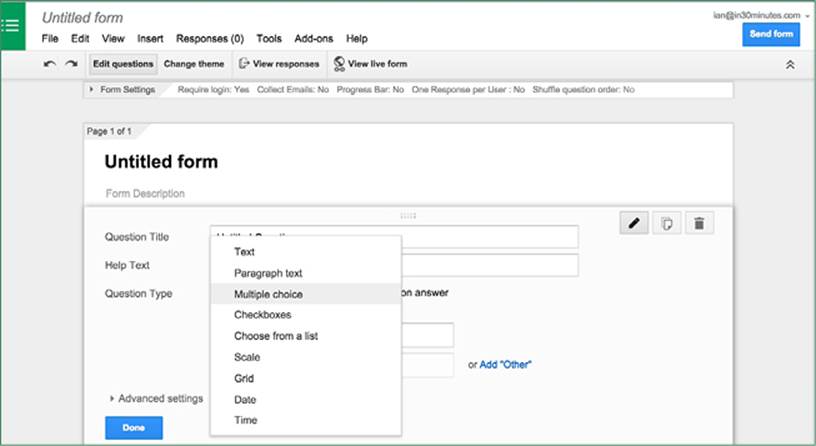
2.The form editor appears (see screenshot, below).
3.Use the checkboxes to choose your preferred settings. For instance, you can require people to log in, or show a progress bar at the bottom of the form.
4.Enter the title.
5.Enter the description. Make it clear what the form is being used for, and add any instructions that can help people complete the form. Absent context or appropriate instructions, users may be reluctant to use the form, or they may enter the wrong type of data.
6.Add a question using the Add item button. There are more than a half-dozen types of questions that can be used.
●Text. A one-line text field.
●Paragraph text. Allows for longer answers.
●Multiple choice. Create a multiple-choice question, with as many possible answers as you want.
●Checkboxes. People can check off one or more items from a list.
●Choose from a list. Creates a drop-down menu.
●Scale. Users choose a number from 1 to 10, or any other number combination you choose.
●Grid. Users fill in data according to a table.
Data entered into the Web form will be immediately added to a corresponding spreadsheet, which can be accessed from Google Drive, Sheets, or the View responses tab at the of the Form editor. Sheets also adds a timestamp for each submission.
Data from the form can be formatted, sorted, filtered and otherwise manipulated using the same methods described earlier in Sorting and filtering data.
When complete, the link to access the form can be found at the bottom of the page (look for the link that says, You can view the published form here). You can control the circulation of your form using the following methods:
●Require login access
●Only share the link with selected people
●Embed the form on a blog or webpage (from the spreadsheet, choose Form > Embed form in a webpage).
All materials on the site are licensed Creative Commons Attribution-Sharealike 3.0 Unported CC BY-SA 3.0 & GNU Free Documentation License (GFDL)
If you are the copyright holder of any material contained on our site and intend to remove it, please contact our site administrator for approval.
© 2016-2026 All site design rights belong to S.Y.A.