Professional Embedded ARM Development (2014)
Part I. ARM Systems and Development
Chapter 9. Debugging
WHAT’S IN THIS CHAPTER?
What a debugger can do
The difference between a software debugger and hardware debugger
Debugger terminology
A few software and hardware debuggers
Debugging techniques
When to use a debugger
Effective debugging
A program that works the “first time” is a myth. There will invariably be little problems that need to be fixed: Some of them will be easy; some of them will be hard. Be careful, though; sometimes the easiest problems are the hardest to spot.
There are various techniques for solving problems, but unfortunately, there is no general rule. This is something that is acquired over the years, and it sometimes boils down to instinct.
ARM processors have advanced features that enable developers to easily debug applications or kernels, whatever solution the developer takes.
WHAT IS A DEBUGGER?
For anyone in systems programming, a debugger is a software application that can run a program, line by line and show various pieces of data, such as variables and memory contents. You can use debuggers primarily to follow, step by step, the execution of a program and to understand why portions of that program do not function as wanted. Debuggers normally require an operating system to run and to have a method of communication externally: a serial line, Ethernet, monitor, and so on.
For embedded systems, this is often a problem because most do not have outputs, and some do not have an operating system. Even on systems that do have an operating system, sometimes you must look closer at the operating system, something that a normal debugger cannot do. For this, embedded systems use In-Circuit Emulators (ICEs).
ICEs are hardware devices that connect to the embedded system through a special port. ARM processors, and indeed most processors, have a specialized way for debuggers to connect to the heart of the system to enable external devices to take control. Historically, ICEs had their own processor, one that was closer to the debugging computer, which had input and output to the target system. The target CPU was deactivated, and most of the calculation was done on the emulator. Today, this is no longer the case, but these devices tend to keep their historical name of emulators, even if they are debuggers. All calculations are made on the target system, and the ICE communicates only between the processor and the debugging computer.
Some devices are known as In-Circuit Debuggers (ICDs), which is technically a more correct name.
Other ICEs exist, that actually are emulators, but these are designed primarily for the simulation of silicon before making a processor and are out of the scope of this book.
What Can a Debugger Do?
A software debugger, as previously described, can take a binary program and run it exactly as if it were running normally on an operating system. It can pause program executing, perform step-by-step execution and have a look deep into a program.
Hardware debuggers are often a window to embedded systems. Not only can they help debug, but because they have direct access to hardware, they also can upload programs to memory, flash nonvolatile memory, and configure hardware devices.
Hardware debuggers aren’t just about debugging software. They can also debug a lot of the hardware, by looking at all the registers on a system, not just the processors. If the serial line isn’t giving correct data, checking the serial registers is often a great way of checking without adding any additional code. On some processors, a watchdog is set to automatically reset the processor if the watchdog doesn’t hear from the program within a set amount of time. On a Freescale iMX51, it can’t be deactivated when activated, except if using a hardware debugger, which is rather useful for long testing sessions.
ARM Debugging Capabilities
ARM processors have excellent debugging capabilities because of integrated hardware. JTAG was originally designed to perform boundary scans to test interconnections on printed circuit boards. Since, JTAG has been used for much more, including debugging. Some classic ARM cores have a hardware macrocell called EmbeddedICE, hardware that can receive debugging instructions, and a small window to the processor and external devices. These devices have hardware support for adding breakpoints and taking control of the processor when a break occurs.
During the development of ARMv6, EmbeddedICE was replaced with CoreSight, an improved debug interface. No longer based on JTAG, this device communicates using Serial Wire Debug (SWD), a low pin count, high-speed alternative to JTAG. Requiring only two pins instead of JTAG’s five, this enables debugging for severely pin limited packages, enabling the debugger to take control of even the smallest chips.
CoreSight enables users to have more hardware breakpoints and also enables hardware traces, enabling debuggers to know which routines are used when and for how long. Traces are mainly used for optimization and are explained in the next chapter.
When using debuggers, a lot of technical words might not have any meaning immediately but need to be known to fully use a debugger.
Breakpoint
A breakpoint is a location in instruction code in which the processor halts and gives control to the debugger. In software, this halts the program at the specified location, letting the user decide what to do. In hardware, this actually freezes the CPU, so nothing continues in the background.
A breakpoint is triggered when the Program Counter is equal to the address, or when the instruction is about to be executed. ARM cores with on-board debug hardware can have hardware breakpoints, enabling a program to run at full speed before being stopped at a particular memory location. The amount of breakpoints available depends on the core and the architecture; ARM9 cores have two hardware breakpoints, but the Cortex-M0 has four, the Cortex-M3 has eight, and ARMv7A/R cores have six.
Watchpoint
A watchpoint is slightly different from a breakpoint, and the two are sometimes confused. Although a breakpoint can halt the processor when a specific instruction is about to be executed, a watchpoint can trigger at a memory location and can be set to trigger on read or write. It is extremely useful to know which part of a program updates a specific portion of memory. What updates that system register? Set a watchpoint on data write, and if the program reads the register, the watchpoint is ignored, but as soon as the program updates the memory, the system halts at the instruction.
Again, ARM cores provide hardware debugging capabilities but usually less than breakpoints. Cortex A/R chips have two watchpoints, the Cortex-M0 also has two, and the Cortex-M3 has four.
Stepping
Stepping is an important feature that enables the debugger to go through code, step by step. When a breakpoint is set, the next instruction becomes visible and waits for the user before continuing. Although you can then have a look at variables before continuing the application, it is sometimes useful to watch the result of each instruction. Stepping does this for you.
Running an application step by step means that each line of code is executed before waiting for user input before performing the next. In a loop, you can watch as each line executes and have variables displayed. Updated variables are often color-coded to show the developer which variables have changed since the last instruction. Most debuggers enable stepping in the native language and in assembly.
Stepping isn’t just step by step; the debugger can be ordered to continue execution until it leaves the current routine via a return, to step over a function (after all, you want to debug your own code, not the entire C library) or to specifically step into a function.
Vector Catch
Vector catch is a mechanism used to trap processor exceptions. It is often used early on, before exception handlers are used. Essentially, this technique watches the vector table and interrupts execution when the ARM core enters an exception state.
Stack Frames
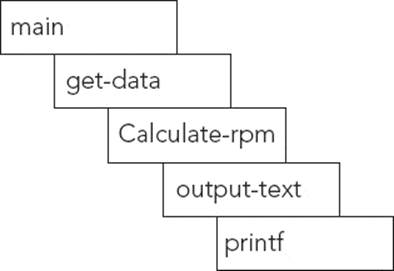
Sometimes, the routine that generates the problem won’t have a software bug. Routines that normally function perfectly well can have some strange effects if the wrong parameters are sent. This happens often: a division by zero or a string that doesn’t contain what was expected. With the stack, you can see the chain of calls; the last function on the list might be creating an exception by printing out the wrong value, but who called this function in the first place? Debuggers can help by printing the entire stack frame.
An example is provided in Figure 9-1. In this example, printf, one of the most used and most reliable routines, generates an exception. It is extremely unlikely that printf itself is the cause, but the problem might be one of the functions calling printf. This example shows the stack frame for this application.
FIGURE 9-1: Example stack frame
TYPES OF DEBUGGING
Debugging is used to correct code. Errors can be of several types; routines can give wrong results or possibly not be called. In embedded systems, there can be more critical errors: An application (or kernel) might be generating exceptions, which need to be debugged and corrected. Exception handlers must sometimes be debugged and can be tricky. Sometimes, a tricky situation requires the use of an external debugger to understand what is happening electronically.
Loops
Loops are the most common elements that go wrong and are also some of the most complicated to read. Nested loops can be tricky, and in some cases, it is almost impossible to write elegant code that is easily readable. When optimized, they can be tricky to read.
Some of the most common mistakes involve variables that are incorrectly initialized, off-by-one errors, and loops that either loop an infinite amount of times or loops that iterate zero number of times.
When debugging loops, it isn’t always practical to follow every loop. It is often advisable to debut the first two loops and the last two. Knowing how the loop starts is essential, but often it isn’t necessary to see every loop. If the first two start off well, you can begin by presuming that the others will work well. If the first two work, concentrate on the last two to understand how the program exits the loop. Is the loop being terminated too early? Or on the contrary, is the loop being run too many times? By debugging the variables used in the loop, you can often see where errors are coming from.
Be careful checking for equality inside loops. Having a loop depend on an equality to quit is often used, but with floating point numbers especially, a tiny difference can cause the loop to iterate infinitely. Where possible, add a second possibility for leaving a loop. For example, continue until variable a is equal, or greater than, variable b. A simple equality might have surprising effects if a variable no longer has the value 2, but possibly 2.00001.
Routines
Routines are one of the most common elements to debug, and luckily, one of the easiest. Typically, routines need to be debugged when a return code is erroneous and an inner loop doesn’t quite react as it should. This can sometimes be debugged by adding simple serial output text or by using a debugger to follow step by step and analyze variables.
Interrupt Controllers
Interrupt controllers are tricky to debug because they are critical portions of code that need to be executed quickly. There are two ways of debugging them: either by running a simulated environment in which an interrupt can be fed to the controller at will, allowing for step-by-step debugging or in real time. The problem with real time is that it severely limits any interaction; simply printing a line on the console using printf can have unexpected results and can change the way the handler works.
Bootloaders
Debugging a bootloader is exceptionally hard with anything else but a hardware debugger. Because this is a portion of code that is at an extremely low level and requires a lot of system calls and/or assembly, it is rarely possible to do this entirely in software except on emulated systems.
DEBUGGERS
Because ARM cores can be used for so many different applications, there are several ways of debugging. Application developers will be at ease on cores running a full operating system because applications such as gdb can be used to debug an application directly on the hardware. On micro-controller applications, external hardware may be required to access the ARM debugging features.
GNU Debugger
The GNU Debugger, or gdb for short, is an excellent piece of software that allows the user to take control of a program; start and stop a program, insert breakpoints, evaluate variables, and a few other important features. It can debug programs written in C, C++ as well as an impressive number of other languages.
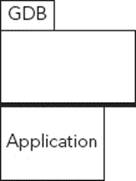
There are two ways of running gdb; either running gdb on the target, and configuring gdb to run a target application. The GNU debugger is used regularly to debug PC applications, by running on the same system, but this method is rarely used for embedded systems, simply because running gdb can require too many resources for an embedded system. An example of gdb running an application is illustrated in Figure 9-2. In this instance, gdb is running, and has full control over an application, running on the same system. The application is not separate; it is actually run and controlled by gdb.
FIGURE 9-2: Running gdb and application on a system
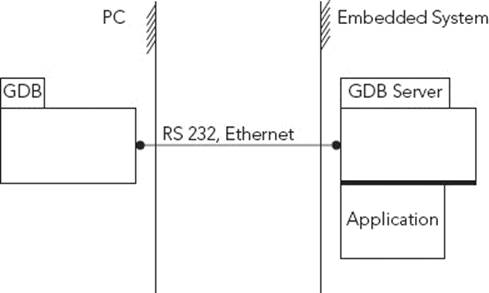
When the previous example is not possible, the GNU Debugger can be used in a master/slave fashion. In this instance, the GNU Debugger works in two stages. First, the gdb server, named gdbserver, must first be compiled for that system, and then be copied onto the target platform. It requires a method of communication to the host compiler computer. This means that the target must have either a working network configuration or a UART connection. Second, on the debugging PC, gdb must be run and then connect to gdbserver. Once again, a specific version of gdb should be used; an ARM version of gdb must be used.
While gdbserver is often software, some hardware implementations exist, and are connected directly to the USB port of the development system. Also, some operating systems allow users to take control via gdb. For example, VxWorks allows users to spawn tasks using gdb, and to take control of tasks spawned from the shell.
Figure 9-3 illustrates an example debugging session on an embedded system, controlled from a development system.
FIGURE 9-3: Running gdb on an embedded system
Running the gdb server is easy; simply define a connection method. For the serial output, you must define the serial port:
gdbserver /dev/ttyS0
For a networked device, only the port is required:
gdbserver :2345
The gdb server will start and wait for an incoming connection before continuing.
On the development computer, the GNU Debugger “client,” or simply gdb, is required. The GNU Debugger is a command-line program used to communicate with a gdb server. All the calculation will be done by the client, leaving the server to run the program with minimal interference. This has the advantage of having a good debugging capacity on a system with limited RAM or power.
To launch the program using gdb, you must first launch the client and connect to the server.
arm-none-eabi-gdb
(gdb) target 192.168.0.2:2345
(gdb) run
The GNU Debugger can be configured with multiple parameters; it can be given a program to run or attach to an existing program. By default it quits when the target application exits, but it can be programmed to remain in memory to rerun the binary file.
J-Link GDB Debugger
Using the GNU Debugger often requires an operating system; the network must be active, or the system must report the running processes, and so on. Although in some cases this might be practical, in others, it is impossible. Microcontroller systems, especially, do not have the resources, and in the worst case, the embedded system will not have network capabilities, and might not have a serial line available. In this case, another approach is required.
Silicon Lab’s STK3800 evaluation board, first presented in Chapter 5, “First Steps,” comes with a J-Link debugger directly on the board. J-Link has a software solution enabling gdb to access a specialized gdbserver, effectively turning the debugging chip into a kernel. This enables the developer to debug a barebones application without the need for any other configuration; there is no need to copy a binary, and there is no need to have an operating system configure a serial port. The J-Link effectively “translates” between the GNU Debugger and the hardware debugger.
EXAMPLE DEBUGGING
The following is a short list of some of the common problems encountered, and some of the ways to detect them and to correct them. They are situations that you may have already faced, either in embedded systems or in systems programming, followed by a brief explanation on how they were solved.
Infinite Loop
An infinite loop is created when a program doesn’t run the way it is expected; either because of an unforeseen situation or simply because of a portion of code that wasn’t written quite the way it should have been.
This example, contains a portion of code that can run on any machine, not just an embedded ARM system. This code is from the gdb tutorial and explains beautifully how to analyze infinite loops. You can compile this code on an ARM system or on a desktop.
#include <stdio.h>
#include <ctype.h>
int main(int argc, char **argv)
{
char c;
c = fgetc(stdin);
while (c != EOF)
{
if(isalnum(c))
printf("%c", c);
else
c = fgetc(stdin);
}
return 1;
}
By looking quickly at the code, it looks obvious that this routine will look at the standard input, and if the char read is alphanumerical, it will be printed to the standard output; otherwise, it waits for another char to restart the loop. However, there is a hidden problem. Running the program gives a hint.
> a.out
Hello, world!
HHHHHHHHHHHHHHHHHHHHHHHHH [...]
This is not what was expected. The program continues to print out the first letter, and you have to quit the program. Take a closer look at this program. You can add some printf traces inside the loop, but it is often easier to not modify the program and use a debugger—in this example, the GNU Debugger.
To debug easily, the program must be compiled with the debug flag, -g. By adding this flag, supplemental information is added inside the program, notably the symbol table. It also adds file names and line numbers from where the symbols came from, making it easy to find the exact location of a problem.
gcc -g infinite.c
Next, this program needs to be run with gdb. Start the program exactly as before; only this time break into it.
(gdb) run
Starting program: /local/a.out
Hello
HHHHHHHHHHHHHHHHH
Program received signal SIGINT, Interrupt.
Next, it is time to see where the program is exactly. By issuing the backtrace command, the stack is analyzed.
(gdb) backtrace
#0 0x400d8dc4 in write () from /lib/libc.so.6
#1 0x40124bf4 in __check_rhosts_file () from /lib/libc.so.6
#2 0x40086ee8 in _IO_do_write () from /lib/libc.so.6
#3 0x40086e46 in _IO_do_write () from /lib/libc.so.6
#4 0x40087113 in _IO_file_overflow () from /lib/libc.so.6
#5 0x40087de5 in __overflow () from /lib/libc.so.6
#6 0x40069696 in vfprintf () from /lib/libc.so.6
#7 0x40070d76 in printf () from /lib/libc.so.6
#8 0x80484c2 in main (argc=1, argv=0xbffffaf4) at inf.c:12
#9 0x40037f5c in __libc_start_main () from /lib/libc.so.6
The frame that you are interested in is number 8, the “main” routine, your program.
(gdb) frame 8
Next, you can watch the code, line by line, by using the next command, or “n” for short.
(gdb) n
11 if(isalnum(c))
(gdb)
12 printf("%c", c);
(gdb)
15 }
(gdb)
11 if(isalnum(c))
(gdb)
12 printf("%c", c);
(gdb) n
15 }
(gdb)
11 if(isalnum(c))
(gdb)
12 printf("%c", c);
There is a pattern here, and one that isn’t what was originally intended. If the char c is an alphanumeric, which it is, it is printed out and then repeated forever. The program never gets the next char from the input. By using the debugger for less than a minute, you now know exactly where the problem lies.
11: if(isalnum(c))
12: printf("%c", c);
13: else
14: c = fgetc(stdin);
The culprit is line 13; the else statement shouldn’t be used. By removing the else statement, the loop works as intended.
The GNU debugger is a powerful tool, even if the learning curve can be a bit steep. Time should be taken to have a closer look and run a few examples. This short example barely scratches the surface of what this powerful debugger can do, but even so, you solved an infinite loop.
Unknown Exception
An exception is one of the more difficult debug situations because there are only a certain number of exceptions available and a lot of situations in which an exception can be made. Using the DS-5 debugger, it can be extremely easy to know exactly what happened.
The DS-5’s advanced interface makes debugging easy. On some debuggers, you would place a breakpoint on the vector table, on each element that you are interested in. In the DS-5 interface, this is called Vector Catch and can be configured directly to print a message and to pause program execution. For example, imagine that this portion of code gives an error:
void bubble(int *p, int N)
{
int i, j, t;
for (i = N-1; i >= 0; i--)
{
for (j = 1; j <= i; j++)
{
if (compare(&p[j-1], &p[j]))
{
t = p[j-1];
p[j-1] = p[j];
p[j] = t;
}
}
}
}
The vector catch informs you that the exception occurs on line 8:
if (compare(&p[j-1], &p[j]))
So what went wrong? Was it the compare function? The compare function is simple:
int compare(int *m, int *n)
{
return (*m > *n);
}
When an exception occurs, the current Program Counter is saved, and DS-5 can trace this. By looking at the process stack, you can see the address that triggers the exception, a Data Access Memory Abort. By clicking this address, the DS-5 environment jumps to the line of code at that address: the compare function. Something went wrong inside this line of code.
In the variables window, you can show the values of each variable in the current section of code, including m and n. In this case, it also shows the memory location. By dragging this variable to the Memory window, you should see what the memory contents at that location are. Except you can’t. The memory at that address is defined as invalid; the MMU refuses access, and it looks like your program is attempting to do just that. So it looks like the compare function is the function that is creating the abort, but only because someone is feeding it with wrong information.
Dividing by Zero
Processors are exceptionally well designed for working with integers: real numbers. When working with floating numbers, although still good, they become a little less optimal, and when working with specialized numbers such as imaginary numbers or fractions, operations have to be done in software to emulate these numbers.
Dividing by zero is the software killer; when it crops up, it can crash the sturdiest machines. The mathematics behind this is that dividing a number is equivalent to multiplying by a number’s multiplicative inverse; dividing by 2 is the same as multiplying by 1 over 2, or 0.5. The product of a number and its multiplicative inverse is always 1. Two times 1 over 2 is 1. The problem when dividing by zero is that zero doesn’t have a multiplicative inverse. The answer is something that therefore cannot be expressed as an integer and something that the processor cannot do. In the face of such an impossibility, it prefers to throw an exception and refuses to continue without a helping hand. Division by zero in a system application is a sure way to crash the entire application, but on an embedded device without an operating system, the results can be disastrous.
The catch in division by zero is that it is not always the instruction that generates the exception that is at fault. It can often occur in a C library, only because the main application passed zero as an argument. Because the C library might not have error checking to see if the user passed zero, as that would cause more cycles to be spent, most libraries rather accept any argument, and specify that zero should never be used. In this case, using a debugger to catch the exception, and then looking at the application stack to see when and how the routine was called, often gives a good indication.
Of course, sometimes the exception is in a line of calculation, and in this case, it is easy to debug. The offending line is the one generating the exception, and after using a debugger to locate the problem, the developer can then correct the offending code.
IN-DEPTH ANALYSIS
Debugging is often considered to be an art, acquired after several in-depth debugging sessions. Many problems can arise during development, and sometimes a bug will be a combination of several problems. So far in this chapter I have listed some of the most common problems. Now I will show a few real-world examples where debugging was required, and where the root cause was not always what it was thought to be.
Data Abort
Situation: A project uses a special R&D-only bootloader to reflash the system in case of corruption. This is a bootloader executed at a privileged level, and all interrupts are disabled. Data is received on a serial line using polling. A watchdog has to be serviced every 60 seconds, or the system reboots. A flash driver has been developed to write the data received; a serial driver has been developed to write standard debug info and to receive a new firmware. Other than that, no systems are needed.
When running the software, the client can connect to the bootloader, send commands, and upload a new flash binary, but the transfer fails and the system freezes. A reconnection isn’t possible immediately but is often possible 10 seconds later, so the initial analysis is that it is not a problem with the watchdog. Something is probably wrong with the serial driver.
For this analysis, the development team looked at the C code and initially couldn’t find anything wrong. Debug lines were added but to no avail.
On this particular setup, a JTAG debugger was available, and a binary was created and flashed onto the target. Step by step took too long to be of any use, so breakpoints were inserted into the code. Out of habit, a watch was put on the exception vectors, including Data Abort. And indeed, the ARM processor did go into a Data Abort exception.
Data Abort means that the application was trying to read or write an illegal memory location. r14 held the value 0x1FFE7208, and by subtracting 8 from that value (to take into account the instruction queue), the address 0x1FFE7200 resulted. This is the address that caused the data abort. Looking to the C code, it was the macro used to write a specific value into the watchdog register. Nothing looked wrong with the C code, so we went deeper, into the assembly code.
Here is an extract of that code:
MOVW r0, #0x8002
MOVT r0, #0x73F9
MOVW r1, 0x5555
STR r1, [r0]
Running step by step, we saw that r0 was constructed as 0x73F98002 and r1 contained 0x5555. The processor documentation stated that to clear the watchdog timer, we first had to send 0x5555 and then 0xaaaa to a register, a 16-bit register located at 0x73F98002. The problem with this is that0x73F98002 is not aligned on a 4-byte boundary. What’s more, STR attempted to write a 32-bit number. When this happened, the processor went into a Data Abort exception, and because we didn’t handle exceptions, it looped back and forth until the watchdog kicked in.
This was somewhere between a compiler problem and a development problem. The compiler didn’t know that we wanted to pass a 16-bit number and so happily tried to write a 32-bit variable into a non-aligned zone. If it had been aligned, the problem would have been different. We would have written a 32-bit variable onto a 16-bit register, plus another register behind it, potentially creating strange side effects. In this case, the short routine was written in assembly to test if the problem had been found, replacing STR with STRH (store half-word), and the program worked perfectly.
Corrupted Serial Line
Situation: A home appliance device using a Cortex-A has a homemade bootloader. This bootloader is designed to enable a user to upload a new flash image in case of flash corruption or in case of a failed firmware upgrade. When testing the firmware upload process, the CPU generates undefined instruction exceptions.
When the firmware is detected as faulty, or when a specific button is pressed to power on, the bootloader waits for data on a UART serial line. When the data has been received, it is flashed into NAND flash, and the system reboots. During tests, we were surprised to see the undefined instruction exception occurring, not every time, but about one in five downloads.
For this problem, we immediately used a hardware debugger. We placed a breakpoint on the Undefined Instruction vector and waited. A few minutes later, we got what we wanted. In RAM, at the exact location, was an instruction that didn’t look right.
NAND flash memory is a special soft of memory that requires a bit of software to run. Unlike conventional memory, it cannot be used to run programs directly. NAND memory is fragile and can become worn out over time. To avoid problems, each memory location stores other data, including CRC data. Therefore, software has to be written to extract data from NAND and placed into internal RAM before executing it. Could it be that this routine was somehow wrong?
A hardware debugger gave us access to a lot of information, including the contents of the NAND memory. The hardware debugger “dumped” the contents to a file. Because the contents were copied to memory, at location 0x20000000, we also told the debugger to dump the contents of the RAM. We did a binary compare of the two files, and they were identical up until the last byte of the firmware. Reading from NAND wasn’t the problem, so maybe we put bad data into NAND?
The bootloader was designed to receive data from a serial line. It would open a connection and wait for data. When data arrived, it was copied into RAM. An end of file was indicated by two distinct 32-bit values. When the bootloader received those two values, it then copied the firmware stored in RAM into the NAND flash before giving control to the first instruction of the firmware.
The breakpoints were changed, and the system was programmed to break on 0x20000000, the first instruction of the firmware, just after being written to NAND. Again, the contents of RAM and NAND were dumped and compared. And again, they were identical. The NAND routines looked like they were working exactly as intended; so what could be the cause? If the data written to NAND were correct, does that mean that the data received on the serial line was somehow corrupted? We already had the data from RAM, which was supposed to be the exact firmware binary, so we did a comparison. There was indeed a difference; what the processor received was not what we had sent.
The communication method used was RS-232. It needs to be configured with the baud rate, the speed at which data can travel. It is possible to configure the port to detect parity errors, but in standard practice, it isn’t used. It was configured for 8N1: 8 bits of data, no parity, and one stop bit. Data was sent as small “packets,” resulting in bursts of communication and then a small period of silence. UART devices have small buffers, so we thought that maybe the communications were going too fast and that the buffer filled up, resulting in corrupted data. Again, the debugger helped us to see what was going on. This particular processor had on-board serial ports, and each port had close to a dozen registers to help configure and to read the status. One of the registers contained some valuable information, the amount of buffer overruns, or the amount of times that data was received and the buffer hadn’t been emptied. Zero. That wasn’t the culprit.
The serial port is used later in the application for debugging output, and we had never seen the slightest problem, so maybe there was a difference in the way it was configured? We noted the contents of all the UART registers and then removed all the breakpoints. We rebooted the system again, reloading a firmware and hoping it wouldn’t generate any exceptions. It didn’t, and after a few seconds, debugging information was available on the UART port. We then froze the application with the debugger and looked at the contents of the registers. One of them wasn’t identical. It was the register that controls speed.
When configuring in software, we normally give the speed directly as bauds, an integer of the amount of bits sent and received in a second. 115200 is a common number. In hardware, however, it is often much more difficult; the baud rate has to be calculated from the system clock and then a calculation, a frequency division. By looking at the values we had in the bootloader, we calculated that we were close to the limits of transmission, and by changing the values slightly, we could no longer upload a binary at all. By changing the values again in the opposite direction, the problem no longer occurred.
The analysis used to find the root of the problem is called why-because analysis and is used frequently in accident analysis. It sometimes applies well to software debugging when the root cause isn’t known. It is called why-because because that is exactly the question we ask over and over, why? Why did the exceptions occur? Because the instructions in RAM were corrupted. Why were they corrupted? Because they were incorrectly received. Why were they incorrectly received? Because the serial port configuration wasn’t correctly defined, and the speed was unstable, resulting in some packets being transferred incorrectly. There was no security, no checksum, nor even a length verification. When the problem was analyzed, the port speed was set to the one in the main application, and the bootloader was enhanced with some security features.
64-Bit Calculations
Situation: An application was developed that used 64-bit numbers. The 64-bit number was the current time, the number of microseconds since January 1, 1970. This number was derived from two 32-bit registers; one containing the amount of seconds since the January 1, 1970, and the second register the amount of nanoseconds since the last time pulse, sent by some specialized equipment. We were looking for precision time.
It worked perfectly. And one day, it stopped working. Instead of giving us the current time, it gave some strange results; time seemed to slow down. So we were called in to have a look at the code.
uint32 secondsU32, usecondsU32
uint64 utctimeU64
[ ... ]
utctimeU64 = (secondsU32 * 1000) + (usecondsU32 / 4);
The code is simple enough. UTC Time is the current amount of seconds times 1000, to turn them into milliseconds, and then we add the amount of milliseconds read from another register with a small calculation. Nothing too tricky. So why did it stop working so suddenly? Unit tests were done previous to this, and everything worked fine. We plugged in a debugger to have a closer look. We stepped through the C code, and utctimeU64 did not contain the right value. We stepped through assembly, and we came across this:
MOV r3, [r0 + 0x20]
MOV r4, 0x3E8
MUL r4, r4, r3
This part caught our attention. The code was easy enough to spot because 0x3E8 in hexadecimal gives 1000 in decimal. What was presumed to be secondsU32 is loaded into r3 and then 1000 into r4. The final calculation, the contents of r3 × r4, is placed into r4. There is one problem with that; when looking at the value of r3, it was clear that any operation on it would immediately overflow the resulting register, and data would be lost. It isn’t just a little bit of data that is lost but a full 9 bits of data. What intrigued us was the use of MUL, where UMULL or SMULL would have been appropriate.
The real reason was faulty code. By running step by step in C, the problem wasn’t clearly visible. By stepping in assembly, we saw it immediately. The line in C was:
utctimeU64 = (secondsU32 * 1000) + (usecondsU32 / 4);
That reasoning, although sound, just isn’t correctly written. The compiler will take secondsU32, and multiply it by 1000. In other words, it takes the register containing secondsU32 and multiplies that value by 1000, which could possibly result in an overflow, and it did. To correct the code, we copied secondsU32 into a 64-bit value before performing the multiplication, therefore eliminating any possibility of an overflow. The fact that it worked previously was just luck; this was a problem that had been created a few years previously and hadn’t an overflow problem until a specific point in time. Unit testing was added to make the test more extreme.
A Timely Response
Situation: An ARM1176 is used in a real-time application in a laser laboratory. Usually used for calculation, the processor use is at approximately 90 percent capacity. Rarely, when a crossbeam is fired, a fast interrupt is issued, and an operation must be executed immediately. The window of operation is only a few nanoseconds wide, but technically, the core should handle it without a problem. However, the core misses the target every time.
When the crossbeam is fired, a drop of fuel is evaporated, and the resonance must be registered. It is not possible to warn the ARM1176 a few nanoseconds before the beam is fired, so it must react immediately.
When this happens, a fast interrupt is issued. The fast interrupt was chosen especially for the speed at which it can be executed and its priority over all other operations. The FIQ code was optimized, helping to shave off a few nanoseconds when starting, but the code was working well; the only problem was the time taken to start the code.
This processor was chosen specifically for the task. The ARM1176 is used in real-time applications, using little energy and clocked at speeds up to 1 GHz. The ARM1176 was chosen over an ARM1156, more suited to real-time applications, because of its computational power and low energy consumption. By using less power than other CPUs, it could be placed next to (or inside) the experiment, and the low heat radiation meant that it could run without interfering. However, it looked like the processor wasn’t doing what it was supposed to do, and some staff wanted to return to the ARM1156.
An external team was brought in to see if anything could be done. After some analysis with a debugger, the verdict came back. The vector table and the MMU had not been used correctly.
The MMU did not have a lot of configuration. The memory was mapped according to a layout, but it used only L1 page tables, so only 4096 entries. The SDRAM was mapped to different locations.
When analyzing the vector table, one thing became immediately apparent. The fast interrupt vector was a branch instruction, branching into main memory. The Fast Interrupt vector is placed at the end of the vector table, one of the reasons that code can be placed immediately after the table, saving a branch. Even worse, this branch was sent into SDRAM memory when the ARM1176 has tightly coupled memory.
No code was changed in this project, but the memory layout was slightly changed. The interrupt handler was placed at the end of the vector table and was placed inside tightly coupled memory. This shaved off a few nanoseconds, enough for the interrupt handler to respond as required.
This last example is between two worlds. It required a debugger to look at the system, especially the vectors, but the problem wasn’t necessarily the code. The problem came from something known as optimization; the code works, but the code or system needs to be tweaked to obtain satisfactory results. This brings us to the next chapter that discusses optimization.
SUMMARY
This chapter shows different debugger solutions, ranging from software to hardware. Each system has its advantages, and often, a mix of both hardware and software is required. In the next chapter, you see what happens after the debugging phase finishes and another potential use for debuggers: optimization.
All materials on the site are licensed Creative Commons Attribution-Sharealike 3.0 Unported CC BY-SA 3.0 & GNU Free Documentation License (GFDL)
If you are the copyright holder of any material contained on our site and intend to remove it, please contact our site administrator for approval.
© 2016-2026 All site design rights belong to S.Y.A.