Java 8 Recipes, 2th Edition (2014)
CHAPTER 11. Debugging and Unit Testing
Debugging is a big part of software development. To effectively debug, you must be able to “think” like a computer and dive into the code, deconstructing every step that lead to the logic error that you’re working to resolve. In the beginning of computer programming, there weren’t a lot of tools to help in debugging. Mostly, debugging involved taking a look at your code and spotting inconsistencies; then resubmitting the code to be compiled again. Today, every IDE offers the ability of using breakpoints and inspecting memory variables, making it much easier to debug. Outside the IDE there are other tools that help in daily debugging, building, and testing of your project; and these tools ensure that your code is being continually tested for errors introduced when programming. In this chapter, you explore the different tools that will help aid in debugging, analyzing, and testing Java software.
This chapter covers some debugging and unit testing basics. You will learn how to perform unit testing from the command-line or terminal using Apache Ant, along with JUnit. You will also learn how to make use of the NetBeans Profiler, among other tools, for profiling and monitoring your applications.
11-1. Understanding Exceptions
Problem
You caught and logged an exception, and you need to determine its cause.
Solution
Analyze the output from the exception’s printStackTrace() method:
try {
int a = 5/0;
} catch (Exception e) {
e.printStackTrace();
}
Result:
java.lang.ArithmeticException: / by zero
at org.java8recipes.chapter11.recipe11_01.Recipe11_1.start(Recipe11_1.java:18)
at org.java8recipes.chapter11.recipe11_01.Recipe11_1.main(Recipe11_1.java:13)
How It Works
In programming lingo, a stack refers to the list of functions that were called to get to a point in your program, usually starting from the immediate (System.out.println()) to the more general (public static void main). Every program keeps track of which code was executed in order to reach a specific part of the code. Stack trace’s output refers to the stack that was in memory when an error occurred. Exceptions thrown in Java keep track of where they occurred and which code path was executed when the exception was thrown. Stack trace shows from the most specific place where the exception happened (the line where the exception occurred) to the top-level invoker of the offending code (and everything in between). This information then allows you to pinpoint which method calls were performed, and may help shed some light on why the exception was thrown.
In this example, the divide-by-zero exception occurred on line 18 of Recipe11_1.java and was caused by a call from the main() method (at line 13). Sometimes, when looking at the stack trace’s output , you will see methods that don’t belong to the project. This happens naturally as sometimes method calls are generated in other parts of a working system. It is, for example, very common to see AWT methods in Swing applications when an exception is raised (due to the nature of the EventQueue). If you look at the more specific function calls (earliest), you will eventually run with the project’s own code and can then try to determine why the exception was thrown.
![]() Note The Stack trace output will contain line number information if the program is compiled with “Debug” info. By default, most IDEs will include this information when running in a Debug configuration.
Note The Stack trace output will contain line number information if the program is compiled with “Debug” info. By default, most IDEs will include this information when running in a Debug configuration.
11-2: Locking Down Behavior of Your Classes
Problem
You need to lock down the behavior of your class and want to create unit tests that will be used to verify the specific behavior in your application.
Solution
Use JUnit to create unit tests that verify behavior in your classes. To use this solution, you need to include the JUnit dependencies in your class path. JUnit can be downloaded from http://www.junit.org. Once it’s downloaded, add the junit-xxx.jar and junit-xxx-dep.jar files to your project or class path (where xxx is the downloaded version number). When JUnit becomes part of your project, you will be able to include the org.junit and junit.framework namespaces.
In this example two unit tests are created for the MathAdder class. The MathAdder class contains two methods: addNumber (int, int) and substractNumber (int,int). These two methods return the addition (or subtraction) of their passed parameters (a simple class). The unit tests (marked by the @Test annotation) verify that the MathAdder class does, in fact, add and/or subtract two numbers.
package org.java8recipes.chapter11;
import junit.framework.Assert;
import org.junit.Test;
public class Recipe11_2_MathAdderTest {
@Test
public void testAddBehavior() {
Recipe_11_2_MathAdder adder = new Recipe_11_2_MathAdder();
for (int i =0;i < 100;i++) {
for (int j =0;j < 100;j++) {
Assert.assertEquals(i+j,adder.addNumbers(i,j));
}
}
}
@Test
public void testSubstractBehavior() {
Recipe_11_2_MathAdder adder = new Recipe_11_2_MathAdder();
for (int i =0;i < 100;i++) {
for (int j =0;j < 100;j++) {
Assert.assertEquals(i-j,adder.substractNumber(i,j));
}
}
}
}
To execute this test, use your IDE to run the test class. For example, in NetBeans, you must refactor the test class to place it into the “Test Packages” module within the NetBeans project. Once you’ve moved the test class into the desired package within “Test Packages,” run the file to perform the tests.
How It Works
Unit tests are useful for testing your code to ensure that expected behaviors occur within your classes. Including unit tests in your project makes it less likely to break functionality when adding or refactoring code. When you create unit tests, you are specifying how an object should behave (what is referred to as its contract). The unit tests ensure that the expected behavior occurs (they do this by verifying the result of a method and using the different JUnit.Assert methods).
The first step to writing a unit test is to create a new class that describes the behavior you want to verify. One of the general unit–test naming conventions is to create a class with the same name as the class being tested with the postfix of Test; in this recipe’s example, the main class is called Recipe11_2_MathAdder, while the testing class is called Recipe11_2_MathAdderTest.
The unit test class (MathAdderTest) will contain methods that check and verify the behavior of the class. To do so, method names are annotated. Annotations are forms of metadata, and a developer can “annotate” specified portions of code, thereby adding information to the annotated code. This extra information is not used by the program, but by the compiler/builder (or external tools) to guide the compilation, building, and/or testing of the code. For unit-testing purposes, you annotate the methods that are part of the unit test by specifying @Test before each method name. Within each method, you use Assert.assertEquals (or any of the other Assert static methods) to verify behavior.
The Assert.assertEquals method instructs the unit-testing framework to verify that the expected value of the method call from the class that you are testing is the same as the actual value returned by its method call. In the recipe example, Assert.assertEquals verifies that the MathAdder is correctly adding the two integers. While the scope of this class is trivial, it shows the bare minimum requirements to have a fully functional unit test.
If the Assert call succeeds, it gets reported in the unit test framework as a “passed” test; if the Assert call fails, then the unit test framework will stop and display a message showing where the unit test failed. Most modern IDEs have the capability of running unit test classes by simply right-clicking the name and selecting Run/Debug (and that’s the intended way of running the Chapter_11_2_MathAdderTest recipe).
While it is true that IDEs can run unit tests while developing, they are created with the intention of being run automatically (usually triggered by a scheduled build or by a version control system’s check-in), which is what the Recipe 11-3 talks about.
11-3. Scripting Your Unit Tests
Problem
You want to automatically run your unit tests, rather than manually invoke them.
Solution
Use and configure JUnit and Ant. To do so, follow these steps:
1. Download Apache Ant (located at http://ant.apache.org/).
2. Uncompress Apache Ant into a folder (for example, c:\ant for Windows systems or /Development for OS X).
3. Make sure that Apache Ant can be executed from the command-line or terminal. In Windows, this means adding the apache-ant/bin folder to the path as follows:
a. Go to Control Panel ![]() System.
System.
b. Click Advanced system settings.
c. Click Environment Variables.
d. In the System Variables list, double-click the variable name PATH.
e. At the end of the string, add ;C:\apache-ant-1.8.2\bin (or the folder that you uncompressed Apache Ant into).
f. Click OK (on each of the popup boxes that were opened before) to accept the changes.
![]() Note Apache Ant comes pre-installed on OS X, so you do not have to install or configure it. To verify this, open a terminal window and type ant –version to see which version is installed on the system.
Note Apache Ant comes pre-installed on OS X, so you do not have to install or configure it. To verify this, open a terminal window and type ant –version to see which version is installed on the system.
4. Make sure that the JAVA_HOME environment variable is defined. In Windows, this means adding a new environment variable called JAVA_HOME. For example:
5. Go to Control Panel ![]() System.
System.
6. Click Advanced system settings.
7. Click Environment Variables. In the System Variables list, check to see whether there is variable named JAVA_HOME and that the value points to your JDK distribution. If JAVA_HOME is not present, click New. Set the variable name to JAVA_HOME and set the variable value to C:\Program Files\Java\jdk1.7.0 or the root of your JDK 7 installation.
On OS X, environment variables are set up within the .bash profile file, which resides within the user home directory. To add JAVA_HOME, add a line such as the following to the .bash_profile:
export JAVA_HOME=/Library/Java/JavaVirtualMachines/jdk1.8.0.jdk/Contents/Home
Test that you can reach Ant, and that Ant can find your JDK installation. To test that the changes took effect, do the following:
8. Open a command window or terminal.
9. Type ANT.
If you receive the message "Ant is not recognized as an internal or external command", redo the first steps of setting up the PATH variable (the first set of instructions). If you receive the message "unable to locate tools.jar", you need to create and/or update the JAVA_HOME path for your installation (the second set of instructions).
The message "Buildfile: build.xml does not exist!" means that your setup is ready to be built using Ant. Congratulations!
![]() Note When changing environment variables in Microsoft Windows, it is necessary to close previous command-line windows and reopen them because changes are only applied to new command windows. To open a command window in Microsoft Windows, click Start, type CMD, and press Enter.
Note When changing environment variables in Microsoft Windows, it is necessary to close previous command-line windows and reopen them because changes are only applied to new command windows. To open a command window in Microsoft Windows, click Start, type CMD, and press Enter.
Create build.xml at the root of your project and put the following bare-bones Ant script as the contents of the build.xml file. This particular build.xml file contains information that Ant will use to compile and test this recipe.
<project default="test" name="Chapter11Project" basedir=".">
<property name="src" location="src"/>
<property name="build" location="build/"/>
<property name="src.tests" location="src/"/>
<property name="reports.tests" location="report/" />
<path id="build.path">
<fileset dir="dep">
<include name="**/*.jar" />
</fileset>
<pathelement path="build" />
</path>
<target name="build">
<mkdir dir="${build}" />
<javac srcdir="${src}" destdir="${build}">
<classpath refid="build.path" />
</javac>
</target>
<target name="test" depends="build">
<mkdir dir="${reports.tests}" />
<junit fork="yes" printsummary="yes" haltonfailure="yes">
<classpath refid="build.path" />
<formatter type="plain"/>
<batchtest fork="yes" todir="${reports.tests}">
<fileset dir="${src.tests}">
<include name="**/*Test*.java"/>
</fileset>
</batchtest>
</junit>
</target>
</project>
![]() Note To execute this recipe, open a command-line window or terminal, navigate to the Chapter 11 folder, type ant, and press Enter.
Note To execute this recipe, open a command-line window or terminal, navigate to the Chapter 11 folder, type ant, and press Enter.
How It Works
Apache Ant (or simply Ant) is a program that allows you to script your project’s build and unit testing. By configuring Ant, you can build, test, and deploy your application using the command-line. (In turn, it can be scheduled to be run automatically by the operating system.) Ant can automatically run unit tests and report on the result of these tests. These results can then be analyzed after each run to pinpoint changes in behavior.
Due to Ant’s complexity, it has a large learning curve, but it allows for a lot of flexibility on compiling, building, and weaving code. By using Ant, it is possible to achieve the utmost configuration on how your project is built.
![]() Note Visit http://ant.apache.org/manual/index.html for a more in-depth tutorial of Ant.
Note Visit http://ant.apache.org/manual/index.html for a more in-depth tutorial of Ant.
The build.xml file contains instructions on how to compile your project, which class path to use, and what unit tests to run. Each build.xml contains a <project> tag that encapsulates the steps to build the project. Within each <project> there are targets, which are “steps” in the build process. A <target> can depend on other targets, allowing you to establish dependencies in your project (in this recipe’s example, the target “test” depends on the target “build,” meaning that to run the test target, Ant will first run the build target).
Each target contains tasks. These tasks are extensible, and there is a core set of tasks that you can use out of the box. The <javac>task will compile a set of Java files specified within the src attribute and write the output to the dest attribute. As part of the <javac> task, you can specify which class path to use. In this example, the class path is specified by referring to a previously defined path, known as build.path. Ant provides ample support for creating class paths. In this recipe, the class path is defined as any file that has the .jar extension located in the depfolder.
The other task in the build target is <junit>. This task will find a unit test specified in its task and run it. The unit tests are defined within the <batchtest> property. By using the <fileset> property, it is possible to tell JUnit to find any file that has the word Test in its name and ends with the .java extension. Once JUnit runs each test, it will write out a summary to the console and write a report on the results of the unit tests to the reports.tests folder.
![]() Note You can define variables in a build.xml file by using the <property> tag. Once a property is defined, it can be accessed as part of another task using the ${propertyName} syntax. This allows you to quickly change a build script in response to structural changes (for example, switching target/source folders around).
Note You can define variables in a build.xml file by using the <property> tag. Once a property is defined, it can be accessed as part of another task using the ${propertyName} syntax. This allows you to quickly change a build script in response to structural changes (for example, switching target/source folders around).
11-4. Finding Bugs Early
Problem
You want to ensure that you are able to find the maximum number of bugs at design time.
Solution
Use FindBugs to scan your software for issues. Use an Ant build file that includes FindBugs for reporting purposes.
The following is the new build.xml file that adds FindBugs reporting:
<project default="test" name="Chapter11Project" basedir=".">
<property name="src" location="src"/>
<property name="build" location="build/"/>
<property name="reports.tests" location="report/" />
<property name="classpath" location="dep/" />
<!-- Findbugs Static Analyzer Info -->
<property name="findbugs.dir" value="dep/findbugs" />
<property name="findbugs.report" value="findbugs" />
<path id="findbugs.lib" >
<fileset dir="${findbugs.dir}" includes="*.jar"/>
</path>
<taskdef name="findbugs" classpathref="findbugs.lib" classname="edu.umd.cs.findbugs.anttask.
indBugsTask"/>
<path id="build.path">
<fileset dir="dep">
<include name="**/*.jar" />
</fileset>
</path>
<target name="clean">
<delete dir="${build}" />
<delete dir="${reports.tests}" />
<delete dir="${coverage.dir}" />
<delete dir="${instrumented}" />
<mkdir dir="${build}" />
<mkdir dir="${reports.tests}" />
<mkdir dir="${coverage.dir}" />
</target>
<target name="build">
<javac srcdir="${src}" destdir="${build}" debug="${debug}">
<classpath refid="build.path" />
</javac>
</target>
<target name="test" depends="clean,build">
<junit fork="yes" printsummary="yes" haltonfailure="yes">
<classpath refid="build.path" />
<formatter type="plain"/>
<batchtest fork="yes" todir="${reports.tests}">
<fileset dir="${build}">
<include name="**/*Test*.class"/>
</fileset>
</batchtest>
<jvmarg value="-XX:-UseSplitVerifier" />
</junit>
</target>
<target name="findbugs" depends="clean">
<antcall target="build">
<param name="debug" value="true" />
</antcall>
<mkdir dir="${findbugs.report}" />
<findbugs home="${findbugs.dir}"
output="html"
outputFile="${findbugs.report}/index.html"
reportLevel="low"
>
<class location="${build}/" />
<auxClasspath refid="build.path" />
<sourcePath path="${src}" />
</findbugs>
</target>
</project>
To run this recipe, download FindBugs (http://findbugs.sourceforge.net/downloads.html). Uncompress into a folder in your computer, then copy the contents of the ./lib/ folder into your project’s /dep/findbugs folder (create the /dep/findbugs folder if necessary). Make sure that /dep/findbugs/findbugs.jar and /dep/findbugs/findbugs-ant.jar are present.
How It Works
FindBugs is a Static Code Analyzer (SCA). It will parse your program’s compiled file and spot errors in coding (not syntax errors, but certain types of logic errors). As an example, one of the errors that FindBugs will spot is comparing two strings using == instead ofString.equals(). The analysis is then written as HTML (or text) that can be viewed with a browser. Catching errors from FindBugs is easy, and adding it as part of your continuous integration process is extremely beneficial.
At the beginning of build.xml, you define the FindBugs tasks. This section specifies where the .jar files are that define the new task (dep\findbugs), and also determines where to put the report when done.
The build.xml also has a new target project called “findbugs.” The findbugs target compiles the source files with debug information (having debug information helps on the FindBugs report as it will include the line number when reporting errors), and then proceeds to analyze the byte-code for errors. In the findbugs task, you specify the location of the compiled .class files (this is the <class> property), the location of the dependencies for your project (<auxClasspath> property), and the location of the source code (<sourcePath> property).
Within the findbugs target, there is an <antcall> task. The <antcall> task simply runs the target specified within the <antcall> task. Just before the <antcall> task, you assign the debug <property> to true. This in turns gets passed to the <javac> task asdebug="${debug}". When the debug <property> is set to true, the <javac> task will include debug information into the compilation of the Java source files. Having debug information in the compiled files will help generate a more readable FindBugs report, as it will include line numbers for where issues are found. The trick of assigning properties from within an Ant target is used throughout build.xml files to selectively enable certain behavior when going through specific build targets. If you were to build the regular build target, the results of the build would not contain debug information. If instead, you were to build the findbugs target because the findbugs target replaces the debug <property> to true, the result of the build would have debug information.
![]() Tip To invoke Ant to run the default “target” (as specified in the build.xml), you just type ant. To specify another .xml file (instead of build.xml), you type ant –f nameofotherfile.xml. To change the default target to run, you type the name of the target at the end (for example, ant clean). To run this example, type ant –f findbugsbuild.xml findbugs. This will ask Ant to use the findbugsbuild.xml file and to run the findbugs target.
Tip To invoke Ant to run the default “target” (as specified in the build.xml), you just type ant. To specify another .xml file (instead of build.xml), you type ant –f nameofotherfile.xml. To change the default target to run, you type the name of the target at the end (for example, ant clean). To run this example, type ant –f findbugsbuild.xml findbugs. This will ask Ant to use the findbugsbuild.xml file and to run the findbugs target.
11-5. Monitoring Garbage Collection in your Application
Problem
You notice that your application seems to be slowing down and suspect that there are garbage collections happening.
Solution 1
Add -Xloggc:gc.log-XX:+PrintGCDetails-XX:+PrintGCTimeStamps as parameters when starting your Java program. These parameters allow you to log garbage collection information to the gc.log file, including the time garbage collections occur, along with the details (if it was a minor or major garbage collection and how long it took).
Ant target that executes Recipe 11_5 with garbage logging on.
<target name="Recipe11_5" depends="build">
<java classname="org.java8recipes.chapter11.Recipe11_5" fork="true">
<classpath refid="build.path" />
<jvmarg value="-Xloggc:gc.log" />
<jvmarg value="-XX:+PrintGCDetails" />
<jvmarg value="-XX:+PrintGCTimeStamps" />
</java>
</target>
In this build.xml file, the Java task is being used to add the arguments for garbage collection logging to the compiler before launching the application. To run this example throughout Ant, type ant Recipe11_5.
Solution 2
Analyze your program’s memory consumption and more by using the NetBeans “Profiler” tool. To run the profiler, select the file or project that you want to perform the profiling against and choose the Profile Project or Profile File command from within the NetBeans Profile menu. You can also right-click the project or file to access the contextual menu Profile option.
The Profiler dialog (Figure 11-1) will open, allowing you to select and configure options. In this solution, simply select the Run button to perform the profiling with the default settings.
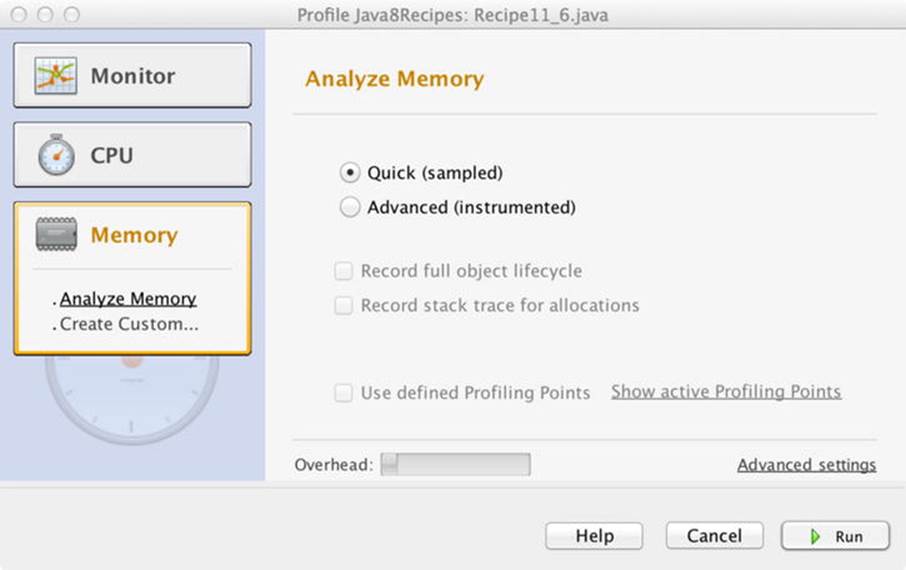
Figure 11-1. NetBeans Profiler
Once the profiler begins, it will run until you stop it using the Stop button on the Controls panel. The generated output should resemble something like that shown in Figure 11-2.
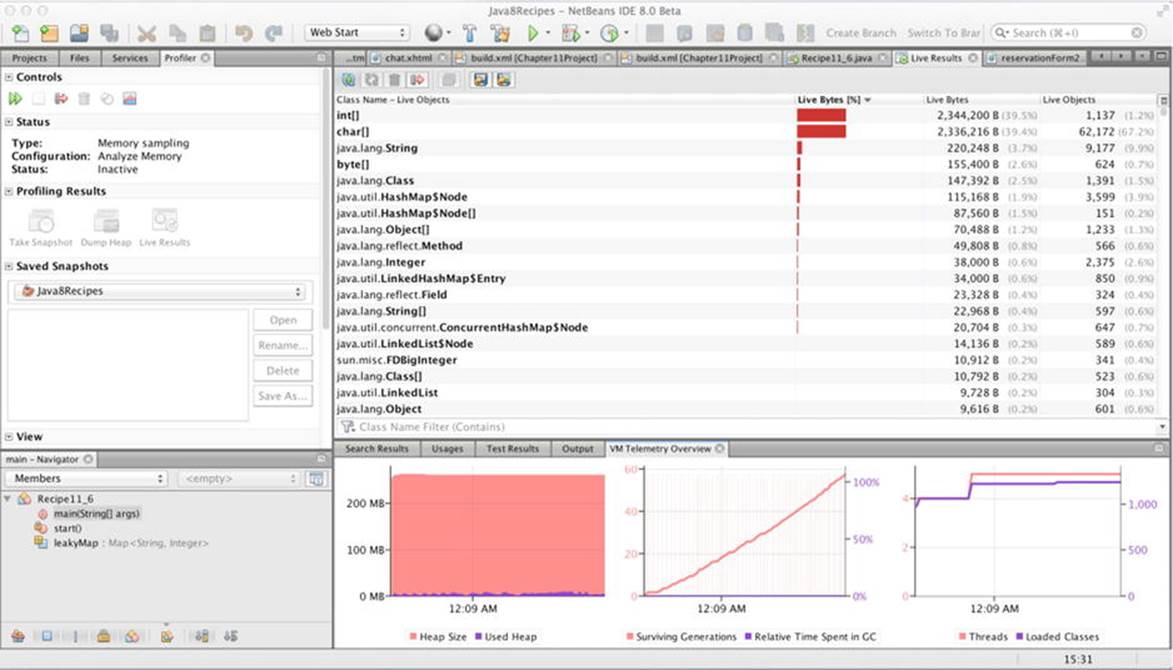
Figure 11-2. NetBeans Profiler results
How It Works
Adding the flag to log garbage collection in solution 1 will cause your Java application to write minor and major garbage collections information into a log file. This allows you to “reconstruct” in time what happened to the application and to spot probable memory leaks (or at least other memory-related issues). This is the preferred troubleshooting method for production systems, as it is usually lightweight and can be analyzed after the fact.
Solution 2 instead involves using an open source tool that comes installed with NetBeans IDE. This tool allows you to profile code while it is running. It is a great tool to understanding in situ what’s occurring within your application, as you can see real-time CPU consumption, garbage collections, threads created, and classes loaded.
This recipe barely scratches the surface of the NetBeans profiler. See the online documentation at https://profiler.netbeans.org/ for more information.
![]() Note Before you can use the NetBeans profiler, you must calibrate the target JVM. To do so, open the Manage Calibration Data dialog within NetBeans and select the JVM that you want to calibrate. You can find the Manage Calibration Data option by opening the Profile menu, then choosing Advanced Commands.
Note Before you can use the NetBeans profiler, you must calibrate the target JVM. To do so, open the Manage Calibration Data dialog within NetBeans and select the JVM that you want to calibrate. You can find the Manage Calibration Data option by opening the Profile menu, then choosing Advanced Commands.
11-6. Obtaining a Thread Dump
Problem
Your program seems to “hang” without doing anything, and you suspect that there might be a deadlock.
Solution
Use JStack to get a thread dump, and then analyze the thread dump for deadlocks. The following JStack is a thread dump from the class org.java8recipes.chapter11.recipe11_06.Recipe 11_6, which creates a deadlock:
jstack -l 6557
Found one Java-level deadlock:
=============================
"Thread-0":
waiting for ownable synchronizer 0x000000076ab20da0, (a java.util.concurrent.locks.ReentrantLock$NonfairSync),
which is held by "main"
"main":
waiting for ownable synchronizer 0x000000076ab20dd0, (a java.util.concurrent.locks.ReentrantLock$NonfairSync),
which is held by "Thread-0"
Java stack information for the threads listed above:
===================================================
"Thread-0":
at sun.misc.Unsafe.park(Native Method)
- parking to wait for <0x000000076ab20da0> (a java.util.concurrent.locks.ReentrantLock$NonfairSync)
at java.util.concurrent.locks.LockSupport.park(LockSupport.java:175)
at java.util.concurrent.locks.AbstractQueuedSynchronizer.parkAndCheckInterrupt(AbstractQueuedSynchronizer.java:836)
at java.util.concurrent.locks.AbstractQueuedSynchronizer.acquireQueued(AbstractQueuedSynchronizer.java:870)
at java.util.concurrent.locks.AbstractQueuedSynchronizer.acquire(AbstractQueuedSynchronizer.java:1199)
at java.util.concurrent.locks.ReentrantLock$NonfairSync.lock(ReentrantLock.java:209)
at java.util.concurrent.locks.ReentrantLock.lock(ReentrantLock.java:285)
at org.java8recipes.chapter11.recipe11_06.Recipe11_6.lambda$start$0(Recipe11_6.java:25)
at org.java8recipes.chapter11.recipe11_06.Recipe11_6$$Lambda$1/1528902577.run(Unknown Source)
at java.lang.Thread.run(Thread.java:744)
"main":
at sun.misc.Unsafe.park(Native Method)
- parking to wait for <0x000000076ab20dd0> (a java.util.concurrent.locks.ReentrantLock$NonfairSync)
at java.util.concurrent.locks.LockSupport.park(LockSupport.java:175)
at java.util.concurrent.locks.AbstractQueuedSynchronizer.parkAndCheckInterrupt(AbstractQueuedSynchronizer.java:836)
at java.util.concurrent.locks.AbstractQueuedSynchronizer.acquireQueued(AbstractQueuedSynchronizer.java:870)
at java.util.concurrent.locks.AbstractQueuedSynchronizer.acquire(AbstractQueuedSynchronizer.java:1199)
at java.util.concurrent.locks.ReentrantLock$NonfairSync.lock(ReentrantLock.java:209)
at java.util.concurrent.locks.ReentrantLock.lock(ReentrantLock.java:285)
at org.java8recipes.chapter11.recipe11_06.Recipe11_6.start(Recipe11_6.java:34)
at org.java8recipes.chapter11.recipe11_06.Recipe11_6.main(Recipe11_6.java:18)
Found 1 deadlock.
For this recipe to function properly on Windows, you must have as part of your PATH environment variable the JDK’s bin folder (For example C:\Program Files\java\jdk1.8.0\bin). If you have this path, you can run the tools such as JStack and JPS. JStack comes pre-installed on OS X, so you should be able to run it out of the box.
The JStack command uses as an argument –l (a dash and the letter L), which specifies a Long listing (it does extra work to get more information about the threads running). The JStack also needs to know the PID of the target VM. A quick way to list all running JVMs is to type JPS and press Enter. This will list the running VMs and their PIDs. Figure 11-3 shows a screenshot of a JStack finding a deadlock in Recipe 11-6 from an OS X machine.
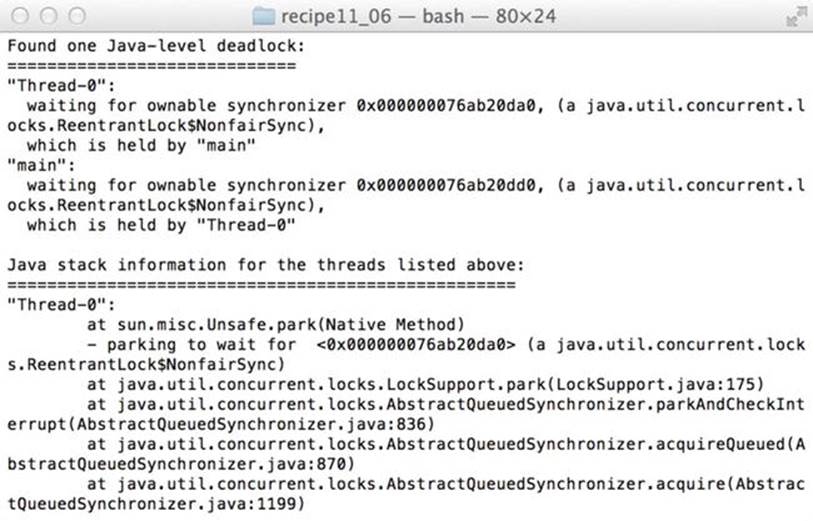
Figure 11-3. JStack results
![]() Note For the purposes of this example, j.u.c.l represents java.util.concurrent.locks, and aqs represents AbstractQueuedSynchronizer.
Note For the purposes of this example, j.u.c.l represents java.util.concurrent.locks, and aqs represents AbstractQueuedSynchronizer.
How It Works
JStack allows you to see all the stack traces that the current running threads have. JStack will also try to find deadlocks (circular dependencies of locks) that might be stalling your system. JStack will not find other problems such as livelock (when a thread is always spinning, such as with something like while(true)), or starvation (when a thread cannot execute because it is too low of a priority or there are too many threads competing for resources), but it will help you understand what each of the threads in your program is doing.
Deadlocks happen because one thread is waiting for a resource that another thread has, and the second thread is waiting for a resource that the first thread has. In this situation, neither thread can continue because both are waiting for each other to release the resource that each one owns. Deadlocks don’t only happen between two threads, but can also involve a “string” of threads so that Thread A is waiting for Thread B is waiting for Thread C is waiting for Thread D is waiting for the original Thread A. It is important to understand the dump to find the culprit resource.
In this recipe’s example, Thread-0 wants to acquire the lock named 0x00000000eab716b8; it’s described in the thread dump as “waiting for ownable synchronizer.” Thread-0 cannot acquire the lock because it is held by the main thread. The main thread, on the other hand, wants to acquire the lock 0x00000000eab716e8 (notice that they are different; the first lock ends in b8, while the second ends in e8), which is held by Thread-0. This is a textbook definition of a deadlock on which each thread is forever waiting for each other to release the lock the other thread has.
Aside from deadlock, looking at thread dumps gives you an idea about what your program is doing in realtime. Especially in multithreaded systems, using thread dumps will help clarify where a thread is sleeping or what condition it is waiting for.
![]() Note JStack is usually lightweight enough to be run in a live system, so if you need to troubleshoot live problems, you can safely use JStack.
Note JStack is usually lightweight enough to be run in a live system, so if you need to troubleshoot live problems, you can safely use JStack.
All materials on the site are licensed Creative Commons Attribution-Sharealike 3.0 Unported CC BY-SA 3.0 & GNU Free Documentation License (GFDL)
If you are the copyright holder of any material contained on our site and intend to remove it, please contact our site administrator for approval.
© 2016-2026 All site design rights belong to S.Y.A.