Linux Bible 9th Ed (2015)
Part II. Becoming a Linux Power User
Chapter 6. Managing Running Processes
IN THIS CHAPTER
1. Displaying processes
2. Running processes in the foreground and background
3. Killing and renicing processes
In addition to being a multiuser operating system, Linux is also a multitasking system. Multitasking means that many programs can be running at the same time. An instance of a running program is referred to as a process. Linux provides tools for listing running processes, monitoring system usage, and stopping (or killing) processes when necessary.
From a shell, you can launch processes, and then pause, stop, or kill them. You can also put them in the background and bring them to the foreground. This chapter describes tools such as ps, top, kill, jobs, and other commands for listing and managing processes.
Understanding Processes
A process is a running instance of a command. For example, there may be one vi command on the system. But if vi is currently being run by 15 different users, that command is represented by 15 different running processes.
A process is identified on the system by what is referred to as a process ID. That process ID is unique for the current system. In other words, no other process can use that number as its process ID while that first process is still running. However, after a process is ended, another process can reuse that number.
Along with a process ID number, other attributes are associated with a process. Each process, when it is run, is associated with a particular user account and group account. That account information helps determine what system resources the process can access. For example, processes run as the root user have much more access to system files and resources than a process running as a regular user.
The ability to manage processes on your system is critical for a Linux system administrator. Sometimes, runaway processes may be killing your system's performance. Finding and dealing with processes, based on attributes such as memory and CPU usage, are covered in this chapter.
NOTE
Commands that display information about running processes get most of that information from raw data stored in the /proc file system. Each process stores its information in a subdirectory of /proc, named after the process ID of that process. You can view some of that raw data by displaying the contents of files in one of those directories (using cat or less commands).
Listing Processes
From the command line, the ps command is the oldest and most common command for listing processes currently running on your system. The top command provides a more screen-oriented approach to listing processes and can also be used to change the status of processes. If you are using the GNOME desktop, you can use gnome-system-monitor to provide a graphical means of working with processes. These commands are described in the following sections.
Listing processes with ps
The most common utility for checking running processes is the ps command. Use it to see which programs are running, the resources they are using, and who is running them. The following is an example of the ps command:
$ ps u
USER PID %CPU %MEM VSZ RSS TTY STAT START TIME COMMAND
jake 2147 0.0 0.7 1836 1020 tty1 S+ 14:50 0:00 -bash
jake 2310 0.0 0.7 2592 912 tty1 R+ 18:22 0:00 ps u
In this example, the u option asks that usernames be shown, as well as other information such as the time the process started and memory and CPU usage for processes associated with the current user. The processes shown are associated with the current terminal (tty1). The concept of a terminal comes from the old days, when people worked exclusively from character terminals, so a terminal typically represented a single person at a single screen. Now, you can have many “terminals” on one screen by opening multiple virtual terminals or Terminal windows on the desktop.
In this shell session, not much is happening. The first process shows that the user named jake opened a bash shell after logging in. The next process shows that jake has run the ps u command. The terminal device tty1 is being used for the login session. The STATcolumn represents the state of the process, with R indicating a currently running process and S representing a sleeping process.
NOTE
Several other values can appear under the STAT column. For example, a plus sign (+) indicates that the process is associated with the foreground operations.
The USER column shows the name of the user who started the process. Each process is represented by a unique ID number referred to as a process ID (PID). You can use the PID if you ever need to kill a runaway process or send another kind of signal to a process. The%CPU and %MEM columns show the percentages of the processor and random access memory, respectively, that the process is consuming.
VSZ (virtual set size) shows the size of the image process (in kilobytes), and RSS (resident set size) shows the size of the program in memory. The VSZ and RSS sizes may be different because VSZ is the amount of memory allocated for the process, whereas RSS is the amount that is actually being used. RSS memory represents physical memory that cannot be swapped.
START shows the time the process began running, and TIME shows the cumulative system time used. (Many commands consume very little CPU time, as reflected by 0:00 for processes that haven't even used a whole second of CPU time.)
Many processes running on a computer are not associated with a terminal. A normal Linux system has many processes running in the background. Background system processes perform such tasks as logging system activity or listening for data coming in from the network. They are often started when Linux boots up and run continuously until the system shuts down. Likewise, logging into a Linux desktop causes many background processes to kick off, such as processes for managing audio, desktop panels, authentication, and other desktop features.
To page through all the processes running on your Linux system for the current user, add the pipe (|) and the less command to ps ux:
$ ps ux | less
To page through all processes running for all users on your system, use the ps aux command as follows:
$ ps aux | less
A pipe (located above the backslash character on the keyboard) enables you to direct the output of one command to be the input of the next command. In this example, the output of the ps command (a list of processes) is directed to the less command, which enables you to page through that information. Use the spacebar to page through and type q to end the list. You can also use the arrow keys to move one line at a time through the output.
The ps command can be customized to display selected columns of information and to sort information by one of those columns. Using the -o option, you can use keywords to indicate the columns you want to list with ps. For example, the next example lists every running process (-e) and then follows the -o option with every column of information I want to display, including:
The process ID (pid), username (user), user ID (uid), group name (group), group ID (gid), virtual memory allocated (vsz), resident memory used (rss), and the full command line that was run (comm). By default, output is sorted by process ID number.
$ ps -eo pid,user,uid,group,gid,vsz,rss,comm | less
PID USER GROUP GID VSZ RSS COMMAND
1 root root 0 19324 1320 init
2 root root 0 0 0 kthreadd
If you want to sort by a specific column, you can use the sort= option. For example, to see which processes are using the most memory, I sort by the rss field. That sorts from lowest memory use to highest. Because I want to see the highest ones first, I put a hyphen in front of that option to sort (sort=-rss).
$ ps -eo pid,user,group,gid,vsz,rss,comm --sort=-rss | less
PID USER GROUP GID VSZ RSS COMMAND
12005 cnegus cnegus 13597 1271008 522192 firefox
5412 cnegus cnegus 13597 949584 157268 thunderbird-bin
25870 cnegus cnegus 13597 1332492 112952 swriter.bin
Refer to the ps man page for information on other columns of information you can display and sort by.
Listing and changing processes with top
The top command provides a screen-oriented means of displaying processes running on your system. With top, the default is to display processes based on how much CPU time they are currently consuming. However, you can sort by other columns as well. After you identify a misbehaving process, you can also use top to kill (completely end) or renice (reprioritize) that process.
If you want to be able to kill or renice processes, you need to run top as the root user. If you just want to display processes, and possibly kill or change your own processes, you can do that as a regular user. Figure 6.1 shows an example of the top window:
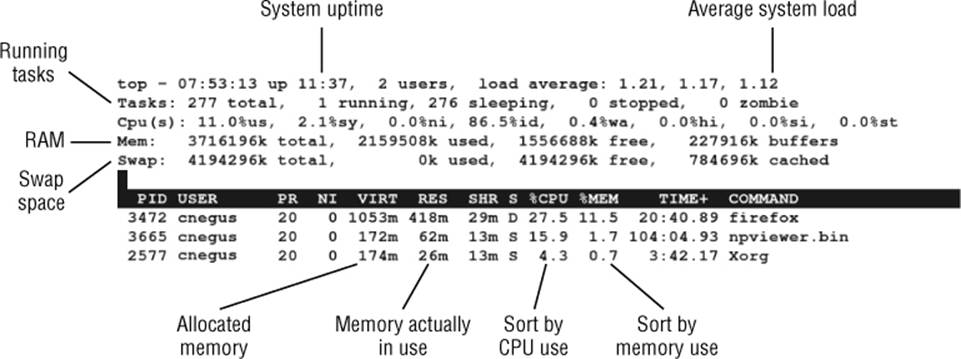
Figure 6.1 Displaying running processes with top.
General information about your system appears at the top of the top output, followed by information about each running process (or at least as many as will fit on your screen). At the top, you can see how long the system has been up, how many users are currently logged in to the system, and how much demand there has been on the system for the past 1, 5, and 10 minutes.
Other general information includes how many processes (tasks) are currently running, how much CPU is being used, and how much RAM and swap are available and being used. Following the general information are listings of each process, sorted by what percent of the CPU is being used by each process. All this information is redisplayed every 5 seconds, by default.
The following list includes actions you can do with top to display information in different ways and modify running processes:
· Press h to see help options, and then press any key to return to the top display.
· Press M to sort by memory usage instead of CPU, and then press P to return to sorting by CPU.
· Press the number 1 to toggle showing CPU usage of all your CPUs, if you have more than one CPU on your system.
· Press R to reverse sort your output.
· Press u and enter a username to display processes only for a particular user.
A common practice is to use top to find processes that are consuming too much memory or processing power and then act on those processes in some way. A process consuming too much CPU can be reniced to give it less priority to the processors. A process consuming too much memory can be killed. With top running, here's how to renice or kill a process:
· Renicing a process: Note the process ID of the process you want to renice and press r. When the PID to renice: message appears, type the process ID of the process you want to renice. When prompted to Renice PID to value: type in a number from –19 to 20. (See “Setting processor priority with nice and renice” later in this chapter for information on the meanings of different renice values.)
· Killing a process: Note the process ID of the process you want to kill and press k. Type 15 to terminate cleanly or 9 to just kill the process outright. (See “Killing processes with kill and killall” later in this chapter for more information on using different signals you can send to processes.)
Listing processes with System Monitor
If you have GNOME desktop available on your Linux system, System Monitor (gnome-system-monitor) is available to provide a more graphical way of displaying processes on your system. You sort processes by clicking columns. You can right-click processes to stop, kill, or renice them.
To start System Monitor from the GNOME 2 desktop, select Applications cmdarr; System Tools cmdarr; System Monitor. Or in GNOME 3, press the Windows key, then type System Monitor and press Enter. Then select the Processes tab. Figure 6.2 shows an example of the System Monitor window.
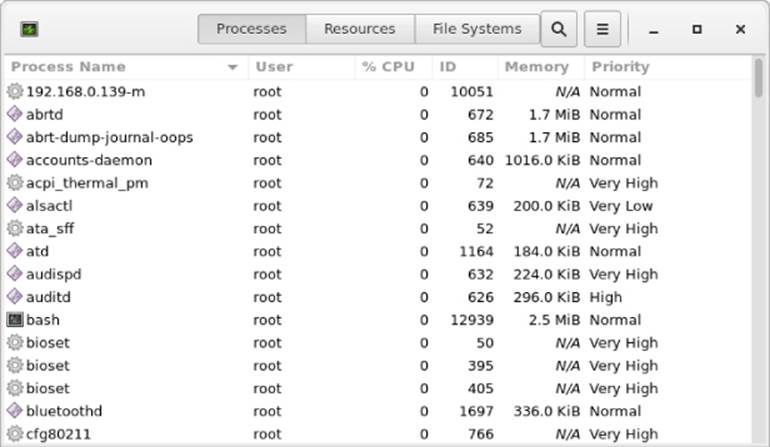
Figure 6.2 Use the System Monitor window to view and change running processes.
By default, only running processes associated with your user account are displayed. Those processes are listed alphabetically at first. You can re-sort the processes by clicking any of the field headings (forward and reverse). For example, click the %CPU heading to see which processes are consuming the most processing power. Click the Memory heading to see which processes consume the most memory.
You can change your processes in various ways by right-clicking a process name and selecting from the menu that appears (see Figure 6.3 for an example).
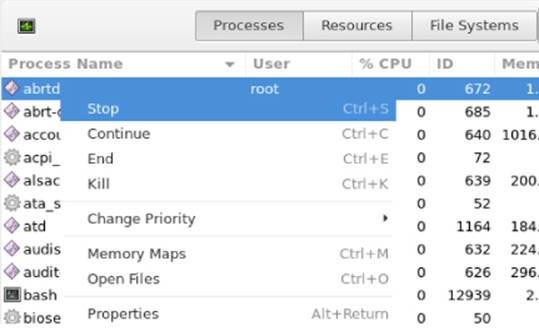
Figure 6.3 Renice, kill, or pause a process from the System Monitor window.
Here are some of the things you can do to a process from the menu you clicked:
· Stop—Pauses the process, so no processing occurs until you select Continue Process. (This is the same as pressing Ctrl+Z on a process from the shell.)
· Continue—Continues running a paused process.
· End—Sends a Terminate signal (15) to a process. In most cases, this terminates the process cleanly.
· Kill—Sends a Kill signal (9) to a process. This should kill a process immediately, regardless of whether it can be done cleanly.
· Change—Presents a slider bar from which you can renice a process. Normal priority is 0. To get better processor priority, use a negative number from –1 to –20. To have a lower processor priority, use a positive number (0 to 19). Only the root user can assign negative priorities, so you need to provide the root password, when prompted, to set a negative nice value.
· Memory Maps—Lets you view the system memory map to see which libraries and other components are being held in memory for the process.
· Open Files—Lets you view which files are currently being held open by the process.
· Properties—Lets you see other settings associated with the process (such as security context, memory usage, and CPU use percentages).
You can display running processes associated with users other than yourself. To do that, highlight any process in the display (just click it). Then, from the menu button (button with three bars on it), select All Processes. You can modify processes you don't own only if you are the root user or if you can provide the root password when prompted after you try to change a process.
Sometimes, you don't have the luxury of working with a graphical interface. To change processes without a graphical interface, you can use a set of commands and keystrokes to change, pause, or kill running processes. Some of those are described next.
Managing Background and Foreground Processes
If you are using Linux over a network or from a dumb terminal (a monitor that allows only text input with no GUI support), your shell may be all that you have. You may be used to a graphical environment in which you have lots of programs active at the same time so you can switch among them as needed. This shell thing can seem pretty limited.
Although the bash shell doesn't include a GUI for running many programs at once, it does let you move active programs between the background and foreground. In this way, you can have lots of stuff running and selectively choose the one you want to deal with at the moment.
You can place an active program in the background in several ways. One is to add an ampersand (&) to the end of a command line when you first run the command. You can also use the at command to run commands in such a way that they are not connected to the shell.
To stop a running command and put it in the background, press Ctrl+Z. After the command is stopped, you can either bring it back into the foreground to run (the fg command) or start it running in the background (the bg command). Keep in mind that any command running in the background might spew output during commands that you run subsequently from that shell. For example, if output appears from a command running in the background during a vi session, simply press Ctrl+L to redraw the screen to get rid of the output.
TIP
To avoid having the output appear, you should have any process running in the background send its output to a file or to null (add 2> /dev/null to the end of the command line).
Starting background processes
If you have programs that you want to run while you continue to work in the shell, you can place the programs in the background. To place a program in the background at the time you run the program, type an ampersand (&) at the end of the command line, like this:
$ find /usr > /tmp/allusrfiles &
[3] 15971
This example command finds all files on your Linux system (starting from /usr), prints those filenames, and puts those names in the file /tmp/allusrfiles. The ampersand (&) runs that command line in the background. Notice that the job number, [3], and process ID number, 15971, are displayed when the command is launched. To check which commands you have running in the background, use the jobs command, as follows:
$ jobs
[1] Stopped (tty output) vi /tmp/myfile
[2] Running find /usr -print > /tmp/allusrfiles &
[3] Running nroff -man /usr/man2/* >/tmp/man2 &
[4]- Running nroff -man /usr/man3/* >/tmp/man3 &
[5]+ Stopped nroff -man /usr/man4/* >/tmp/man4
The first job shows a text-editing command (vi) that I placed in the background and stopped by pressing Ctrl+Z while I was editing. Job 2 shows the find command I just ran. Jobs 3 and 4 show nroff commands currently running in the background. Job 5 had been running in the shell (foreground) until I decided too many processes were running and pressed Ctrl+Z to stop job 5 until a few processes had completed.
The plus sign (+) next to number 5 shows that it was most recently placed in the background. The minus sign (-) next to number 4 shows that it was placed in the background just before the most recent background job. Because job 1 requires terminal input, it cannot run in the background. As a result, it is Stopped until it is brought to the foreground again.
TIP
To see the process ID for the background job, add a -l (the lowercase letter L) option to the jobs command. If you type ps, you can use the process ID to figure out which command is for a particular background job.
Using foreground and background commands
Continuing with the example, you can bring any of the commands on the jobs list to the foreground. For example, to edit myfile again, type:
$ fg %1
As a result, the vi command opens again. All text is as it was when you stopped the vi job.
CAUTION
Before you put a text processor, word processor, or similar program in the background, make sure you save your file. It's easy to forget you have a program in the background, and you will lose your data if you log out or the computer reboots.
To refer to a background job (to cancel or bring it to the foreground), use a percent sign (%) followed by the job number. You can also use the following to refer to a background job:
· %—Refers to the most recent command put into the background (indicated by the plus sign when you type the jobs command). This action brings the command to the foreground.
· %string—Refers to a job where the command begins with a particular string of characters. The string must be unambiguous. (In other words, typing %vi when there are two vi commands in the background results in an error message.)
· %?string—Refers to a job where the command line contains a string at any point. The string must be unambiguous or the match fails.
· %--—Refers to the previous job stopped before the one most recently stopped.
If a command is stopped, you can start it running again in the background using the bg command. For example, take job 5 from the jobs list in the previous example:
[5]+ Stopped nroff -man man4/* >/tmp/man4
Type the following:
$ bg %5
After that, the job runs in the background. Its jobs entry appears as follows:
[5] Running nroff -man man4/* >/tmp/man4 &
Killing and Renicing Processes
Just as you can change the behavior of a process using graphical tools such as System Monitor (described earlier in this chapter), you can also use command-line tools to kill a process or change its CPU priority. The kill command can send a kill signal to any process to end it, assuming you have permission to do so. It can also send different signals to a process to otherwise change its behavior. The nice and renice commands can be used to set or change the processor priority of a process.
Killing processes with kill and killall
Although usually used for ending a running process, the kill and killall commands can actually be used to send any valid signal to a running process. Besides telling a process to end, a signal might tell a process to reread configuration files, pause (stop), or continue after being paused, to name a few possibilities.
Signals are represented by both numbers and names. Signals that you might send most commonly from a command include SIGKILL (9), SIGTERM (15), and SIGHUP (1). The default signal is SIGTERM, which tries to terminate a process cleanly. To kill a process immediately, you can use SIGKILL. The SIGHUP signal tells a process to reread its configuration files. SIGSTOP pauses a process, while SIGCONT continues a stopped process.
Different processes respond to different signals. Processes cannot block SIGKILL and SIGSTOP signals, however. Table 6.1 shows examples of some signals (type man 7 signal to read about other available signals):
Table 6.1 Signals Available in Linux
|
Signal |
Number |
Description |
|
SIGHUP |
1 |
Hang-up detected on controlling terminal or death of controlling process. |
|
SIGINT |
2 |
Interrupt from keyboard. |
|
SIGQUIT |
3 |
Quit from keyboard. |
|
SIGABRT |
6 |
Abort signal from abort(3). |
|
SIGKILL |
9 |
Kill signal. |
|
SIGTERM |
15 |
Termination signal. |
|
SIGCONT |
19,18,25 |
Continue if stopped. |
|
SIGSTOP |
17,19,23 |
Stop process. |
Notice that there are multiple possible signal numbers for SIGCONT and SIGSTOP because different numbers are used in different computer architectures. For most x86 and power PC architectures, use the middle value. The first value usually works for Alpha and Sparc, while the last one is for MIPS architecture.
Using kill to signal processes by PID
Using commands such as ps and top, you can find processes you want to send a signal to. Then you can use the process ID of that process as an option to the kill command, along with the signal you want to send.
For example, you run the top command and see that the bigcommand process is consuming most of your processing power:
PID USER PR NI VIRT RES SHR S %CPU %MEM TIME+ COMMAND
10432 chris 20 0 471m 121m 18m S 99.9 3.2 77:01.76 bigcommand
Here, the bigcommand process is consuming 99.9 percent of the CPU. You decide you want to kill it so that other processes have a shot at the CPU. If you use the process ID of the running bigcommand process, here are some examples of the kill command you can use to kill that process:
$ kill 10432
$ kill -15 10432
$ kill -SIGKILL 10432
The default signal sent by kill is 15 (SIGTERM), so the first two examples have exactly the same results. On occasion, a SIGTERM doesn't kill a process, so you may need a SIGKILL to kill it. Instead of SIGKILL, you can use –9.
Another useful signal is SIGHUP. Some server processes, such as the httpd process, which provides web services, respond to a SIGHUP (1) signal by rereading its configuration files. In fact, the command service httpd reload (in RHEL 6) or systemctl reload httpd (RHEL 7) actually sends SIGHUP to httpd processes running on your system to tell them that configuration files need to be read again. If the httpd process had a PID of 1833, you could use either of these commands to have it read configuration files again:
# kill -1 1833
# systemctl reload httpd
Using killall to signal processes by name
With the killall command, you can signal processes by name instead of by process ID. The advantage is that you don't have to look up the process ID of the process you want to kill. The potential downside is that you can kill more processes than you mean to if you are not careful. (For example, typing killall bash may kill a bunch of shells that you don't mean to kill.)
Like the kill command, killall uses SIGTERM (signal 15) if you don't explicitly enter a signal number. Also as with kill, you can send any signal you like to the process you name with killall. For example, if you see a process called testme running on your system and you want to kill it, you can simply type the following:
$ killall -9 testme
The killall command can be particularly useful if you want to kill a bunch of commands of the same name.
Setting processor priority with nice and renice
When the Linux kernel tries to decide which running processes get access to the CPUs on your system, one of the things it takes into account is the nice value set on the process. Every process running on your system has a nice value between –20 and 19. By default, the nice value is set to 0. Here are a few facts about nice values:
· The lower the nice value, the more access to the CPUs the process has. In other words, the nicer a process is, the less CPU attention it gets. So, a –20 nice value gets more attention than a process with a 19 nice value.
· A regular user can set nice values only from 0 to 19. No negative values are allowed. So a regular user can't ask for a value that gives a process more attention than most processes get by default.
· A regular user can set the nice value higher, not lower. So, for example, if a user sets the nice value on a process to 10, and then later wants to set it back to 5, that action will fail. Likewise, any attempt to set a negative value will fail.
· A regular user can set the nice value only on the user's own processes.
· The root user can set the nice value on any process to any valid value, up or down.
You can use the nice command to run a command with a particular nice value. When a process is running, you can change the nice value using the renice command, along with the process ID of the process, as in the example that follows:
# nice +5 updatedb &
The updatedb command is used to generate the locate database manually by gathering names of files throughout the file system. In this case, I just wanted updatedb to run in the background (&) and not interrupt work being done by other processes on the system. I ran the top command to make sure that the nice value was set properly:
PID USER PR NI VIRT RES SHR S %CPU %MEM TIME+ COMMAND
20284 root 25 5 98.7m 932 644 D 2.7 0.0 0:00.96 updatedb
Notice that under the NI column, the nice value is set to 5. Because the command was run as the root user, the root user can lower the nice value later by using the renice command. (Remember that a regular user can't reduce the nice value or ever set it to a negative number.) Here's how you would change the nice value for the updatedb command just run to –5:
# renice -n -5 20284
If you ran the top command again, you might notice that the updatedb command is now at or near the top of the list of processes consuming CPU time because you gave it priority to get more CPU attention.
Limiting Processes with cgroups
You can use a feature like “nice” to give a single process more or less access to CPU time. Setting the nice value for one process, however, doesn't apply to child processes that a process might start up or any other related processes that are part of a larger service. In other words, “nice” doesn't limit the total amount of resources a particular user or application can consume from a Linux system.
As cloud computing takes hold, many Linux systems will be used more as hypervisors than as general-purpose computers. Their memory, processing power, and access to storage will become commodities to be shared by many users. In that model, more needs to be done to control the amount of system resources to which a particular user, application, container, or virtual machine running on a Linux system has access.
That's where cgroups come in.
Cgroups can be used to identify a process as a task, belonging to a particular control group. Tasks can be set up in a hierarchy where, for example, there may be a task called daemons that sets default limitations for all daemon server processes, then subtasks that may set specific limits on a web server daemon (httpd) or FTP service daemon (vsftpd).
As a task launches a process, other processes the initial process launches (called child processes) inherit the limitations set for the parent process. Those limitations might say that all the processes in a control group have access only to particular processors and certain sets of RAM. Or they may allow access only to up to 30 percent of the total processing power of a machine.
The types of resources that can be limited by cgroups include the following:
· Storage (blkio)—Limits total input and output access to storage devices (such as hard disks, USB drives, and so on).
· Processor scheduling (cpu)—Assigns the amount of access a cgroup has to be scheduled for processing power.
· Process accounting (cpuacct)—Reports on CPU usage. This information can be leveraged to charge clients for the amount of processing power they use.
· CPU assignment (cpuset)—On systems with multiple CPU cores, assigns a task to a particular set of processors and associated memory.
· Device access (devices)—Allows tasks in a cgroup to open or create (mknod) selected device types.
· Suspend/resume (freezer)—Suspends and resumes cgroup tasks.
· Memory usage (memory)—Limits memory usage by task. It also creates reports on memory resources used.
· Network bandwidth (net_cls)—Limits network access to selected cgroup tasks. This is done by tagging network packets to identify the cgroup task that originated the packet and having the Linux traffic controller monitor and restrict packets coming from each cgroup.
· Network traffic (net_prio)—Sets priorities of network traffic coming from selected cgroups and lets administrators change these priorities on the fly.
· Name spaces (ns)—Separates cgroups into namespaces, so processes in one cgroup can only see the namespaces associated with the cgroup. Namespaces can include separate process tables, mount tables, and network interfaces.
Creating and managing cgroups, at its most basic level, is generally not a job for new Linux system administrators. It can involve editing configuration files to create your own cgroups (/etc/cgconfig.conf) or limit particular users or groups (/etc/cgrules.conf). Or you can use the cgreate command to create cgroups, which results in those groups being added to the /sys/fs/cgroup hierarchy. Setting up cgroups can be tricky and, if done improperly, can make your system unbootable.
The reason I introduce cgroups here is to help you understand some of the underlying features in Linux that you can use to limit and monitor resource usage. In the future, you will probably run into these features from controllers that manage your cloud infrastructure. You will be able to set rules like: “Allow the marketing department's virtual machines to consume up to 40 percent of the available memory” or “Pin the database application to a particular CPU and memory set.”
Knowing how Linux can limit and contain the resource usage by the set of processes assigned to a task will ultimately help you manage your computing resources better. If you are interested in learning more about cgroups, you can refer to the following:
· Red Hat Enterprise Linux Resource Management and Linux Containers Guide—https://access.redhat.com/documentation/en-US/Red_Hat_Enterprise_Linux/7/html-single/Resource_Management_and_Linux_Containers_Guide/index.html
· Kernel documentation on cgroups—Refer to files in the /usr/share/doc/kernel-doc-*/Documentation/cgroups directory after installing the kernel-doc package.
Summary
Even on a Linux system where there isn't much activity, typically dozens or even hundreds of processes are running in the background. Using the tools described in this chapter, you can view and manage the processes running on your system.
Managing processes includes viewing processes in different ways, running them in the foreground or background, and killing or renicing them. More advanced features for limiting resource usage by selected processes are available using the cgroups feature.
In the next chapter, you learn how to combine commands and programming functions into files that can be run as shell scripts.
Exercises
Use these exercises to test your knowledge of viewing running processes and then changing them later by killing them or changing processor priority (nice value). These tasks assume you are running a Fedora or Red Hat Enterprise Linux system (although some tasks work on other Linux systems as well). If you are stuck, solutions to the tasks are shown in Appendix B (although in Linux, you can often use multiple ways to complete a task).
1. List all processes running on your system, showing a full set of columns. Pipe that output to the less command so you can page through the list of processes.
2. List all processes running on the system, and sort those processes by the name of the user running each process.
3. List all processes running on the system, and display the following columns of information: process ID, user name, group name, virtual memory size, resident memory size, and the command.
4. Run the top command to view processes running on your system. Go back and forth between sorting by CPU usage and memory consumption.
5. Start the gedit process from your desktop. Make sure you run it as the user you are logged in as. Use the System Monitor window to kill that process.
6. Run the gedit process again. This time, using the kill command, send a signal to the gedit process that causes it to pause (stop). Try typing some text into the gedit window and make sure that no text appears yet.
7. Use the killall command to tell the gedit command you paused in the previous exercise to continue working. Make sure the text you type in after gedit was paused now appears on the window.
8. Install the xeyes command (in Red Hat Enterprise Linux, it is in the xorg-x11-apps package). Run the xeyes command about 20 times in the background so that 20 xeyes windows appear on the screen. Move the mouse around and watch the eyes watch your mouse pointer. When you have had enough fun, kill all xeyes processes in one command using killall.
9. As a regular user, run the gedit command so it starts with a nice value of 5.
10.Using the renice command, change the nice value of the gedit command you just started to 7. Use any command you like to verify that the current nice value for the gedit command is now set to 7.
All materials on the site are licensed Creative Commons Attribution-Sharealike 3.0 Unported CC BY-SA 3.0 & GNU Free Documentation License (GFDL)
If you are the copyright holder of any material contained on our site and intend to remove it, please contact our site administrator for approval.
© 2016-2025 All site design rights belong to S.Y.A.