CompTIA Linux+ / LPIC-1 Cert Guide (Exams LX0-103 & LX0-104/101-400 & 102-400) (2016)
Chapter 18. Logging and Time Services
This chapter covers the following topics:
![]() Maintain System Time
Maintain System Time
![]() System Logging
System Logging
![]() Rotating Logs
Rotating Logs
This chapter covers the following exam topics:
![]() Maintain system time: 108.1
Maintain system time: 108.1
![]() System logging: 108.2
System logging: 108.2
When confronted with a problem you will usually want to look at the system logs to try and piece together what happened so that you can work on a solution. Linux has a built-in logging facility that provides a way for each application to write a log message that will live on disk or on another system. By piecing together your logs you can start to understand your problems and find problems that have yet to become user complaints.
Your Linux machine also has a clock that should be correct. Just like a watch that has the wrong time, a server with a bad clock is annoying and can lead to incorrect information. It is difficult to understand logs because the log entries won’t line up with reality. Some protocols rely on strict clock synchronization such that a clock that is wrong by more than a few minutes might not allow people to log in.
“Do I Know This Already?” Quiz
The “Do I Know This Already?” quiz enables you to assess whether you should read this entire chapter or simply jump to the “Exam Preparation Tasks” section for review. If you are in doubt, read the entire chapter. Table 18-1 outlines the major headings in this chapter and the corresponding “Do I Know This Already?” quiz questions. You can find the answers in Appendix A, “Answers to the ‘Do I Know This Already?’ Quizzes and Review Questions.”
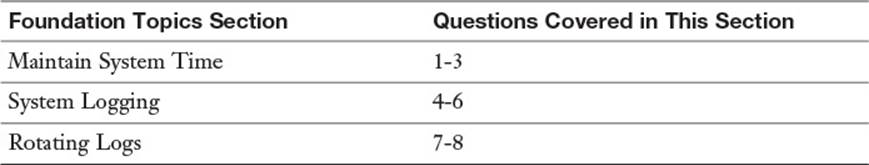
Table 18-1 “Do I Know This Already?” Foundation Topics Section-to-Question Mapping
1. The source of the Linux system clock is
a. The motherboard’s real-time clock
b. The Network Time Protocol daemon
c. The Linux kernel
d. A GPS clock
2. If you ran date “+%Y %m %d %H %M” on April 26, 2015 at 8:19 p.m., which of the following would you see?
a. 2015 04 26 20 19
b. 2015-04-26 8:19
c. 1430097577
d. Sun Apr 26 8:19:45pm CDT 2015
3. If you ran hwclock -w, what would happen?
a. The hardware clock’s time would be displayed in the local time zone.
b. The software clock time would be copied to the hardware clock.
c. The hardware clock time would be copied to the software clock.
d. The hardware clock’s time would be displayed in UTC.
4. If your syslog.conf file contained a line such as
*.notice;mail.none /var/log/foo
which of the following messages would make it into /var/log/foo? (Choose two.)
a. kernel.warning
b. cron.info
c. mail.err
d. cron.err
5. Which command will log a message to syslog from the command line?
a. logger This is a message
b. log This is a message
c. syslog “This is a message”
d. echo “This is a message” | syslogd
6. How do you watch the systemd journal logs in real time?
a. tail -f /var/log/journal/*
b. journalctl | tail -f
c. journalctl -f
d. journalctl --continuous
7. You have configured logrotate to rotate your custom application’s log file, but the logs do not seem to be written to the new file—they are still going to the timestamped file. What could be needed? (Choose two.)
a. The application is not a candidate for logrotate.
b. logrotate is not running.
c. You need the copytruncate option.
d. You need to restart your logrotate daemon.
8. Log rotation is triggered:
a. From the log rotation daemon
b. From cron or anacron
c. By the kernel
d. Manually
Foundation Topics
Maintain System Time
Your computer has a clock that is used for many reasons, including
![]() Setting timestamps on files
Setting timestamps on files
![]() Determining when scheduled jobs are to run
Determining when scheduled jobs are to run
![]() Annotating log entries with the time they were received
Annotating log entries with the time they were received
![]() Showing the current time to the user
Showing the current time to the user
![]() Cryptographic operations that rely on a timestamp to expire tokens
Cryptographic operations that rely on a timestamp to expire tokens
If the clock on one computer is different from another computer, problems can arise. It is difficult to correlate logs between systems. Jobs may run at the wrong time. Tokens may arrive already expired. You might miss lunch.
A time difference of even a few seconds can be troublesome. If you are looking at logs between two computers, you may misinterpret the order in which things happened, or miss matching up logs.
Not One, But Two Clocks

Your Linux machine actually has two clocks. The hardware clock is on the motherboard of your computer and is implemented as a separate chip. This chip is called the real-time clock because it is separate from other functions on the motherboard. It continues running even when your computer is off so that when you boot your computer you have a way of knowing the current date and time.
The other clock is the system clock and it is a part of the Linux kernel. When you are asking the kernel for the time, such as to write a timestamp to a log entry, you are getting the system clock time.
The hardware and system clocks do differ from each other and from the real time, in a process known as drift. A clock drifts because it runs slightly faster or slower, and therefore needs periodic synchronization.
Working with the System Clock
You can check the current time with the date command:
$ date
Wed Apr 15 14:36:05 CDT 2015
The default output shows the date and time, including the time zone, according to your current locale. For a discussion about locales and internationalization see Chapter 11, “Customizing Shell Environments.” You can quickly display the time in Universal Coordinated Time with the -u flag.
$ date -u
Wed Apr 15 19:36:05 UTC 2015
The system time is kept as the number of seconds since January 1, 1970, which is also known as the Unix epoch:
$ date +%s
1429126571
At the time of writing it has been some 1.4 billion seconds since the Unix epoch. There are roughly 31.5 million seconds in a year.
You can also change the date and time, if you are running as the root user, by passing the new time to the date command. The format of the setting is complicated, described by the man page as [MMDDhhmm[[CC]YY][.ss]].
Items in square brackets indicate optional arguments so you can pass nothing, which doesn’t set the clock at all. The minimum amount of information is the month, day, hour, and minute (MMDDhhmm); each is two digits. You can optionally specify the year by appending it to the minute. The year can either be two digits or four digits. The command returns the value, in words, that you set it to. Thus the samples in Example 18-1 are almost all identical.
Example 18-1 Setting the Time in Various Formats
# date 041514492015.35
Wed Apr 15 14:49:35 CDT 2015
# date 04151449
Wed Apr 15 14:49:00 CDT 2015
# date 0415144915
Wed Apr 15 14:49:00 CDT 2015
# date 041514492015
Wed Apr 15 14:49:00 CDT 2015
In Example 18-1 the commands all set the date to 2:49 in the afternoon of April 15, 2015. Where the year isn’t specified, such as the second example, date assumes the year hasn’t changed. If no seconds are given, that value is assumed to be 0, so the first example is the only one to set a seconds value.
The date command can display the time in a variety of formats, which lends itself well to using in shell scripts. Tell date to display the time in a different format with a plus sign (+) and then a format string. Common format strings are listed in Table 18-2.
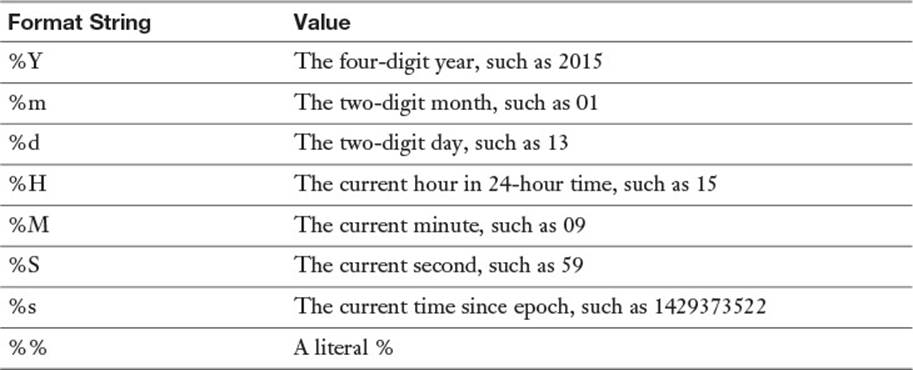
Table 18-2 Common Format Strings for the date Command
If you need a timestamp, the current time since epoch is an easy candidate:
$ date +%s
1429373851
Or perhaps you need something more user friendly, such as the date and time components concatenated:
$ date +%Y%m%d%H%M%S
20150418111854
In a shell script you might capture this in a temporary variable and use it for later, such as shown in Example 18-2.
Example 18-2 Using date in a Shell Script
#!/bin/bash
NOW=$(date +%Y%m%d%H%M%S)
cp -r /var/www/html/ /var/backup/website.$NOW
echo "Backed up site into /var/backup/website.$NOW" | mail root
Example 18-2 saves the current timestamp into a variable and then uses it in two places: First for the unique name of a directory containing backups, and then to tell the root user where the files were stored. If the script were to calculate the current timestamp each time it was needed, it would change as the script ran.
Another advantage of using a timestamp in a file is that it sorts nicely and is easy to pick out particular periods with grep.
You are not limited to just using the format strings shown previously; you can add arbitrary strings that will be echoed back to you. For example, the script in Example 18-2 could eliminate some duplication by having date calculate the whole file path:
$ date +/var/backup/website.%Y%m%d%H%M%S
/var/backup/website.20150418112516
You can also quote the whole format string to get more complicated output that includes spaces:
$ date +"Today is %A"
Today is Saturday
Working with the Hardware Clock
Your computer has a real-time clock (RTC) ticking away on the motherboard. It’s usually only used when the computer boots so that Linux has something from which to set the system clock. Keeping the hardware clock relatively accurate means that your boot logs will have the correct time.
Some computers don’t have a hardware clock. In particular, some virtualization technologies don’t expose the clock to the underlying virtual machine. Here, a larger server called a virtual machine host is emulating many smaller servers called virtual machine guests. The host controls the guest’s system clock so there is no need for an RTC in the guest. You’ll know you don’t have a hardware clock if the commands in this section give you an error.
The hwclock Command
The hwclock command manipulates the hardware clock by talking to the motherboard. You need to be root to run the command.
# hwclock
Sat 18 Apr 2015 12:12:11 PM CDT -0.189472 seconds
The output of hwclock is much like that of date. The difference is that there is an extra value at the end, expressed in seconds. This value calculates how long it was between the time the command was started and the clock was read, which is used inside the hwclock command to help correct for drift. When viewing the current hardware clock time this should be ignored.
The hardware clock is simple and has no notion of time zones. You are given the choice of running your hardware clock in UTC or local time when you install your system. You can see which mode you are in by looking at /etc/adjtime, shown in Example 18-3.
Example 18-3 /etc/adjtime
31.307682 1429376895 0.000000
429376895
LOCAL
The first two lines track any calibration that has been done on the hardware clock. The last line is either LOCAL or UTC to indicate the hardware clock is in UTC or local time.
Some systems don’t have the adjtime file, which means they’ve never had the clocks synchronized, and the time is in UTC.
If your hardware clock uses UTC, you should check the hardware clock using the -u flag.
# hwclock -u
Sat 18 Apr 2015 12:40:40 PM CDT -0.906883 seconds
Synchronizing Time Between Clocks
The two clocks should be synchronized; otherwise, drift between them will make troubleshooting difficult. The hwclock command has two functions to do this:
hwclock -w or hwclock --systohc writes the time in the system clock to
the hardware clock.
hwclock -s or hwclock --hctosys sets the system clock using the hard-
ware clock's time
Usually you will want to use your system clock as the canonical source of time; otherwise, the time on your system will seem to jump frequently as the time is reset.
If you are using something to keep the system clock in time with another time source, such as the Network Time Protocol described in the next section, it will likely set a kernel flag that automatically writes the system clock to the hardware clock every 11 minutes.
Network Time Protocol
Fortunately it is easy to keep your clock in sync without manually fiddling with the clock. The Network Time Protocol (NTP) is a protocol that enables a computer to get its time from a remote server and to be accurate within milliseconds even if the network is unreliable. Coupled with NTP is a globally distributed network of freely usable servers that participate in the protocol.
Throughout the world are various clock sources, such as government agencies broadcasting the time over radio, high-quality cesium clocks, or devices that read the current time from satellites. These clocks are called reference clocks in the NTP system.
NTP servers that get their time directly from a reference clock are called stratum 1 servers. These servers are considered to have the most accurate time in the NTP hierarchy. Even with this accuracy, there is no guarantee that all the servers have the same time!
An NTP server that gets its time from a stratum 1 server is called a stratum 2 server, and a server that gets its time from that is called a stratum 3 server, and so on.
Generally your server will be at stratum 3 or 4, which means it is getting its time from a stratum 2 or 3 server. If you have more than a dozen computers you probably want to have a small pool of servers at stratum 2 and have the other servers configured to point to that pool, making them stratum 3. This reduces load on your network and makes for more consistent time across your machines. Four time servers are enough for most environments, and they can run alongside existing applications.
Setting the Time from the Command Line
The simplest way to use NTP is to set the clock with the ntpdate command. You need to be root because you are setting the system clock. This asks the provided remote for the time and sets your local time to that value:
# ntpdate ntp1.torix.ca
18 Apr 15:19:54 ntpdate[11559]: adjust time server 206.108.0.131
offset 0.003552 sec
Here the name of the remote server is ntp1.torix.ca, and the local clock was only 3/1000 of a second out of sync with the remote server. If the local server was further out of sync, even if it was hours ahead or behind, the time would be abruptly changed to the new value.
The pool.ntp.org Servers
At one point you needed to know the names of a few publicly available NTP servers to use NTP, and you would get this from a web page that changed frequently. The pool.ntp.org project hides that complexity by pooling all the public servers behind a DNS alias. The servers themselves are run by individuals like you who have contributed their time servers to the greater good.
pool.ntp.org gives you access to the global list of NTP servers. You also have four aliases to use:
![]() 0.pool.ntp.org
0.pool.ntp.org
![]() 1.pool.ntp.org
1.pool.ntp.org
![]() 2.pool.ntp.org
2.pool.ntp.org
![]() 3.pool.ntp.org
3.pool.ntp.org
Each one of these resolves to a list of servers geographically close to your server. Depending on your distribution your aliases might be slightly different, such as X.debian.pool.ntp.org, but they are all the same set of servers.
There are four different names for the same set of servers because some systems expect to connect to multiple servers by different names, and the number in front of the name is an easy way to accomplish that.
Configuring ntpd
The ntpd daemon is a long-running daemon that continually adjusts the local clock, as opposed to ntpdate’s one-off behavior. ntpd runs in the background and continually queries remote servers for their time while learning about how network conditions are affecting the communications and compensating for local time drift. Thus, a server running ntpd always has the correct time with no need for a periodic job to reset the clock.
The configuration file for ntpd is /etc/ntp.conf. Your distribution should include a more complicated file that restricts queries and sets up cryptographic keys, but a simple file is shown in Example 18-4.
Example 18-4 An Example ntp.conf
driftfile /var/lib/ntp/drift
server 0.fedora.pool.ntp.org iburst
server 1.fedora.pool.ntp.org iburst
server 2.fedora.pool.ntp.org iburst
server 3.fedora.pool.ntp.org iburst
Example 18-4 shows two directives. The first is the driftfile that tracks local clock drift over time, and allows ntpd to compensate. The second directive is a set of one or more servers from which the local server attempts to synchronize. Having more than one server results in more accurate clock setting and redundancy should one server go out of service or become unreliable.
If the clock is out of sync, ntpd gradually brings it back into alignment by speeding up the local clock or slowing it down as necessary. If the time difference is too great, which is defined as 1,000 seconds by default, ntpd will exit and you will need to set the clock with ntpdate before continuing.
ntpd also enables a mode in the Linux kernel where the hardware clock is set every 11 minutes. Thus a system running ntpd has both clocks in sync.
Monitoring ntpd
The ntpq command is used to query an NTP server for its statistics and connects to the local host by default. The two commands that are most helpful are peers and associations, as shown in Example 18-5.
Example 18-5 Querying an NTP Server’s Peers
ntpq> peers
remote refid st t when poll reach delay offset jitter
========================================================================
+174.137.63.116 206.108.0.131 2 u 47 64 1 44.521 -3.491 0.485
-ntp3.tranzeo.co 206.108.0.132 2 u 46 64 1 49.107 -5.770 4.501
*ntp1.torix.ca .PPS. 1 u 45 64 1 83.315 0.505 0.634
+c1110364-13198. 132.163.4.103 2 u 44 64 1 49.312 1.754 4.643
ntpq> associations
ind assid status conf reach auth condition last_event cnt
===========================================================
1 10782 943a yes yes none candidate sys_peer 3
2 10783 9324 yes yes none outlyer reachable 2
3 10784 963a yes yes none sys.peer sys_peer 3
4 10785 9424 yes yes none candidate reachable 2
The peers command gives details about each of the servers defined with the server keyword in the configuration. The association command gives more details on each server, including how well the remote server is performing.
In Example 18-5 there are four servers. The first column shows the name of the remote server but is prefixed by a special character. If that character is a *, that server is the currently active peer. If the character is a +, the server is a good time source but not the main server. Anything else and the server is not considered to be good for time synchronization and will be monitored.
The second column shows the name of the remote server from where your machine is getting its time. The third column shows which stratum that server is, and the remaining columns are statistics used by ntpd.
The associations command gives even greater detail about each server in the same order that they appear in the peers command. The most interesting column is the condition column, which explains the state of the server. The peers command showed that the second server was not being used because the name of the server was prefixed with a minus sign (-), and the condition of that server is outlyer. This means that the time on that server was too different from the others to be trusted.
Other than the condition, you can see that the servers are all reachable.
System Logging
Logs tell you what was happening while you weren’t looking. The kernel and running applications emit logs when events happen. These logs might be informational, such as a web request, or they might be errors such as the ntpd daemon exiting because the time difference was too large.
Most applications in Linux log in some form or another. Linux provides a centralized logging facility that applications can use. This means that an application can use a standard interface to log and doesn’t have to worry about configuring file locations. This also means that the administrator can split up logs according to function, or to ignore unimportant logs and email errors directly to themselves.
Some applications, such as web servers, choose to do their own logging. Usually this is needed to get the performance or customization that the application needs, or sometimes it’s because the application was designed to work on many different systems, some that don’t have syslog. As a systems administrator you will have to deal with all kinds of logs.
systemd and syslog
Linux has two different logging systems: syslog and systemd’s journal. syslog is a standardized system that can receive messages from local applications or remote servers and write them to disk or send to another server. It is ubiquitous such that many network enabled appliances generate syslog messages. The systemd journal is a newer form of logging for distributions that have moved to systemd. Fortunately, it is backward compatible so that applications that can log to syslog can also log to systemd, and it can also forward messages to a syslog server for centralized logging.
Applications that use systemd’s version of logging can also log the additional metadata tracked by the journal. For example, the name of the method and the line number are logged alongside the message, which allows for additional statistics to be gathered.
syslog
syslog is a simple protocol, which has led to its adoption across many different systems and applications.
A message can be logged in several ways:
![]() From within an application using the syslog library call
From within an application using the syslog library call
![]() From the command line using the logger command
From the command line using the logger command
![]() Remotely by connecting to a syslog server over the network
Remotely by connecting to a syslog server over the network
A message is logged with a severity and a facility, and the syslog daemon takes care of processing the message. The severities are listed in Table 18-3.
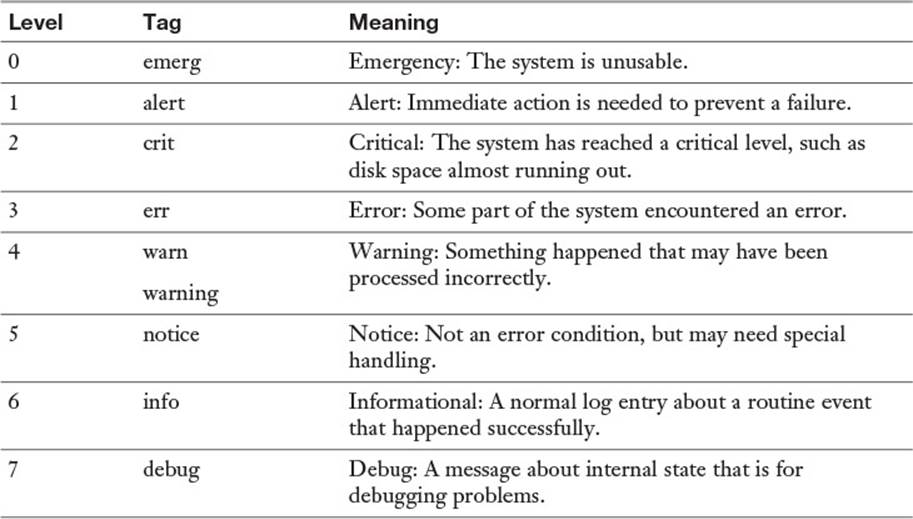
Table 18-3 Syslog Severities
When you log at a particular level, you’re saying that you’re only capturing logs at that level or with a lower priority level and throwing away anything else. For example, most systems log at the informational level (6). This would ignore debug logs (7) and capture anything else. You may decide to log at the warning level (4) to ignore reports of normal operation at levels 5, 6, and 7 and only concern yourself with level 4 warnings and more severe items at levels 1, 2, and 3.
For the exam, it is important to remember the seven log levels and their order.
Each log is also tied to a facility that describes what generated the log. The combination of facility and level gives you control over what is stored. You may choose to log the email system at the informational level, which gives you reports of each email that goes through the system, but logs cron at warning, so you only hear about things that go wrong.
Table 18-4 lists the available facilities.
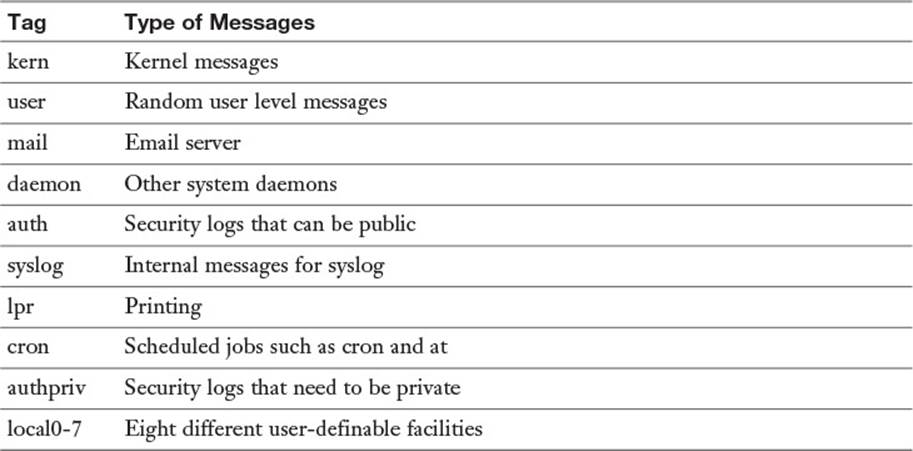
Table 18-4 Log Facilities
The syslog daemon is responsible for the collection and distribution of log messages. You can think of it as a pipeline that takes messages from various sources and directs them to the appropriate destination. Figure 18-1 shows a typical syslog configuration in graphical form.
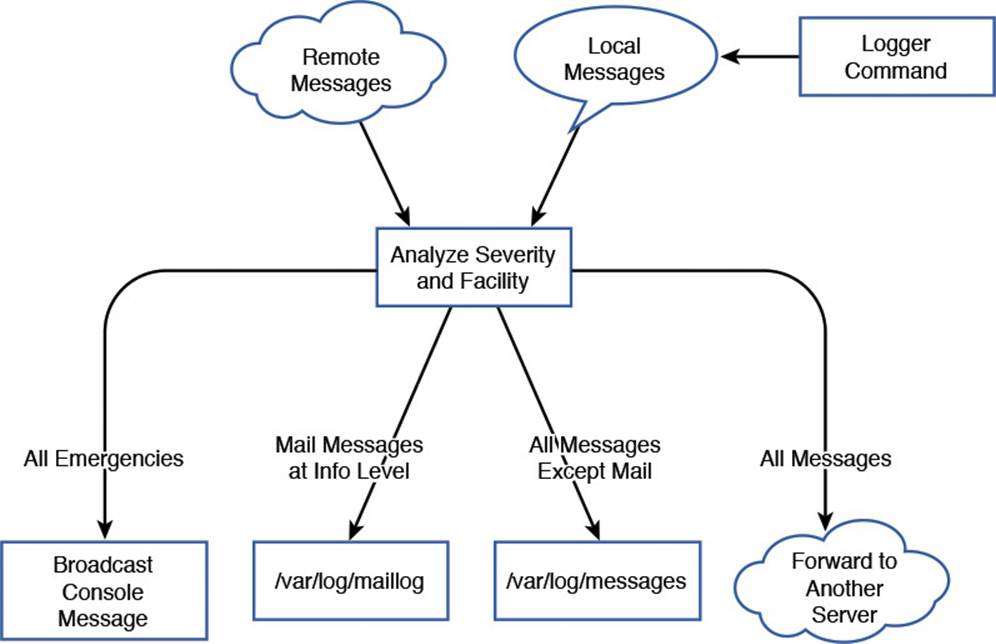
Figure 18-1 The flow of logging information
In Figure 18-1 the logs come in from one of two places: remotely, over the network, or from the local system. Locally, the logger command acts as an application and takes messages from the command and turns them into local syslog messages.
The middle box analyzes the messages and, based on the severity and facility, decides where to send them. Starting from the left, anything with an emergency severity is displayed to the system console. This is partially to capture the attention of anyone who happens to be watching the console, but also to ensure a trace is left. If the log is truly about an emergency, it’s possible that it’s related to the disks or the system is in the process of crashing. Next, all mail messages logged with a severity of at least info are stored in /var/log/maillog. All messages except for mail messages go to /var/log/messages. Finally, all messages are sent to a remote syslog server.
A single message may be sent to multiple outputs, or none. An emergency mail message would go to the console, /var/log/maillog, and the remote syslog server. A mail related debugging message would only go to the remote server.
Figure 18-1 only shows a sample. Your needs may be different and call for a different configuration.
The logger Command
The logger command is helpful for both testing your logging configuration and for logging within scripts. The easiest way to use it is just to pass the log message on the command line:
$ logger Starting script processing
Looking in the logs, such as /var/log/messages, you see something like
Apr 20 19:55:02 bob sean: Starting script processing
The log entry contains both the hostname (bob) and the user (sean).
For additional information you can pass the process ID with the -i flag.
$ logger -i Starting script processing
Apr 20 19:55:57 bob sean[8969]: Starting script processing
The default destination of the message is the user facility at the notice level, which can be overridden with the -p flag:
$ logger -i -p mail.info Checking user quotas
Apr 20 19:57:28 bob sean[9054]: Checking user quotas
Configuring syslogd
Linux has several syslog daemons that can be used, but the simplest is part of the sysklogd package. The name is an amalgamation of syslog and klogd. syslogd is the component that handles the logging of messages as described in Figure 18-1. klogd listens specifically for kernel logs and forwards them to syslogd. klogd can also do processing on the message before sending it along, such as to translate memory addresses into names that would be helpful to kernel developers.
klogd has very little to configure, so the interesting parts are found in syslogd.
syslogd’s configuration file is in /etc/syslog.conf. This file defines a set of rules, one per line. Each rule is evaluated, and if the log matches that rule, the log is sent to the destination specified in the rule.
Example 18-6 shows a simple syslog.conf.
Example 18-6 A Sample /etc/syslog.conf
# This is a comment
authpriv.* /var/log/secure
*.info;mail.none;authpriv.none;cron.none /var/log/messages
mail.* -/var/log/maillog
cron.* /var/log/cron
*.emerg *
local7.* /var/log/boot.log
local4.* /var/log/slapd.log
Comments start with a hash sign and are ignored by syslogd. The rules in Example 18-6 are split into a selector and a destination, separated by whitespace. Each selector is made up of one or more patterns, and each pattern is a facility and a severity separated by a period (.).
Most of the patterns in Example 18-6 have a single facility and a selector of *, which means any severity will match. This could also have been written with a severity of debug, as that is the lowest severity possible. Thus, authpriv.* matches all the private authentication messages. If the destination part of the rule is a filename, the logs go to that file.
The line associated with the mail facility has a dash (-) in front of the destination. This tells syslogd that it shouldn’t commit each log entry to disk as it’s logged but to let the kernel write to disk when it has time, as the mail facility can log heavily and this improves performance at a cost of potential lost data after a crash.
The second selector has more than one pattern; each is separated by a semicolon (;). The first pattern matches any facility at info level or greater, and the remaining three use the special none severity to ignore any log coming from mail, authpriv, or cron. This is because those logs have their own files and this eliminates duplication.
The *.emerg selector matches any log at the emergency level and sends it to a special destination of *, which means to send a message to the console of anyone logged in to the system.
While individuals are free to place logs wherever they want, several conventions have emerged to make logs easier to find as you move from system to system (see Table 18-5).
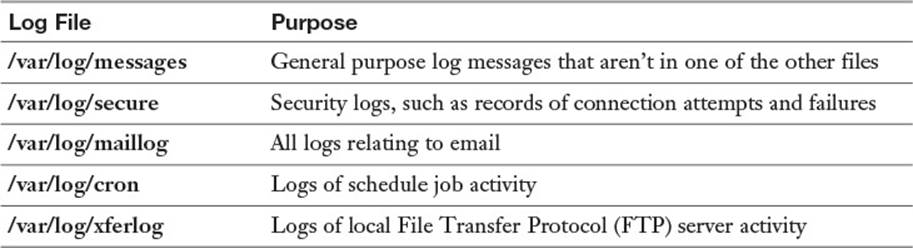
Table 18-5 Common Logs and Their Location
Splitting each major application into its own log files makes it easier to find what you want and doesn’t mingle logs between two applications when you are reviewing them. A common pattern is to watch a log in real time, also called “following a log.” To follow a log, run tail -f logfile, such as tail -f /var/log/secure to watch for people logging in.
Once you have more than a few servers, especially if more than one do the same role, you’ll get tired of accessing different servers to read logs. One solution is to have the various syslogds on your servers to forward all their messages to a single server. With that in place you can read all your logs on a single server.
Centralizing your syslogging requires two things. First, the centralized syslog server must be started with the -r flag, which tells it that it can receive remote messages.
Next you need a rule that forwards the desirable messages to the remote server by supplying a destination hostname prefixed with an @. For example,
*.info @logserver.example.com
sends all info messages and above to logserver.example.com for central analysis.
Other syslog Implementations
The ksyslogd package isn’t the only syslog implementation available for Linux systems. There are two prominent alternatives: rsyslogd and syslog-ng.
rsyslogd is meant to be a “rocket-fast” implementation of a syslog daemon with support for plugins, alternate storage mechanisms, and more flexible rules processing. With rsyslogd you can store your logs in a database, filter the logs based on keywords, and keep statistics. One advantage of rsyslogd is that the basic ksyslogd configuration is also a valid rsyslogd configuration, which gives you an easy transition mechanism.
syslog-ng is a next generation syslog server that offers both open source and commercial versions. It has many of the same features as rsyslogd, but the configuration syntax has been reworked. This means that complicated filters are easier to write than with rsyslogd.
systemd Logging
The systemd set of tools is being rapidly adopted by major Linux distributions. For better or worse, systemd has its own logging system called the systemd journal or journald.
The journal’s main difference from syslogd is that it logs to a binary file and annotates each log entry with metadata rather than using a text format. This gives you several advantages over syslogd:
![]() Looking at the logs is the same no matter which distribution you are using.
Looking at the logs is the same no matter which distribution you are using.
![]() You can query on metadata such as the level, facility, or message, and by date and time.
You can query on metadata such as the level, facility, or message, and by date and time.
![]() You have access to more metadata than possible in a text file, such as the full command line, process id, binary, and security privileges of the process.
You have access to more metadata than possible in a text file, such as the full command line, process id, binary, and security privileges of the process.
![]() You can annotate the logs with your own metadata, such as source file, line number, or customer id.
You can annotate the logs with your own metadata, such as source file, line number, or customer id.
Additionally, systemd integrates the journal with the rest of systemd such that anything a daemon writes to the console is saved as a proper log entry. In the current init system, each daemon is responsible for its own logging. The daemon’s startup script is supposed to capture any logs that the daemon prints to the console. In the system model, this is all logged into the journal without any extra work needed by the startup script.
Querying the Log
The journal’s log is stored in a binary format under /var/log/journal, so you need special tools to read the log.
You access the journal using the journalctl command. By default you see the entire contents of the journal file on your screen. Depending on your configuration, such as the contents of the PAGER environment variable, the output might be paginated. Example 18-7 shows a typical, unfiltered, log.
Example 18-7 Viewing the Unfiltered Log with journalctl
# journalctl
-- Logs begin at Mon 2014-12-15 22:40:24 CST, end at Sun 2015-04-26
12:56:07 CDT. --
Dec 15 22:40:24 localhost.localdomain systemd-journal[439]: Runtime
journal is using 8.0M (max allowed 100.0M, trying to leave 150.1M free
of 992.8M available → current limit 100.0M).
Dec 15 22:40:24 localhost.localdomain systemd-journal[439]: Runtime
journal is using 8.0M (max allowed 100.0M, trying to leave 150.1M free
of 992.8M available → current limit 100.0M).
Dec 15 22:40:24 localhost.localdomain systemd-journald[86]: Received
SIGTERM from PID 1 (systemd).
Dec 15 22:40:24 localhost.localdomain kernel: audit: type=1404
audit(1418704824.175:2): enforcing=1 old_enforcing=0 auid=4294967295
ses=4294967295
Dec 15 22:40:24 localhost.localdomain kernel: SELinux: 2048 avtab hash
slots, 111331 rules.
Dec 15 22:40:24 localhost.localdomain kernel: SELinux: 2048 avtab hash
slots, 111331 rules.
Dec 15 22:40:24 localhost.localdomain kernel: SELinux: 8 users, 103
roles, 4980 types, 295 bools, 1 sens, 1024 cats
Dec 15 22:40:24 localhost.localdomain kernel: SELinux: 83 classes,
111331 rules
Output truncated...
Example 18-7 shows all the logs held within systemd’s journal. Rather than unbounded text files like syslog, the journal keeps a rolling log that expires old entries as the log file hits its size limit. By default the journal uses up to 10% of the file system for logs.
The system that Example 18-7 was run on did not have many logs, so the first log shown is of the first boot. You can see that the journal is documenting its size usage, followed by the system booting up.
As a systems administrator you’re often interested in keeping a watch on the logs, so you would want to see the last logs to come in. For that you can either use the -e flag to view the end of the log, or the -r flag to view the logs in reverse order.
A common pattern with syslog is to monitor a log with the tail command in follow mode, such as tail -f /var/log/messages, so that new log entries are shown as they are written. With journalctl you can follow the new logs being added to the journal with journalctl -f.
syslog had an advantage in that logs were separated into appropriate topic files. Your mail logs went into one file, general system logs into another, and cron logs into yet another. systemd does not do this. Instead, you create ad-hoc filters that match log entries according to their metadata.
You can still run commands like journalctl | grep sshd to look for log entries containing the phrase sshd. The new, preferred way is to use a filter. Example 18-8 shows a query for sshd related logs.
Example 18-8 Querying the Journal for sshd Logs
# journalctl SYSLOG_IDENTIFIER=sshd | tail -5
-- Reboot --
Apr 18 17:01:14 localhost.localdomain sshd[790]: Server listening on
0.0.0.0 port 22.
Apr 18 17:01:14 localhost.localdomain sshd[790]: Server listening on ::
port 22.
Apr 26 12:56:07 localhost.localdomain sshd[6986]: Accepted password for
root from 192.168.1.171 port 51888 ssh2
Apr 26 12:56:07 localhost.localdomain sshd[6986]: pam_
unix(sshd:session): session opened for user root by (uid=0)
Example 18-8 shows the journal entries where the SYSLOG_IDENTIFIER field is sshd and only shows the last five of those. This shows sshd’s last four log entries.
systemd tracks logs according to the service that started it, so you can just as easily ask for any logs originating from the sshd.service service, as in Example 18-9.
Example 18-9 Querying All the Service’s Logs
# journalctl -u sshd.service | tail -5
Apr 12 16:15:03 localhost.localdomain sshd[5328]: Server listening on
:: port 22.
-- Reboot --
Apr 18 17:01:14 localhost.localdomain sshd[790]: Server listening on
0.0.0.0 port 22.
Apr 18 17:01:14 localhost.localdomain sshd[790]: Server listening on ::
port 22.
Apr 26 12:56:07 localhost.localdomain sshd[6986]: Accepted password for
root from 192.168.1.171 port 51888 ssh2
The -u option, used in Example 18-9, restricts the display to only those generated by the given systemd unit. It is interesting to note that the “session opened” log from Example 18-8 does not show up in Example 18-9! To find out why, more details about the logs are needed.
View the output in verbose mode with -o verbose so that you see all the log fields, as shown in Example 18-10.
Example 18-10 Looking at the Logs Verbosely
# journalctl SYSLOG_IDENTIFIER=sshd -o verbose
... Output omitted ...
Sun 2015-04-26 12:56:07.623479 CDT [s=d2a5e6cac56c4ed6a50d8eaa85db3e76;
i=270c;b=464f14b29d3c4fdea5b70fd65b150323;m=73242431c;t=514a4580761a8;x
=a69a5419382c0e40]
PRIORITY=6
_UID=0
_GID=0
_SYSTEMD_SLICE=system.slice
_MACHINE_ID=bc31f38de2ee4e2cab0ad674986cee12
_HOSTNAME=localhost.localdomain
_CAP_EFFECTIVE=3fffffffff
_TRANSPORT=syslog
SYSLOG_FACILITY=10
SYSLOG_IDENTIFIER=sshd
_COMM=sshd
_EXE=/usr/sbin/sshd
_SYSTEMD_CGROUP=/system.slice/sshd.service
_SYSTEMD_UNIT=sshd.service
_SELINUX_CONTEXT=system_u:system_r:sshd_t:s0-s0:c0.c1023
_BOOT_ID=464f14b29d3c4fdea5b70fd65b150323
SYSLOG_PID=6986
MESSAGE=Accepted password for root from 192.168.1.171 port 51888
ssh2
_PID=6986
_CMDLINE=sshd: root [priv]
_SOURCE_REALTIME_TIMESTAMP=1430070967623479
Sun 2015-04-26 12:56:07.788532 CDT [s=d2a5e6cac56c4ed6a50d8eaa85db3e76;
i=271b;b=464f14b29d3c4fdea5b70fd65b150323;m=73244c83b;t=514a45809e6c7;x
=bd3026565414c9e5]
PRIORITY=6
_UID=0
_GID=0
_MACHINE_ID=bc31f38de2ee4e2cab0ad674986cee12
_HOSTNAME=localhost.localdomain
_CAP_EFFECTIVE=3fffffffff
_TRANSPORT=syslog
SYSLOG_FACILITY=10
SYSLOG_IDENTIFIER=sshd
_COMM=sshd
_EXE=/usr/sbin/sshd
_SELINUX_CONTEXT=system_u:system_r:sshd_t:s0-s0:c0.c1023
_SYSTEMD_OWNER_UID=0
_SYSTEMD_SLICE=user-0.slice
_AUDIT_LOGINUID=0
_AUDIT_SESSION=9
_SYSTEMD_CGROUP=/user.slice/user-0.slice/session-9.scope
_SYSTEMD_SESSION=9
_SYSTEMD_UNIT=session-9.scope
_BOOT_ID=464f14b29d3c4fdea5b70fd65b150323
SYSLOG_PID=6986
_PID=6986
_CMDLINE=sshd: root [priv]
MESSAGE=pam_unix(sshd:session): session opened for user root by
(uid=0)
_SOURCE_REALTIME_TIMESTAMP=1430070967788532
This verbose listing in Example 18-10 shows all the metadata fields in the log entries. Both logs come from the same SYSLOG_IDENTIFIER, but the _SYSTEMD_UNIT is different. As the -u option queries on _SYSTEMD_UNIT, the session open notification is not shown in Example 18-9. The difference in units, even though it is the same process, is because sshd undergoes a change as the user logs in. The process first starts out as a system daemon and then changes context to that of the user. The _SYSTEMD_CGROUP has also changed to reflect this change in context.
You can filter your journal on any of the fields listed in Example 18-10.
An alternative search filter is to ask for any logs generated from a certain binary, such as journalctl /usr/sbin/sshd. This would give output identical to Example 18-8.
Configuring journald
The systemd journal’s configuration file is /etc/systemd/journald.conf. It is a series of key-value assignments with a header. Example 18-11 shows a simple journald.conf.
Example 18-11 An Example journald.conf
[Journal]
ForwardToSyslog=yes
SystemMaxFileSize=200M
Example 18-11 starts with the header indicating that the configuration is for the journal. Next are two directives. The first enables forwarding of messages to syslog, which means that any message received by systemd will also be sent to syslog. By default messages aren’t sent to syslog because that will duplicate all the messages. However, the feature is there for people who are transitioning off syslog or who use syslog for centralized log collection.
The second directive sets the maximum log file size as 200 Megabytes instead of the default of 10% of disk size.
The entire list of options is in the man page for journald.conf, which you can see by typing man journald.conf. Restart journald with systemctl restart systemd-journald after making any changes.
Rotating Logs
Your systems will generate log files. Even if you use systemd’s journal, there will still be daemons such as web servers that have their own logging frameworks built in.
Log files that grow without any limits have some problems:
![]() They can fill the disk.
They can fill the disk.
![]() It is difficult to find what you want in a large log file.
It is difficult to find what you want in a large log file.
![]() Large files are unwieldy to copy.
Large files are unwieldy to copy.
![]() You can’t compress an active log file.
You can’t compress an active log file.
Log rotation is a process that solves these problems by periodically archiving the current log file and starting a new one. With log rotation, you can
![]() Start a new log file on a schedule, such as daily, weekly, or monthly.
Start a new log file on a schedule, such as daily, weekly, or monthly.
![]() Compress old log files to save disk space.
Compress old log files to save disk space.
![]() Prune old archives so that you only keep a certain number of old logs.
Prune old archives so that you only keep a certain number of old logs.
![]() Rename old log files with a date stamp so you know where to look for older logs.
Rename old log files with a date stamp so you know where to look for older logs.
![]() Run commands before or after a set of logs is rotated.
Run commands before or after a set of logs is rotated.
Configuring Log Rotation
Linux distributions use the logrotate package to do all of this. logrotate’s configuration files are /etc/logrotate.conf, along with any files in /etc/logrotate.d. The main logrotate.conf file specifies any default settings and system files to be rotated, and each file in logrotate.d is used to add additional settings or override the default settings for specific files. A package manager usually manages the configuration files in logrotate.d, thus a package can also include its own log rotation strategy by including the configuration file. You can also add your own configurations to this directory or to the main configuration file.
Example 18-12 shows an example of a set of log files to be rotated:
Example 18-12 A logrotate Configuration
/var/log/httpd/*log {
weekly
rotate 4
missingok
notifempty
sharedscripts
delaycompress
postrotate
/bin/systemctl reload httpd.service > /dev/null 2>/dev/null || true
endscript
}
A logrotate configuration is defined by a file glob that matches the log files, followed by a series of instructions enclosed inside curly braces. In the case of Example 18-12 the logs that are rotated are the Apache web server logs, which is anything in /var/log/httpd with a name ending in log.
The configuration for the Apache logs are
![]() weekly—Rotates the log files once a week.
weekly—Rotates the log files once a week.
![]() rotate 4—Rotates a given log four times before deleting it, so this keeps four weeks of logs online.
rotate 4—Rotates a given log four times before deleting it, so this keeps four weeks of logs online.
![]() missingok—Don’t raise an error if the log is missing.
missingok—Don’t raise an error if the log is missing.
![]() notifempty—Don’t rotate the log if it has nothing in it.
notifempty—Don’t rotate the log if it has nothing in it.
![]() sharedscripts—If the wildcard matches several files, run any scripts once for all files.
sharedscripts—If the wildcard matches several files, run any scripts once for all files.
![]() delaycompress—Don’t compress the file until it has already been rotated. This is to prevent corruption if the daemon doesn’t close the log file immediately.
delaycompress—Don’t compress the file until it has already been rotated. This is to prevent corruption if the daemon doesn’t close the log file immediately.
![]() postrotate—Run the commands that follow, up until the endscript keyword, after the logs were rotated. In this example the script tells Apache to restart itself.
postrotate—Run the commands that follow, up until the endscript keyword, after the logs were rotated. In this example the script tells Apache to restart itself.
If an option isn’t specified in the stanza attached to the name of the log file, the top level option from /etc/logrotate.conf takes priority. If logrotate.conf is contained the line rotate 5, any individual configuration that didn’t specify a rotate value would default to 5.
logrotate is run from cron or anacron as a daily job. Each time it is run it looks to see whether any logs need to be rotated, which is calculated from the presence of the daily, weekly, monthly, or yearly keywords. If logrotate sees that the current log is due to be rotated, it rotates the log. Thus running logrotate from the command line may result in no logs being modified.
Dealing with Open Files
The most troublesome part of log rotation involves handling an application that keeps a log file open while it runs. If logrotate is told to rotate /tmp/log, it moves /tmp/log to /tmp/log-XXXX where XXXX is the current timestamp. However, if an application still has the file open it continues writing to the timestamped file.
There are three common solutions, in order of decreasing desirability:
![]() Move the log files and then send the application a signal to close its logs and reopen them. This is ideal, but the application must support doing this.
Move the log files and then send the application a signal to close its logs and reopen them. This is ideal, but the application must support doing this.
![]() Restart the application after moving the files over and it should start logging in a new file. The create keyword can also be used to create the new file after rotation if special permissions are needed or the application doesn’t do it itself. This is good as long as restarting the application doesn’t impact service.
Restart the application after moving the files over and it should start logging in a new file. The create keyword can also be used to create the new file after rotation if special permissions are needed or the application doesn’t do it itself. This is good as long as restarting the application doesn’t impact service.
![]() Copy the logs instead of moving them and then truncate the old file in place, using the copytruncate keyword. This involves a lot more disk operations than the other two options and may lose log entries written after the copy operation started.
Copy the logs instead of moving them and then truncate the old file in place, using the copytruncate keyword. This involves a lot more disk operations than the other two options and may lose log entries written after the copy operation started.
Summary
Your Linux machine has two clocks: a hardware clock on the motherboard and a software clock that Linux maintains. You can set and view the software clock with the date command, and the hardware clock with the hwclock command. The use of the Network Time Protocol means that your clock is always synchronized.
Linux systems produce a number of logs that help in troubleshooting problems, both during the problem and after the fact. The syslog daemon is responsible for receiving the logs and sending them to the appropriate destination, such as a local file or remote machine. Most modern distributions have moved to systemd, which has its own syslog replacement called the journal.
Logs stored on disk should be rotated so they don’t fill up the disk and become too unwieldy to read. The logrotate system reads a set of instructions pertaining to sets of log files and renames them on a schedule, including deleting old logs.
Exam Preparation Tasks
As mentioned in the section “How to Use This Book” in the Introduction, you have a few choices for exam preparation: the exercises here, Chapter 21, “Final Preparation,” and the practice exams on the DVD.
Review All Key Topics
Review the most important topics in this chapter, noted with the Key Topics icon in the outer margin of the page. Table 18-6 lists a reference of these key topics and the page numbers on which each is found.
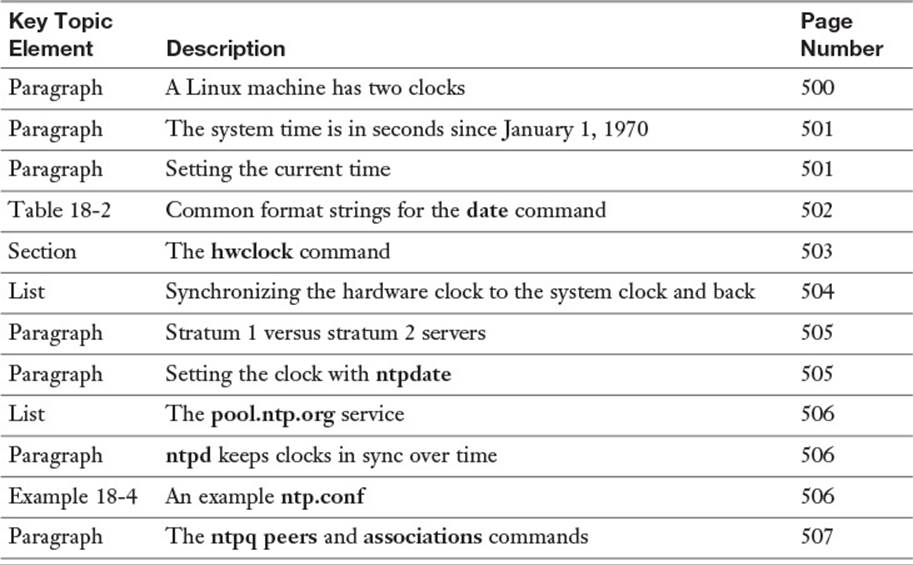
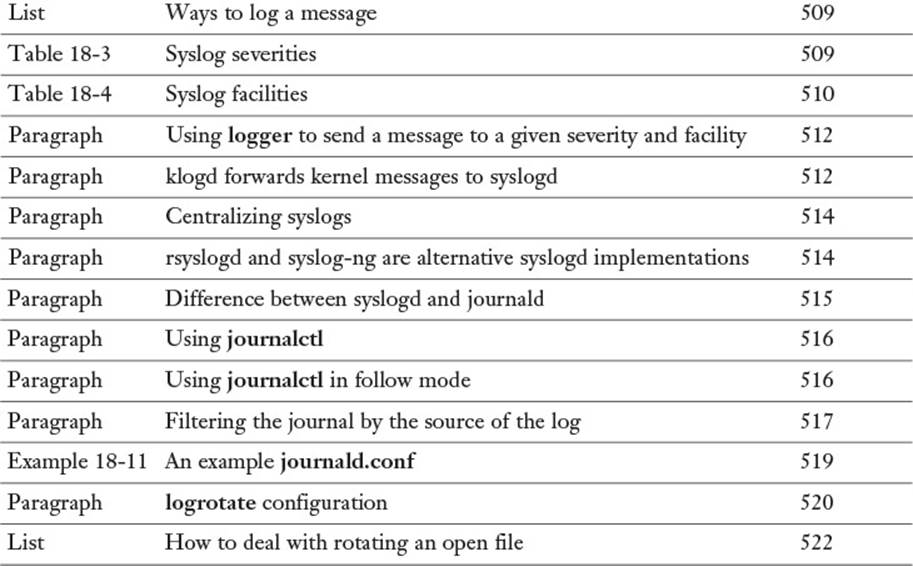
Table 18-6 Key Topics for Chapter 18
Define Key Terms
Define the following key terms from this chapter and check your answers in the glossary:
hardware clock
real-time clock
system clock
drift
virtual machine host
virtual machine guest
Network Time Protocol
reference clock
stratum 1 server
log rotation
Review Questions
The answers to these review questions are in Appendix A.
1. A Linux computer typically maintains two clocks. What are they? (Choose two.)
a. Hardware clock
b. System clock
c. NTP clock
d. cron clock
2. Which of the following sets the clock to 6:30 p.m. on January 21, 2016, if the current year is 2015?
a. date 012120161830
b. date 201601211830
c. date +201601211830
d. date 012118302016
3. You are about to reboot your computer but want to make sure that the computer boots with the correct time. How do you set the hardware clock using the value of the system clock? (Choose two.)
a. hwclock --hctosys
b. hwclock --systohc
c. hwclock -w
d. hwclock -r
4. Which command is most helpful in troubleshooting NTP problems?
a. ntp --debug
b. date
c. ntptool
d. ntpq
5. Your server’s clock is badly out of sync. How could you set the clock from a remote time source?
a. ntpdate pool.ntpd.com
b. ntpdate pool.ntp.com
c. ntpdate 0.pool.ntpd.org
d. ntpdate pool.ntp.org
6. Type the full path to the directory where systemd stores its log files:
_____________________________
7. Which of the following is an alternative syslog implementation?
a. syslog-ng
b. rsyslog-ng
c. syslog++
d. journald
8. Which of the following syslog severities are more severe than notice? (Choose two.)
a. debug
b. warning
c. info
d. alert
9. Which of the following syslog configuration rules ignores anything from the mail facility but captures info messages from other places?
a. *.debug;mail.none
b. *.alert;mail.*
c. *.notice;mail.none
d. *.info;-mail.*
10. You find out that your server is a stratum 2 NTP server. What does this mean?
a. There are two levels of servers getting time from your server.
b. It is getting its time from two different servers and averaging the results.
c. The time is within two standard deviations of normal.
d. The server that it is getting its time from has a reference clock.
All materials on the site are licensed Creative Commons Attribution-Sharealike 3.0 Unported CC BY-SA 3.0 & GNU Free Documentation License (GFDL)
If you are the copyright holder of any material contained on our site and intend to remove it, please contact our site administrator for approval.
© 2016-2026 All site design rights belong to S.Y.A.