Microsoft Azure Machine Learning
Chapter 12. Case Study Exercise I
Now you already know a decent bit about Azure ML! It's time to use that knowledge to look at some real-world problems. You may not be able to solve them fully at this point, but you can certainly give it a try and come up with some kind of a working solution.
In this chapter, we will present a problem in the form of a case study and will solve it with a very simple, but end-to-end solution. Like in other chapters so far, it won't present a step-by-step guide with all the details; however, it would just provide pointers for you to solve the problem. This chapter assumes that you have successfully completed reading all the previous chapters or already know about Azure ML.
Problem definition and scope
If you are flying somewhere, it becomes a very bizarre experience if the flight gets delayed. We can't do much in that regard, but given the historical dataset, we can predict and know well ahead whether a particular flight will get delayed or not. That's the problem we will solve as a case study.
The complete solution to the problem of predicting a flight delay will be huge and is beyond the scope of this book because of the huge data crunching that it takes. However, we will limit the scope by limiting the dataset and simplifying the solution.
The dataset
We will use the sample dataset that comes by default in ML Studio. This is the subset of the passenger flight's on-time performance data taken from the TranStats data collection from U.S. Department of Transportation (DOT) (http://www.transtats.bts.gov/DL_SelectFields.asp?Table_ID=236&DB_Short_Name=On-Time).
The dataset has been preprocessed and is filtered to include only the 70 busiest airports in the continental United States for the period between April 2013 to October 2013. It contains the following columns:
· Carrier: This contains the code assigned by IATA and is commonly used to identify a carrier.
· OriginAirportID (Origin Airport's Airport ID): This is an identification number assigned by DOT to identify a unique airport.
· DestAirportID (Destination Airport;s Airport ID): This is an identification number assigned by DOT to identify a unique airport.
· CRSDepTime: This is the scheduled departure time (local time in hh:mm).
· DepDelay: This is the difference in minutes between the scheduled and the actual departure time. Early departures show negative numbers.
· DepDel15 (Departure Delay Indicator): This shows a delay in the departure of a flight by 15 minutes or more (here, 1=Yes).
· CRSArrTime: This is the scheduled arrival time (local time in hh:mm).
· ArrDelay: This is the difference in minutes between the scheduled and the actual arrival time. Early arrivals show negative numbers.
· ArrDel15 (Arrival Delay Indicator): This shows a delay in the arrival of a fight by 15 minutes or more (here, 1=Yes).
· Cancelled: This is the cancelled flight indicator (here, 1=Yes).
Note
Note that the cancelled flights have been considered as delayed and have been set as ArrDel15 = 1.
From our experience, we know that the flight timing often gets impacted by weather conditions, so it makes sense to collect and process the relevant weather data corresponding to the origin and destination airports. For simplicity, we will consider only the flights on time dataset here. However, you are encouraged to experiment and merge the weather dataset and prepare your dataset to build the model. There is a sample Weather Dataset that comes by default in ML Studio.
Data exploration and preparation
In your experiment, drag the Flight Delays Data sample dataset and click on the Visualize option to explore the dataset. You can find that some columns have lots of missing values. You can clean the missing data using a Clean Missing Data module by replacing it with MICE as the cleaning mode.
There are certain columns, such as DayOfWeek, OriginAirportID, and DestAirportID which contain continuous numbers; however, they are categorical variables. So, use the Metadata Editor module to set them as Categorical.
Feature selection
Before you start developing the model, it is important to select or generate a set of variables that have the most predictive power and remove any redundant and not so important features. In this case, all the data points are of the same year, so the year column is not required here. We are interested in predicting the delays before the journey starts, so the DepDel15 and DepDelay columns are not important. Again, both the ArrDelay and ArrDelay15 columns are about arrival delay. Here, we are just interested in whether the flight got delayed or not. So, ArrDelay is not required. All the cancelled flights are labeled as delayed, so the Cancelled column is also not required. You filter these columns using the Project Columns module and you will be left with the columns that contain the required features and label.
Model development
You have to predict whether the flight would be delayed or not. As you found from the dataset, any flight delayed for more than 15 minutes has been labeled as delayed and the ArrDelay15 corresponding label contains 1. Here, the ArrDelay15 column is the target variable and it only contains 0 and 1. Clearly, it's a two-class classification problem.
As you have already explored, there are several two-class classification algorithms available in ML Studio. For simplicity, we would just build the model here with the Two-Class Boosted Decision Tree module with the following parameters:
· The Maximum number of leaves per tree option is set at 128
· The Minimum number of samples per leaf node option is set at 50
· The Learning rate option is set at 0.2
· The Number of trees constructed option is set at 500
You are encouraged to try out different algorithms and also use the Sweep Parameters module to choose the optimum parameters.
To train the model, you need to split the dataset and use one subset for training and other for scoring and evaluation.
Your experiment, after running successfully, may look something like the following:
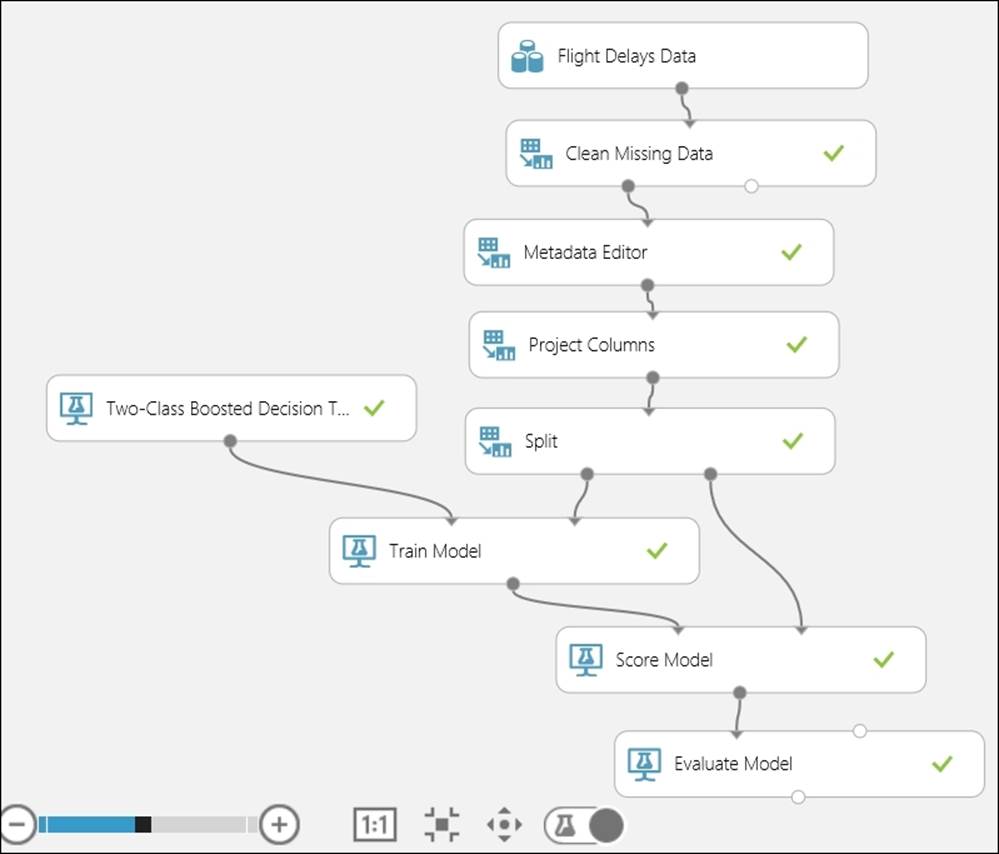
After you are happy with your experiment and satisfied with the trained model, you can proceed to deploy it by publishing it as a web service.
Model deployment
Before publishing your model as a web service, create a scoring experiment and make sure that the Web service input and the Web service output modules are properly connected. Also, process the model if you want your output in a proper format, for example, outputting only the scored label and input to the score model may not contain the label column; in this case, you can also filter the ArrDelay15 column along with the others in the Project Columns module connected to the Score Model module. Let's take a look at the following screenshot:
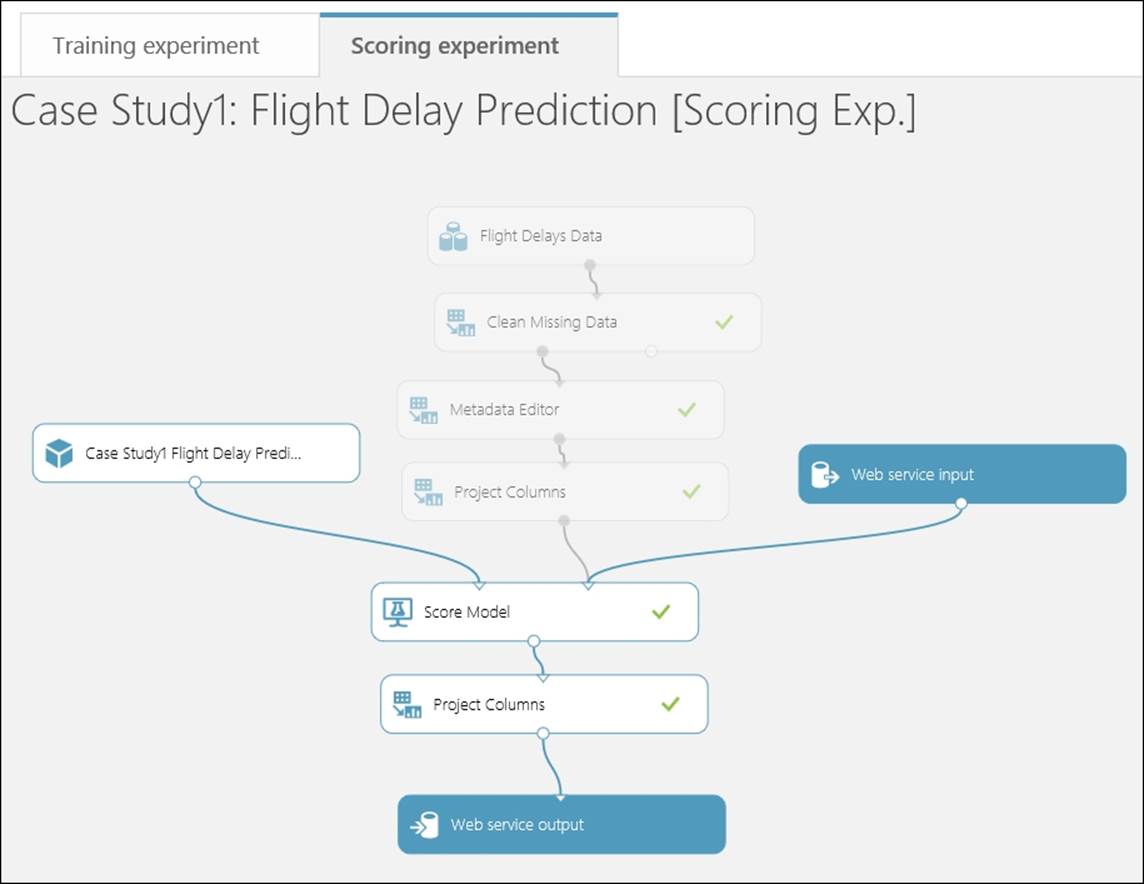
Then, publish your scoring experiment, so that it would be available as a web service in the staging environment. Test your web service visually and also with Excel. If you are good at programming, you're encouraged to test your web service by writing a small client program as well.
Summary
You just finished building a predictive solution in this case study. You started the chapter by defining and understanding the problem. You acquired the dataset, which in this case is the sample dataset available in ML Studio. Then, you proceeded to perform data exploration and preparation before building the predictive model. You used the boosted decision tree to build the model. After running the experiment successfully, you created a scoring experiment and used a saved trained model in it. Finally, you published the experiment as a web service and tested it.
In the next chapter, you are going to learn to build your own models, with another case study where you would solve a regression problem.
All materials on the site are licensed Creative Commons Attribution-Sharealike 3.0 Unported CC BY-SA 3.0 & GNU Free Documentation License (GFDL)
If you are the copyright holder of any material contained on our site and intend to remove it, please contact our site administrator for approval.
© 2016-2026 All site design rights belong to S.Y.A.