Excel 2016 Power Programming with VBA (2016)
Part II. Advanced VBA Techniques
· Chapter 8
Working with Pivot Tables
· Chapter 9
Working with Charts
· Chapter 10
Interacting with Other Applications
· Chapter 11
Working with External Data and Files
Chapter 8. Working with Pivot Tables
In This Chapter
· Creating pivot tables with VBA
· Looking at examples of VBA procedures that create pivot tables
· Using VBA to create a worksheet table from a summary table
An Introductory Pivot Table Example
Excel’s pivot table feature is, arguably, the most innovative and powerful feature in Excel. Pivot tables first appeared in Excel 5, and the feature has been improved in every subsequent version. This chapter is not an introduction to pivot tables. We assume that you’re familiar with this feature and its terminology and that you know how to create and modify pivot tables manually.
As you probably know, creating a pivot table from a database or list enables you to summarize data in ways that otherwise would not be possible — and is amazingly fast and requires no formulas. You also can write VBA code to generate and modify pivot tables.
This section gets the ball rolling with a simple example of using VBA to create a pivot table.
Figure 8.1 shows a simple worksheet range that contains four fields: SalesRep, Region, Month, and Sales. Each record describes the sales for a particular sales representative in a particular month.
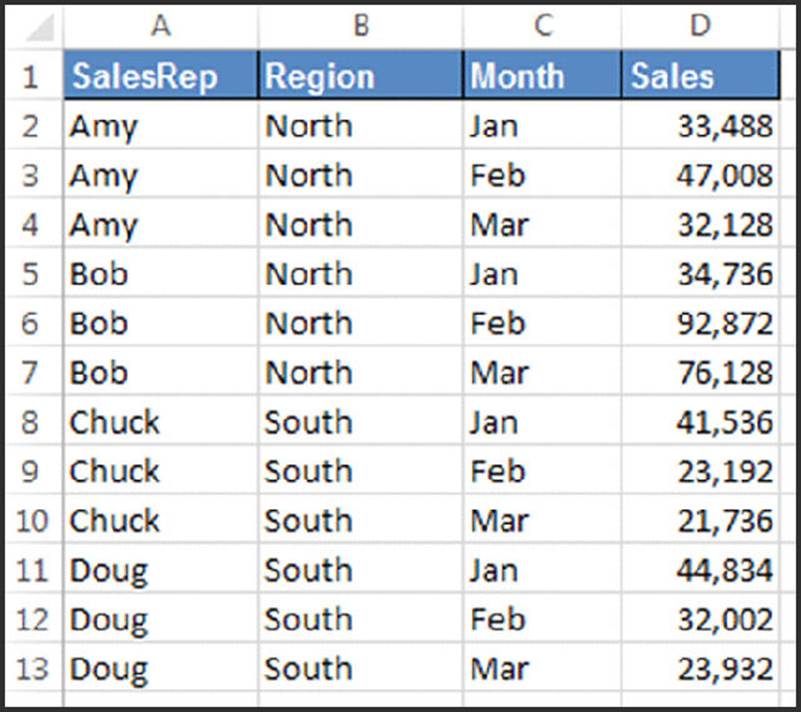
Figure 8.1 This table is a good candidate for a pivot table.
 On the Web
This workbook, named simple pivot table.xlsm, is available on the book’s website.
Creating a pivot table
Figure 8.2 shows a pivot table created from the data, along with the PivotTable Fields task pane. This pivot table summarizes the sales performance by sales representative and month. This pivot table is set up with the following fields:
· Region: A report filter field in the pivot table
· SalesRep: A row field in the pivot table
· Month: A column field in the pivot table
· Sales: A values field in the pivot table that uses the SUM function
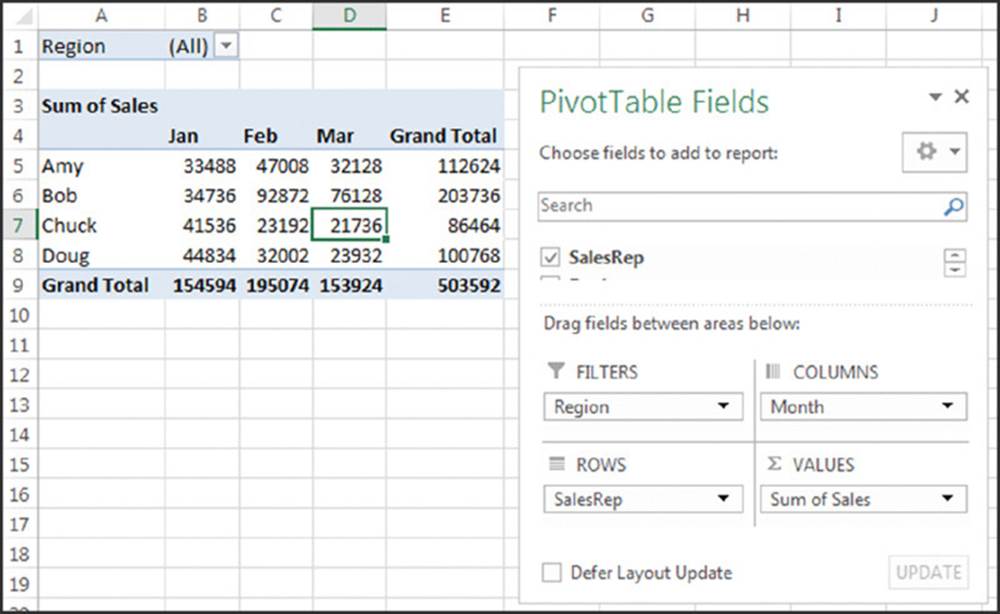
Figure 8.2 A pivot table created from the data in Figure 8.1.
If you were to record a macro in Excel 2016 while building the pivot table in Figure 8.2, the macro recorder would generate the following code:
Sub CreatePivotTable()
Sheets.Add
ActiveWorkbook.PivotCaches.Create _
(SourceType:=xlDatabase, _
SourceData:="Sheet1!R1C1:R13C4", _
Version:=6).CreatePivotTable _
TableDestination:="Sheet2!R3C1", _
TableName:="PivotTable1", _
DefaultVersion:=6
Sheets("Sheet2").Select
Cells(3, 1).Select
With ActiveSheet.PivotTables("PivotTable1").PivotFields("Region")
.Orientation = xlPageField
.Position = 1
End With
With ActiveSheet.PivotTables("PivotTable1").PivotFields("SalesRep")
.Orientation = xlRowField
.Position = 1
End With
With ActiveSheet.PivotTables("PivotTable1").PivotFields("Month")
.Orientation = xlColumnField
.Position = 1
End With
ActiveSheet.PivotTables("PivotTable1").AddDataField _
ActiveSheet.PivotTables("PivotTable1").PivotFields("Sales"), _
"Sum of Sales", xlSum
End Sub
If you execute this macro, it will almost certainly end with an error. Examine the code, and you’ll see that the macro recorder hard-coded the worksheet name (Sheet2) for the pivot table. If that sheet already exists (or if the new sheet that’s added has a different name), the macro ends with an error. But a more serious problem is that the macro recorder also hard-coded the pivot table name. The new pivot table’s name won’t be PivotTable1 if the workbook has other pivot tables.
But even though the recorded macro doesn’t work, it’s not completely useless. The code provides lots of insight for writing code to generate pivot tables.
 Data appropriate for a pivot table
A pivot table requires that your data be in the form of a rectangular database. You can store the database in either a worksheet range (which can be a table or just a normal range) or an external database file. Although Excel can generate a pivot table from any database, not all databases benefit from this treatment.
In general, fields in a database table consist of two types:
· Data: Contains a value or data to be summarized. For the sales example, the Sales field is a data field.
· Category: Describes the data. For the sales data, the SalesRep, Region, and Month fields are category fields because they describe the data in the Sales field.
A database table that’s appropriate for a pivot table is said to be normalized. In other words, each record (or row) contains information that describes the data.
A single database table can have any number of data fields and category fields. When you create a pivot table, you usually want to summarize one or more of the data fields. Conversely, the values in the category fields appear in the pivot table as rows, columns, or filters.
If you’re not clear on the concept, check out the normalized data.xlsx workbook on the book’s website. This workbook contains an example of a range of data before and after being normalized to make it suitable for a pivot table.
Examining the recorded code for the pivot table
VBA code that works with pivot tables can be confusing. To make any sense of the recorded macro, you need to know about a few relevant objects, all of which are explained in the Help system.
· PivotCaches: A collection of PivotCache objects in a Workbook object (the data used by a pivot table is stored in a pivot cache).
· PivotTables: A collection of PivotTable objects in a Worksheet object.
· PivotFields: A collection of fields in a PivotTable object.
· PivotItems: A collection of individual data items within a field category.
· CreatePivotTable: A method that creates a pivot table by using the data in a pivot cache.
Cleaning up the recorded pivot table code
As with most recorded macros, the preceding example isn’t as efficient as it could be. And, as noted, it’s likely to generate an error. You can simplify the code to make it more understandable and also to prevent the error. The hand-crafted code that follows generates the same pivot table as the procedure previously listed:
Sub CreatePivotTable()
Dim PTCache As PivotCache
Dim PT As PivotTable
' Create the cache
Set PTCache = ActiveWorkbook.PivotCaches.Create( _
SourceType:=xlDatabase, _
SourceData:=Range("A1").CurrentRegion)
' Add a new sheet for the pivot table
Worksheets.Add
' Create the pivot table
Set PT = ActiveSheet.PivotTables.Add( _
PivotCache:=PTCache, _
TableDestination:=Range("A3"))
' Specify the fields
With PT
.PivotFields("Region").Orientation = xlPageField
.PivotFields("Month").Orientation = xlColumnField
.PivotFields("SalesRep").Orientation = xlRowField
.PivotFields("Sales").Orientation = xlDataField
'no field captions
.DisplayFieldCaptions = False
End With
End Sub
The CreatePivotTable procedure is simplified (and might be easier to understand) because it declares two object variables: PTCache and PT. A new PivotCache object is created by using the Create method. A worksheet is added, and it becomes the active sheet (the destination for the pivot table). Then a new PivotTable object is created by using the Add method of the PivotTables collection. The last section of the code adds the four fields to the pivot table and specifies their location within it by assigning a value to the Orientation property.
The original macro hard-coded both the data range used to create the PivotCache object ('Sheet1!R1C1:R13C4') and the pivot table location (Sheet2). In the CreatePivotTable procedure, the pivot table is based on the current region surrounding cell A1. This ensures that the macro will continue to work properly if more data is added.
Adding the worksheet before the pivot table is created eliminates the need to hard-code the sheet reference. Yet another difference is that the hand-written macro doesn’t specify a pivot table name. Because the PT object variable is created, your code doesn’t ever have to refer to the pivot table by name.
 Note
Note
The code could be more general through the use of indices rather than literal strings for the PivotFields collections. This way, if the user changes the column headings, the code will still work. For example, more general code would use PivotFields(1) rather than PivotFields('Region').
As always, the best way to master this topic is to record your actions in a macro to find out its relevant objects, methods, and properties. Then study the Help topics to understand how everything fits together. In almost every case, you’ll need to modify the recorded macros. Or, after you understand how to work with pivot tables, you can write code from scratch and avoid the macro recorder.
Pivot table compatibility
If you plan to share a workbook that contains a pivot table with users of previous versions of Excel, you need to pay careful attention to compatibility. If you look at the recorded macro in the"Creating a pivot table" section, you see the following statement:
DefaultVersion:=6
If your workbook is in compatibility mode, the recorded statement is:
DefaultVersion:=xlPivotTableVersion10
You’ll also find that the recorded code is completely different because Microsoft has made significant changes in pivot tables beginning with Excel 2007.
Assume that you create a pivot table in Excel 2016 and give the workbook to a coworker who has Excel 2003. The coworker will see the pivot table, but it will not be refreshable. In other words, it’s just a dead table of numbers.
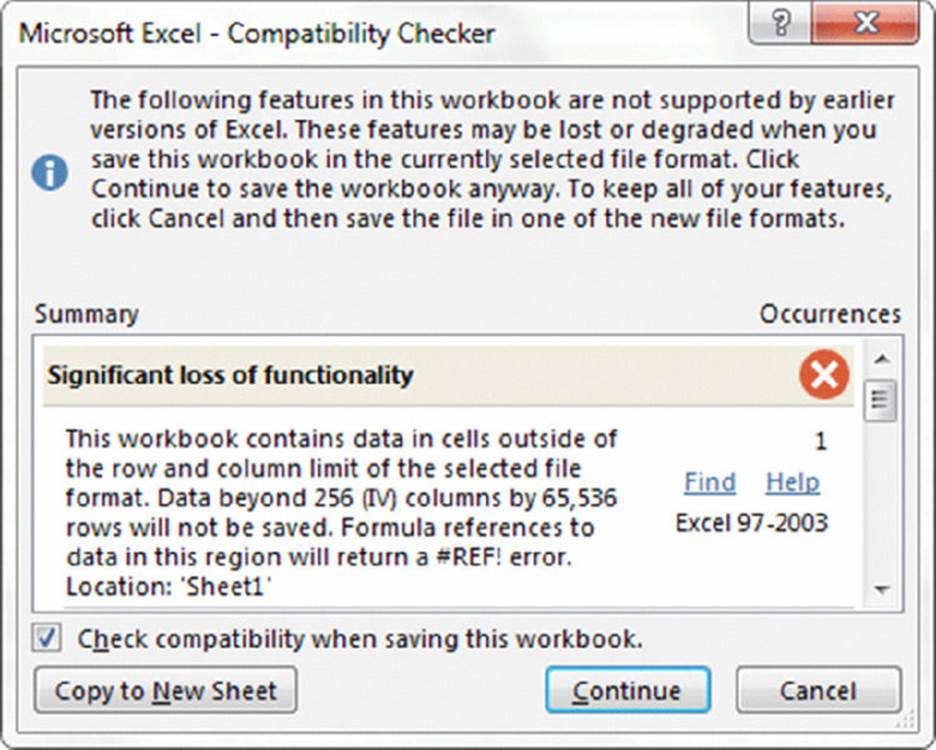
To create a backward-compatible pivot table in Excel 2016, you must save your file in XLS format and then reopen it. After doing so, pivot tables that you create will work with versions prior to Excel 2007. But, of course, you won’t be able to take advantage of all the new pivot table features introduced in later versions of Excel.
Fortunately, Excel’s Compatibility Checker will alert you regarding this type of compatibility issue (see the accompanying figure). However, it won’t check your pivot table–related macros for compatibility. The macros in this chapter do not generate backward-compatible pivot tables.
Creating a More Complex Pivot Table
In this section, we present VBA code to create a relatively complex pivot table.
Figure 8.3 shows part of a large worksheet table. This table has 15,840 rows and consists of hierarchical budget data for a corporation. The corporation has 5 divisions, and each division contains 11 departments. Each department has 4 budget categories, and each budget category contains several budget items. Budgeted and actual amounts are included for each of the 12 months. The goal is to summarize this information with a pivot table.
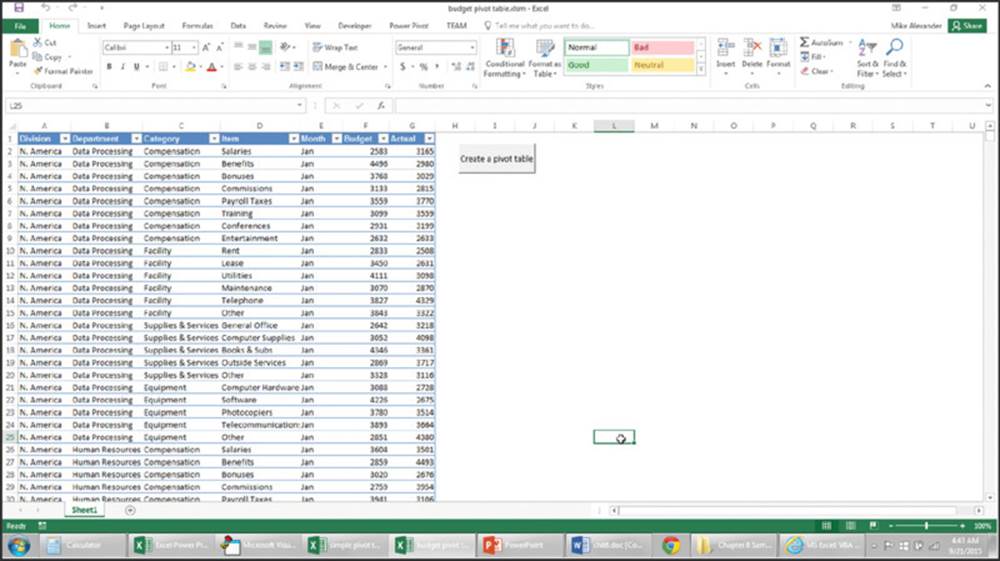
Figure 8.3 The data in this workbook will be summarized in a pivot table.
On the Web
This workbook is available on the book’s website in a file named budget pivot table.xlsm.
Figure 8.4 shows a pivot table created from the data. Note that the pivot table contains a calculated field named Variance. This field is the difference between the Budget amount and the Actual amount.
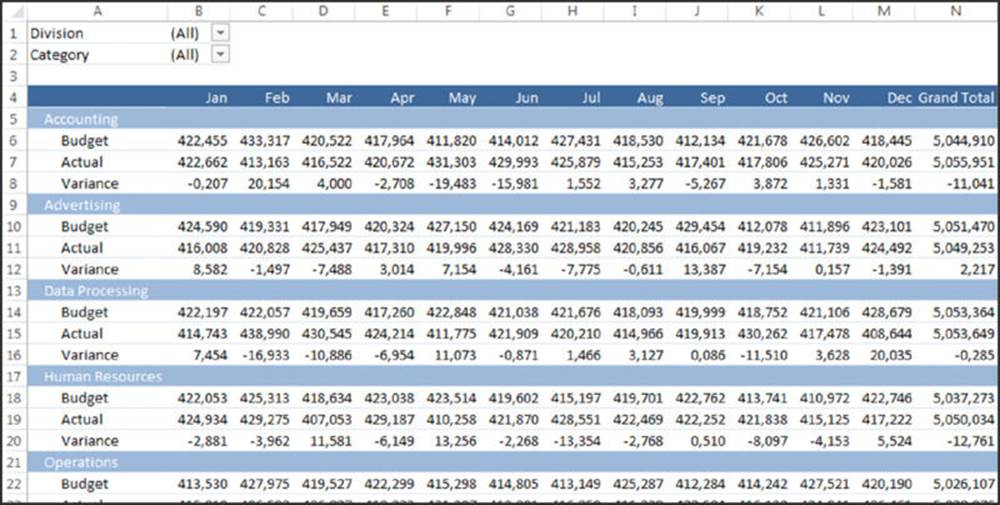
Figure 8.4 A pivot table created from the budget data.
Note
Another option is to insert a new column in the table and create a formula to calculate the difference between the budget and actual amounts. If the data is from an external source (rather than in a worksheet), that option may not be possible.
The code that created the pivot table
Here’s the VBA code that created the pivot table:
Sub CreatePivotTable()
Dim PTcache As PivotCache
Dim PT As PivotTable
Application.ScreenUpdating = False
' Delete PivotSheet if it exists
On Error Resume Next
Application.DisplayAlerts = False
Sheets("PivotSheet").Delete
On Error GoTo 0
' Create a Pivot Cache
Set PTcache = ActiveWorkbook.PivotCaches.Create( _
SourceType:=xlDatabase, _
SourceData:=Range("A1").CurrentRegion.Address)
' Add new worksheet
Worksheets.Add
ActiveSheet.Name ="PivotSheet"
ActiveWindow.DisplayGridlines = False
' Create the Pivot Table from the Cache
Set PT = ActiveSheet.PivotTables.Add( _
PivotCache:=PTcache, _
TableDestination:=Range("A1"), _
TableName:="BudgetPivot")
With PT
' Add fields
.PivotFields("Category").Orientation = xlPageField
.PivotFields("Division").Orientation = xlPageField
.PivotFields("Department").Orientation = xlRowField
.PivotFields("Month").Orientation = xlColumnField
.PivotFields("Budget").Orientation = xlDataField
.PivotFields("Actual").Orientation = xlDataField
.DataPivotField.Orientation = xlRowField
' Add a calculated field to compute variance
.CalculatedFields.Add"Variance","=Budget-Actual"
.PivotFields("Variance").Orientation = xlDataField
' Specify a number format
.DataBodyRange.NumberFormat ="0,000"
' Apply a style
.TableStyle2 ="PivotStyleMedium2"
' Hide Field Headers
.DisplayFieldCaptions = False
' Change the captions
.PivotFields("Sum of Budget").Caption =" Budget"
.PivotFields("Sum of Actual").Caption =" Actual"
.PivotFields("Sum of Variance").Caption =" Variance"
End With
End Sub
How the more complex pivot table works
The CreatePivotTable procedure starts by deleting the PivotSheet worksheet if it already exists. It then creates a PivotCache object, inserts a new worksheet named PivotSheet, and creates the pivot table from the PivotCache. The code then adds the following fields to the pivot table:
· Category: A report filter (page) field
· Division: A report filter (page) field
· Department: A row field
· Month: A column field
· Budget: A data field
· Actual: A data field
Note that the Orientation property of the DataPivotField is set to xlRowField in the following statement:
.DataPivotField.Orientation = xlRowField
This statement determines the overall orientation of the pivot table, and it represents the Sum Values field in the Pivot Table Fields task pane (see Figure 8.5). Try moving that field to the Columns section to see how it affects the pivot table layout.
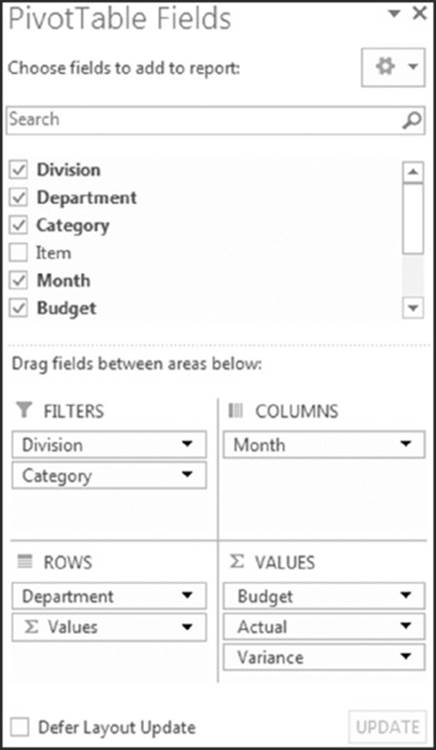
Figure 8.5 The Pivot Table Fields task pane.
Next, the procedure uses the Add method of the CalculatedFields collection to create the calculated field Variance, which subtracts the Actual amount from the Budget amount. This calculated field is assigned as a data field.
Note
To add a calculated field to a pivot table manually, use the PivotTable ➜ Options ➜ Calculations ➜ Fields, Items, & Sets ➜ Calculated Field command, which displays the Insert Calculated Field dialog box.
Finally, the code makes a few cosmetic adjustments:
· Applies a number format to the DataBodyRange (which represents the entire pivot table data).
· Applies a style.
· Hides the captions (equivalent to the PivotTable Tools ➜ Options ➜ Show ➜ Field Headers command).
· Changes the captions displayed in the pivot table. For example, Sum of Budget is replaced by Budget. Note that the Budget string is preceded by a space. Excel doesn’t allow you to change a caption that corresponds to a field name, so adding a space gets around this restriction.
Note
Remember to take full advantage of the macro recorder to learn about the various properties. Performing actions while recording a macro is an excellent way to expose the correct coding syntax you need. The macro recorder, combined with the information in the Help system (and a fair amount of trial and error), will give you all the information you need to create your own custom code.
Creating Multiple Pivot Tables
The final example creates a series of pivot tables that summarize data collected in a customer survey. That survey data consists of 150 rows. Each row contains the respondent’s sex plus a numerical rating using a 1–5 scale for each of the 14 survey items.
On the Web
This workbook, named survey data pivot tables.xlsm, is available on the book’s website.
Figure 8.6 shows a few of the 28 pivot tables produced by the macro. Each survey item is summarized in 2 pivot tables (one showing percentages, and one showing the actual frequencies).
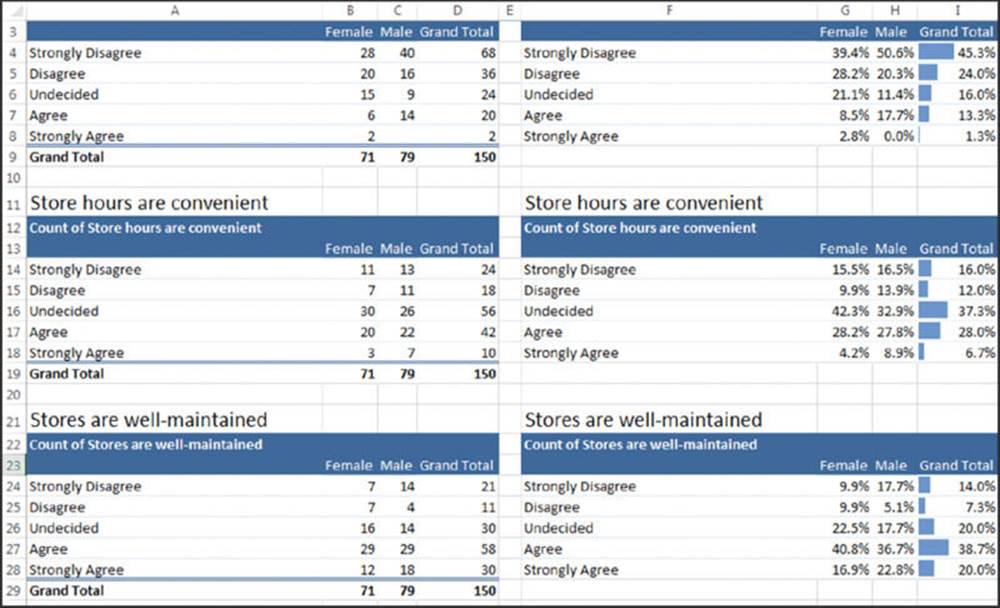
Figure 8.6 Several pivot tables created by a VBA procedure.
The VBA code that created the pivot tables follows:
Sub MakePivotTables()
' This procedure creates 28 pivot tables
Dim PTCache As PivotCache
Dim PT As PivotTable
Dim SummarySheet As Worksheet
Dim ItemName As String
Dim Row As Long, Col As Long, i As Long
Application.ScreenUpdating = False
' Delete Summary sheet if it exists
On Error Resume Next
Application.DisplayAlerts = False
Sheets("Summary").Delete
On Error GoTo 0
' Add Summary sheet
Set SummarySheet = Worksheets.Add
ActiveSheet.Name ="Summary"
' Create Pivot Cache
Set PTCache = ActiveWorkbook.PivotCaches.Create( _
SourceType:=xlDatabase, _
SourceData:=Sheets("SurveyData").Range("A1"). _
CurrentRegion)
Row = 1
For i = 1 To 14
For Col = 1 To 6 Step 5 '2 columns
ItemName = Sheets("SurveyData").Cells(1, i + 2)
With Cells(Row, Col)
.Value = ItemName
.Font.Size = 16
End With
' Create pivot table
Set PT = ActiveSheet.PivotTables.Add( _
PivotCache:=PTCache, _
TableDestination:=SummarySheet.Cells(Row + 1, Col))
' Add the fields
If Col = 1 Then 'Frequency tables
With PT.PivotFields(ItemName)
.Orientation = xlDataField
.Name ="Frequency"
.Function = xlCount
End With
Else ' Percent tables
With PT.PivotFields(ItemName)
.Orientation = xlDataField
.Name ="Percent"
.Function = xlCount
.Calculation = xlPercentOfColumn
.NumberFormat ="0.0%"
End With
End If
PT.PivotFields(ItemName).Orientation = xlRowField
PT.PivotFields("Sex").Orientation = xlColumnField
PT.TableStyle2 ="PivotStyleMedium2"
PT.DisplayFieldCaptions = False
If Col = 6 Then
' add data bars to the last column
PT.ColumnGrand = False
PT.DataBodyRange.Columns(3).FormatConditions. _
AddDatabar
With pt.DataBodyRange.Columns(3).FormatConditions(1)
.BarFillType = xlDataBarFillSolid
.MinPoint.Modify newtype:=xlConditionValueNumber, newvalue:=0
.MaxPoint.Modify newtype:=xlConditionValueNumber, newvalue:=1
End With
End If
Next Col
Row = Row + 10
Next i
' Replace numbers with descriptive text
With Range("A:A,F:F")
.Replace"1","Strongly Disagree"
.Replace"2","Disagree"
.Replace"3","Undecided"
.Replace"4","Agree"
.Replace"5","Strongly Agree"
End With
End Sub
Note that all these pivot tables were created from a single PivotCache object.
The pivot tables are created in a nested loop. The Col loop counter goes from 1 to 6 by using the Step parameter. The instructions vary a bit for the second column of pivot tables. Specifically, the pivot tables in the second column do the following:
· Display the count as a percent of the column
· Do not show grand totals for the rows
· Are assigned a number format
· Display conditional formatting data bars
The Row variable keeps track of the starting row of each pivot table. The final step is to replace the numeric categories in columns A and F with text. For example, 1 is replaced with Strongly Agree.
Creating a Reverse Pivot Table
A pivot table is a summary of data in a table. But what if you have a summary table, and you’d like to create a normalized table from the summary? Figure 8.7 shows an example. Range B2:F14 contains a summary table — similar to a very simple pivot table. Columns I:K contain a 48-row table created from the summary table. In the table, each row contains one data point, and the first two columns describe that data point. In other words, the transformed data is normalized. (See the sidebar, “Data appropriate for a pivot table,” earlier in this chapter.)
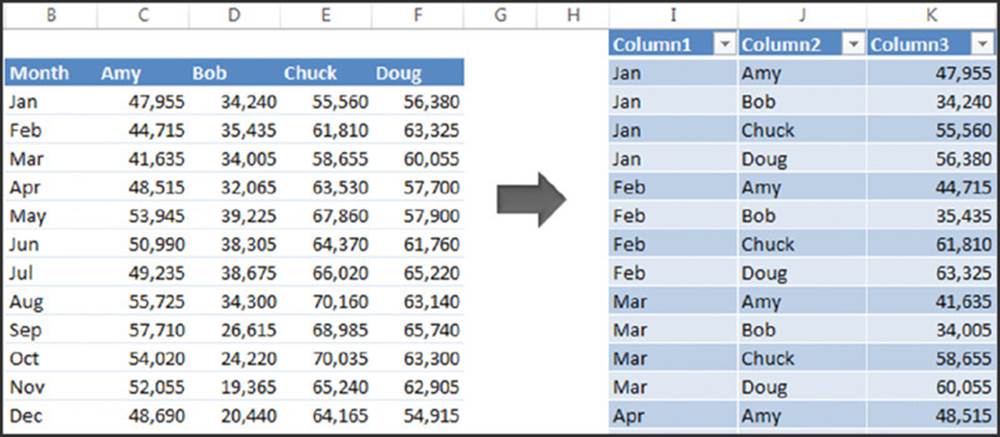
Figure 8.7 The summary table on the left will be converted to the table on the right.
Excel doesn’t provide a way to transform a summary table into a normalized table, so it’s a good job for a VBA macro. For example, the UserForm, shown in Figure 8.8, gets the input and output ranges and also has an option to convert the output range to a table.
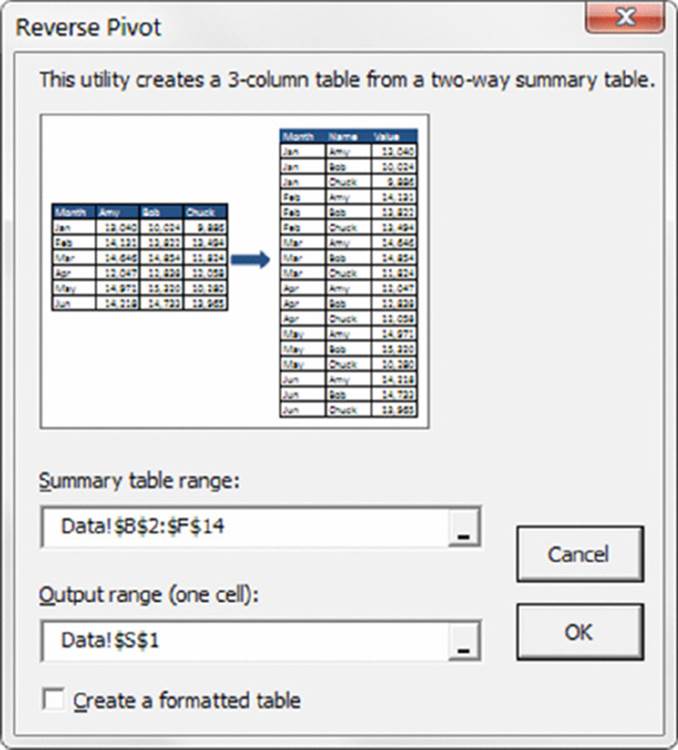
Figure 8.8 This dialog box asks the user for the ranges.
On the Web
This workbook, named reverse pivot table.xlsm, is available on the book’s website.
When the user clicks the OK button in the UserForm, VBA code validates the ranges and then calls the ReversePivot procedure with this statement:
Call ReversePivot(SummaryTable, OutputRange, cbCreateTable)
It passes three arguments:
· SummaryTable: A Range object that represents the summary table
· OutputRange: A Range object that represents the upper-left cell of the output range
· cbCreateTable: The Checkbox object on the UserForm
This procedure will work for any size summary table. The number of data rows in the output table will be equal to (r-1) * (c-1), where r and c represent the number of rows and columns in SummaryTable.
The code for the ReversePivot procedure follows:
Sub ReversePivot(SummaryTable As Range, _
OutputRange As Range, CreateTable As Boolean)
Dim r As Long, c As Long
Dim OutRow As Long, OutCol As Long
' Convert the range
OutRow = 2
Application.ScreenUpdating = False
OutputRange.Range("A1:C3") = Array("Column1","Column2","Column3")
For r = 2 To SummaryTable.Rows.Count
For c = 2 To SummaryTable.Columns.Count
OutputRange.Cells(OutRow, 1) = SummaryTable.Cells(r, 1)
OutputRange.Cells(OutRow, 2) = SummaryTable.Cells(1, c)
OutputRange.Cells(OutRow, 3) = SummaryTable.Cells(r, c)
OutRow = OutRow + 1
Next c
Next r
' Make it a table?
If CreateTable Then _
ActiveSheet.ListObjects.Add xlSrcRange, _
OutputRange.CurrentRegion, , xlYes
End Sub
The procedure is fairly simple. The code loops through the rows and columns in the input range and then writes the data to the output range. The output range will always have three columns. The OutRow variable keeps track of the current row in the output range. Finally, if the user checked the check box, the output range is converted to a table by using the Add method of the ListObjects collection.
All materials on the site are licensed Creative Commons Attribution-Sharealike 3.0 Unported CC BY-SA 3.0 & GNU Free Documentation License (GFDL)
If you are the copyright holder of any material contained on our site and intend to remove it, please contact our site administrator for approval.
© 2016-2026 All site design rights belong to S.Y.A.