Marketing Analytics: Data-Driven Techniques with Microsoft Excel (2014)
Part III. Forecasting
Chapter 15. Using Neural Networks to Forecast Sales
Recall from Chapter 10 “Using Multiple Regression to Predict Sales,” that to use multiple regression you had to posit the form of the relationship between the dependent and independent variables. Usually you assumed that the independent variables influenced the dependent variable via a linear relationship. However, if the relationship between the independent variables and the dependent variable is highly complex, there is little chance that multiple regression can find the relationship. Neural nets are an amazing form of artificial intelligence that can capture these complex relationships. Essentially a neural network is a “black box” that searches many models (including nonlinear models involving interactions) to find a relationship involving the independent variables that best predict the dependent variable. In a neural network the independent variables are called input cells and the dependent variable is called an output cell (more than one output is OK).
This chapter shows how to use Palisade Corporation's great Excel add-in, NeuralTools, to easily fit a neural network to data. You can download a 15-day trial version of NeuralTools at Palisade.com.
Regression and Neural Nets
As in regression, neural nets have a certain number of observations (say, N). Each observation contains a value for each independent variable and dependent variable. Also similar to regression, the goal of the neural network is to make accurate predictions for the output cell or dependent variable. As you will see, the usage of neural networks is increasing rapidly because neural networks are great at finding patterns. In regression you only find a pattern if you know what to look for. For example, if y = Ln x and you simply use x as an independent variable, you cannot predict y very well. A neural network does not need to be “told” the nature of the relationship between the independent variables and the dependent variable. If a relationship or pattern exists and you provide the neural network enough data, it can find the pattern on its own by “learning” it from the data. A major advantage of neural networks over regression is that this method requires no statistical assumptions about your data. For example, unlike regression you do not assume that your errors are independent and normally distributed.
Using Neural Networks
Neural networks have been successfully applied in many situations. This section briefly describes some actual applications of neural networks.
Predicting the Stock Market
The efficient market hypothesis of financial markets states that the “past history” of a stock's returns yields no information about the future return of the stock. The late Halbert White, formerly an economics professor at UC San Diego, examines returns on IBM to see if the market is efficient in his 1988 white paper “Economic Prediction Using Neural Networks: The Case of IBM Daily Stock Returns” (see http://goo.gl/8vG9W). He begins by estimating a multiple regression where the dependent variable is the next day's return on IBM stock and the five independent variables are the return on IBM during each of the last five days. This regression yielded R2 = .0079, which is consistent with the efficient market hypothesis. White then estimated a neural network (containing one hidden layer) with the output cell corresponding to the next day's return on IBM and five input cells corresponding to the last five days' return on IBM. This neural network yielded R2 = .179. This implies that the past five days of IBM returns do contain information that can be used to make predictions about tomorrow's return on IBM. This lends support to those investors who believe thatmomentum or trends in recent returns can be used to improve predictions of future market changes.
Fidelity, a financial services corporation specializing in investment banking, also uses neural networks for predicting trends in the stock market. According to the October 9, 1993 Economist, Fidelity managed $2.6 billion in assets using neural networks.
For another example of an investment firm that uses neural networks to guide their investing strategy, see the following Ward Systems Group, Inc. article “Interviews with Real Traders” describing a hedge fund that had success using neural networks: http://www.neuroshell.com/traders.asp?task=interviews&id=15.
Driving Your Car
In 1995, researchers at Carnegie-Mellon University developed ALVINN (short for Automated Land Vehicle in a Neural Network, a neural network that can drive a car! ALVINN can tell if a car is nearby and then slow down the car based on information received via video cameras installed in the car. Using improved versions of ALVINN, in 10 years a neural network may be driving your car! Exercise 1 at the end of this chapter prompts you to look deeper into this scenario. The following article from Discover magazine discusses the future of computer driven cars:http://discovermagazine.com/2011/apr/10-future-tech-finally-ready-self-driving-cars.
Direct Market Targeting
Although most of us would not guess it based on the number of pieces of direct/junk mail delivered to our mailboxes, marketers often put a lot of effort into determining who receives direct mail offers. Direct mail campaigns target people who are most likely to respond to the mailing. An article from SSRN found at http://papers.ssrn.com/sol3/papers.cfm?abstract_id=370877 shows how neural networks were used to determine who a Dutch charity should target to maximize the response rate. The following independent variables were chosen to reflect the RFM method:
· Recency: Time since last donation
· Frequency: How many donations were made in the last five years
· Monetary Value: How much money has been donated in the last five years
The neural network outperformed all other methods used to identify the members of the mailing list who received a donor request. When mailing to 10 percent of the mailing list as chosen by the neural network, a 70 percent response rate was achieved, compared to a 30 percent overall response rate.
Bankruptcy Prediction
In finance and accounting it is helpful and important to accurately predict whether a company will go bankrupt during the next year. Edward Altman, an NYU finance professor, developed a method called Altman's Z-statistic in 1968 to predict whether a firm will go bankrupt during the next year based on the firm's financial ratios. This method uses a version of regression called discriminant analysis that Chapter 39, “Classification Algorithms: Naive Bayes Classifier and Discriminant Analysis,” discusses in greater detail. As discussed by Rick Wilson and Ramesh Sharda (“Bankruptcy Prediction Using Neural Networks,” Decision Support Systems Journal, 1994, pages 545–57), neural networks that use financial ratios as input cells have been more accurate than Altman's Z in their determination of whether a firm will go bankrupt during the next year.
Analyzing Scanner Data
Ann Furr Peterson and Thomas Grucca of the University of Iowa and Bruce Klemz of the University of Nebraska used neural networks to predict catsup market share based on price, which products were on display, and recent market share in 1999. The neural network outperformed (had a higherR2 and a lower MAPE) other statistical techniques. You can read more about the study here: http://dl.acm.org/citation.cfm?id=846174.
Neural Networks and Elevators
On September 22, 1993, the New York Times reported that Otis Elevator used neural networks to direct elevators. For example, if elevator 1 is on floor 10 and going up, elevator 2 is on floor 6 and going down, and elevator 3 is on floor 2 and going up, the neural network will recommend which elevator should answer a call to go down from floor 8. This system is used, for example, in the Marriott Hotel in Times Square.
Credit Cards and Loans
Many banks (Mellon and Chase are two examples) and credit card companies use neural networks to predict (on the basis of past usage patterns) whether a credit card transaction should be disallowed. If you have ever had a stop put on your credit card when you visit another city, there is a neural network to blame. Essentially the neural network attempts to spot patterns that indicate a credit card has been stolen before the theft is reported. This often happens to the author when he visits his daughter in Los Angeles and takes her shopping at the 3rd Street Promenade Mall in Santa Monica.
AVCO Financial also uses a neural net to determine whether to lend people money. The inputs to the neural network include information used to create credit scores (such as time at same address, annual income, number of times mortgage or credit card payments are late, etc.) By utilizing the neural network to determine if a person is a good or bad risk and giving loans only to people who are predicted to be good risks, AVCO increased its loan volume by 25 percent and decreased its default rate by 20 percent!
Using NeuralTools to Predict Sales
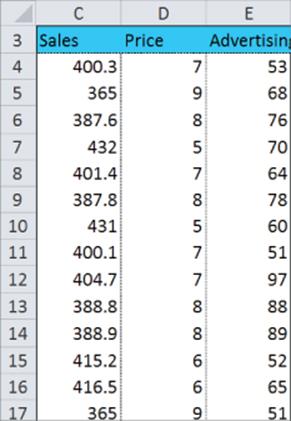
To demonstrate how neural networks can find patterns in data, you can use the data in the Data worksheet of the Neuralpriceads.xlsx file. A subset of this data is shown in Figure 15.1. You are given weekly sales of a product, the price, and advertising amount (in hundreds of dollars). You can construct sales under the assumption that when the price is high, advertising has no effect. More specifically, you can create weekly sales with the following rules:
· If Price is less than or equal to $8, then Sales = 500 – 15 * Price + 0.1 * Advertising.
· If Price is greater than $8, then Sales = 500 – 15 * Price. In this case advertising has no effect on sales.
Figure 15-1: Price and advertising neural networks example
To get started, perform the following steps:
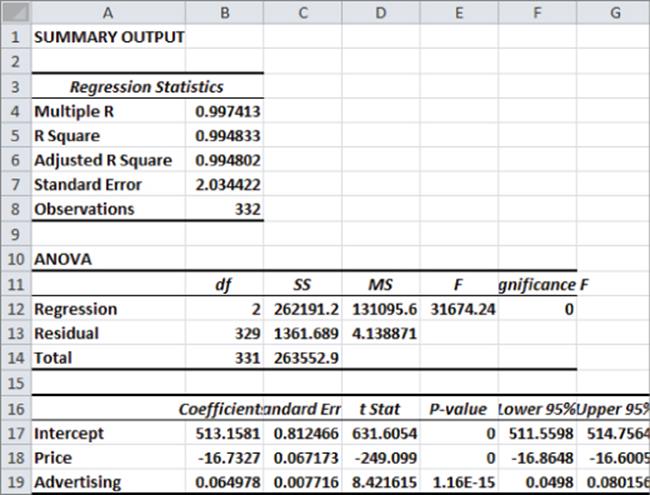
1. Run a multiple linear regression to predict Sales from Price and Advertising. The result is in the regression worksheet, as shown in Figure 15.2. The regression has a high R2 and a standard error of 2.03 units. You soon see that a neural network can find much better forecasts with a standard deviation of forecast errors under .03!
Figure 15-2: Regression model to predict sales
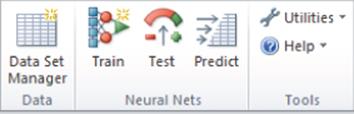
2. From the Start Menu select Programs and then choose Palisade Decision Tools. Click NeuralTools; you'll see the toolbar, as shown in Figure 15.3.
Figure 15-3: Neural Nets toolbar
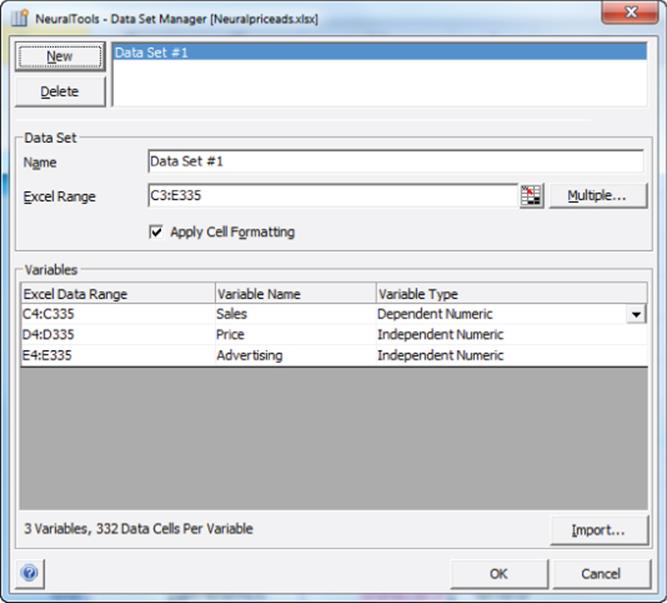
3. Select the data that will be analyzed. In this case select the data in the range C3:E335, and NeuralTools can automatically recognize the data. Columns of data may be classified as Independent or Dependent Variables and as Categorical (such as subscriber or nonsubscriber) or Numeric.
4. After selecting the data click on the NeuralTools tab on the Ribbon. Then select the Data Set Manager. The Data Set Manager enables you to specify the nature of the input variables and dependent variable (categorical or numeric.) All the variables are numeric, so fill in the Data Set Manager dialog box, as shown in Figure 15.4.
Figure 15-4: NeuralTools Data Set Manager dialog box
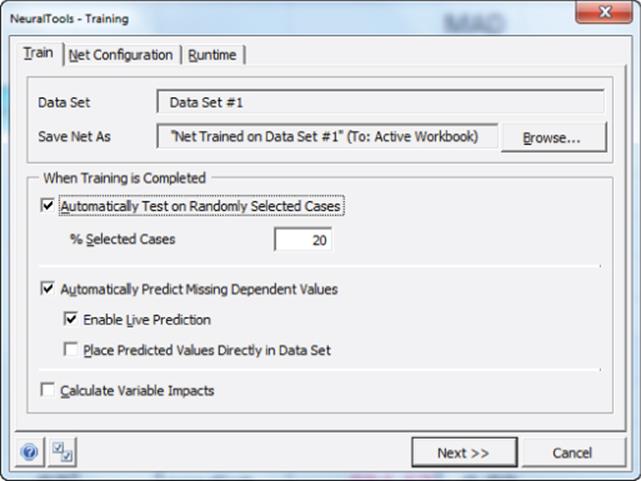
5. Select NeuralTools again from the Ribbon, then select Train and fill in the dialog box as shown in Figure 15.5 and click Next.
6. As also shown in Figure 15.5, check Automatically Test on Randomly Selected Cases to have NeuralTools “hold out” a randomly chosen 20 percent of the data for testing the network. This helps avoid a network that overfits the data used to fit the network and performs poorly on data that has not been seen by the network. Check Enable Live Prediction to place the Neural Network's predictions in the spreadsheet.
Figure 15-5: Training dialog box
NOTE
It is beyond the scope of this book to discuss how neural networks create predictions. It is sufficient to know that training a neural network is equivalent to trying many, many forms of the functional relationship between the dependent and independent variables. A neural network may seem like a “black box,” but if the analyst verifies that predictions for the testing set are nearly as accurate as predictions for the data used to fit the network, then the analyst has shown that the neural network works almost as well on data that has not yet been seen as on data used for fitting the neural network. This gives the analyst some confidence that the neural network is not simply overfitting data and will be useful for making predictions using unseen data. When estimating the accuracy of a forecast from a neural network, the analyst should use estimates of forecast accuracy based on the testing set, rather than error estimates based on the data used to fit the neural network.
7. Select Next and NeuralTools will fit a neural network to your data. At this point Train NeuralTools uses 80 percent of the data set to train the network. A summary report sheet appears. The most important portion of this report is shown in Figure 15.6.
Figure 15-6: NeuralTools report
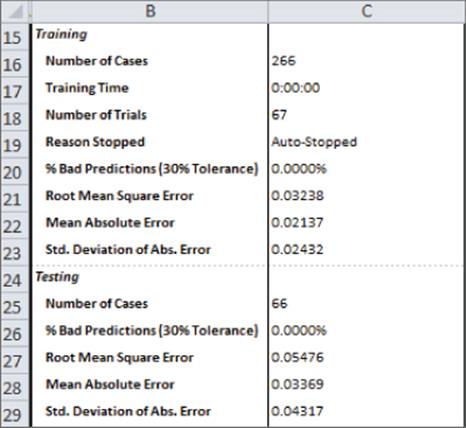
You can find that 266 data points were used to train the network, and 67 data points were used to test the network. The observations used for the testing and training sets are randomly chosen. That is, each observation has an 80 chance of being in the training set and a 20 percent chance of being in the testing set. In the training set the mean of the absolute errors is 0.02, and in the testing set the mean absolute error is worse (0.03) but still impressive. Also note that the Root Mean Square error (which approximates the Standard Error of the Regression) for the training set is 0.03 and for the testing set is 0.05. Recall that for the multiple regression the standard error was 2.03, far inferior to the neural net.
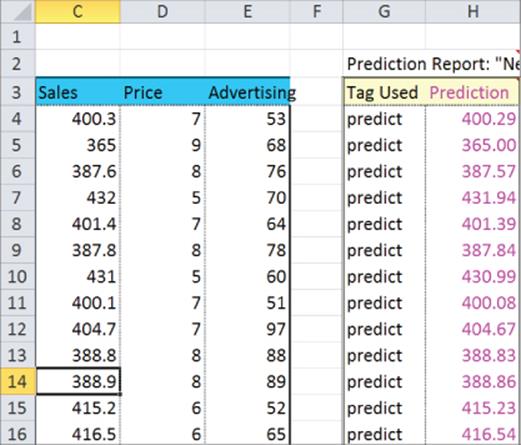
If you now select Predict from the Neural Net toolbar and fill in the dialog box, as shown in Figure 15.7, NeuralTools places predictions in the spreadsheet, as shown in Figure 15.8. You can see Columns C and H are nearly identical, indicating that the neural net figured out the pattern in the data.
Figure 15-7: Prediction dialog box
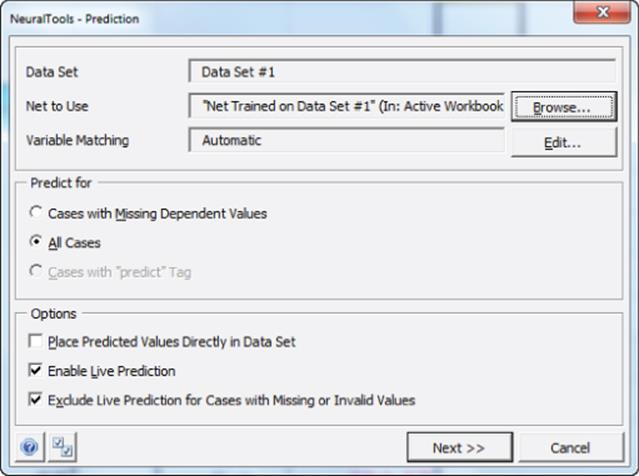
Figure 15-8: NeuralTools predictions
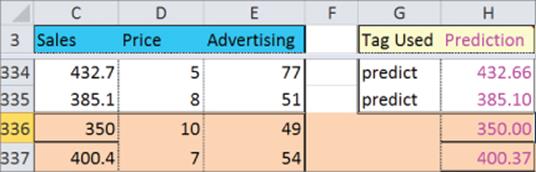
To create forecasts for new data, you simply enter the values of Price and Advertising below the original data and copy down the formula in Column H. Figure 15.9 shows the forecasts for two new data points. Note that the forecasts are extremely accurate.
Figure 15-9: New forecasts of sales
Using NeuralTools to Forecast Airline Miles
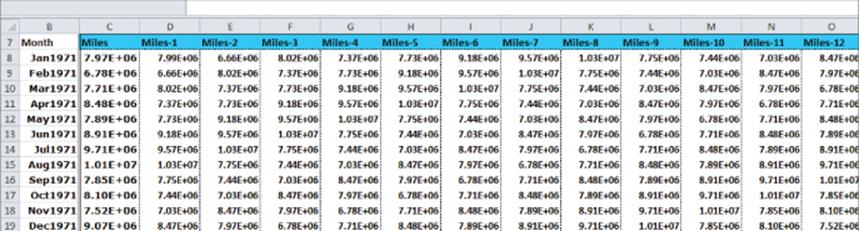
In Chapter 14, “Winter's Method,” you used Winter's Method to forecast airline miles. You can also use neural networks to forecast U.S airline miles (in thousands) from the last 12 months of airline miles. Use the data from the workbook neuralnetsairlinemiles.xlsx to make this prediction. A subset of the data is shown in Figure 15.10.
Figure 15-10: Airline miles data
You first run a multiple linear regression to predict Column C from Columns D through O. You can see that in Column D of the regression worksheet this returns a MAD (Mean Absolute Deviation, which is the average of the absolute forecast errors) of 961,855. After running NeuralTools you find that the neural net yields a MAD of 497,000. To compute the MAD you simply average over all observations the absolute value of (Actual miles - Neural Network prediction). Note that the neural net has one-half the average error of the multiple regression and yields more accurate forecasts.
Whenever you are using a neural net and you find that it yields forecasts that are not much better than a multiple regression, this tells you that the multiple linear regression is just about as good as any other functional relationship, and you are justified in modeling the relationship between the dependent and independent variables as a linear relationship.
Summary
In this chapter you learned the following:
· You can use neural networks to search for a nonlinear relationship that best explains the relationship between a dependent variable and a set of independent variables.
· Neural nets have been used to forecast stock prices, sales of consumer packaged goods, and even to drive a car!
· The Palisades add-in, NeuralTools, makes it easy to fit a neural set to data.
· If the MAD for the testing set is far larger than the MAD for the training set, then the neural net is overfitting the data and should not be used for forecasting.
· If the MAD for a neural net is not much better than the MAD for a multiple linear regression, then you can be confident that the relationship between the dependent and independent variables can be accurately modeled as a linear relationship.
Exercises
1. What independent variables and dependent variables would be used to train a neural network that can drive a car? Hint: Assume the car has video cameras that can see in front of, in back of, and to the side of the car.
2. The file windchill.xlsx gives the wind chill index (a measure of the danger from wind and temperature) for a variety of winds and temperatures. Use a neural network to predict the wind chill index based on temperature and wind speed. How much better is the neural network at predicting wind chill than a multiple linear regression?
3. The file movierevenue.xls gives revenue for several movies during weeks 1 and 2 of release as well as their total revenue. Use a neural network to predict total revenue from week 1 and week 2 revenues.
4. For the neural network you found in Problem 3, predict total revenue for the following two movies:
(a) Movie 1: Week 1 revenue $50 million; Week 2 revenue $50 million
(b) Movie 2: Week 1 revenue: $80 million; Week 2 revenue $20 million
Note that both movies made a total of $100 million during their first two weeks of release. Why is your prediction for total revenue from Movie 2 higher than your predicted revenue for Movie 1?
5. The file Quarterly.xlsx discussed in Chapter 14 gives quarterly revenues and quarterly profits for several U.S. companies. Use a neural network to predict next quarter's revenues based on the last eight quarters.
All materials on the site are licensed Creative Commons Attribution-Sharealike 3.0 Unported CC BY-SA 3.0 & GNU Free Documentation License (GFDL)
If you are the copyright holder of any material contained on our site and intend to remove it, please contact our site administrator for approval.
© 2016-2026 All site design rights belong to S.Y.A.