Marketing Analytics: Data-Driven Techniques with Microsoft Excel (2014)
Part V. Customer Value
Chapter 19: Calculating Lifetime Customer Value
Chapter 20: Using Customer Value to Value a Business
Chapter 21: Customer Value, Monte Carlo Simulation, and Marketing Decision Making
Chapter 22: Allocating Marketing Resources between Customer Acquisition and Retention
Chapter 19. Calculating Lifetime Customer Value
If a company continually spends more money to acquire customers than a customer generates, the company often goes out of business. Therefore, it is important to calculate a customer's lifetime value and use these calculations to increase the company's profitability.
For instance, in October 2009, Groupon offered its first deal. For $13 (one half the normal price of $26) a customer could purchase two pizzas from the Chicago Motel Bar pub. Groupon took one half of the $13 and gave Motel Bar one half of the $13. On average the variable cost of a pizza is approximately 35 percent of the pizza's retail price. Motel Bar received $6.50 for pizza that had a variable cost of $9.10. At first glance it seems that Motel Bar would lose $2.60 for each customer who took the Groupon deal; however, Motel Bar understood that the Groupon deal might bring in new customers who would earn Motel Bar a significant future profit that would more than make up for the $2.60 on the customer's first pizza purchase. If the merchants using Groupon did not understand the importance of the long-term value generated by a customer, then Groupon would have never existed.
In this chapter you learn how to easily estimate a customer's lifetime value and use estimates of lifetime value to justify important business decisions. You will see how the concept of customer value could have been used to economically justify DIRECTV's decision to save the author's favorite TV show, Friday Night Lights. Finally, you see how to estimate (based on the customer's past purchase history) the probability that a customer is still active.
Basic Customer Value Template
You can use a Customer Value template to easily estimate the value of a customer. To do so, first assume that each year a customer generates a $1 profit margin. Keep in mind the two following parameters:
· Per period discount rate (typically 10 percent to 16 percent per year): An annual discount rate of 10 percent means, for example, that $1 received a year from now is equivalent to 1/1.10 dollars received today. Most analysts use i to denote the per period discount rate.
NOTE
The discount rate and retention rate must refer to the same length of time. For example, if an annual retention rate is used, then an annual discount rate must be used.
· Per period retention rate: A retention rate of 60 percent per year means that during any year you lose 40 percent of the customers and you retain 60 percent of your customers. The quantity 1– retention rate is known as the churn rate. Most analysts let r = retention rate.
Following the work of Gupta and Lehmann in Managing Customers as Investments (2005, Pearson Prentice-Hall), you will learn how to use the discount and retention rates to calculate the customer value multiplier. A multiplier of 4 means, for example, that a customer's long-term value is four times the profit she generates during the first period. To determine a customer value multiplier, you can begin (see worksheet basic model of workbook customervalue.xls) in first period with an arbitrary number of customers. (Choose 100 for convenience.) Assume the following:
· A fraction (1– retention rate) of the customers is lost each period. The fraction of customers lost each period is known as the churn rate.
· The customer generates the same profit margin each year.
· The number of periods considered is limited to 360. Even if a period is a month, this covers 30 years. As churn and discount rate effects are compounded, the per period value of an initial customer becomes small after this number of periods, so you can neglect it.
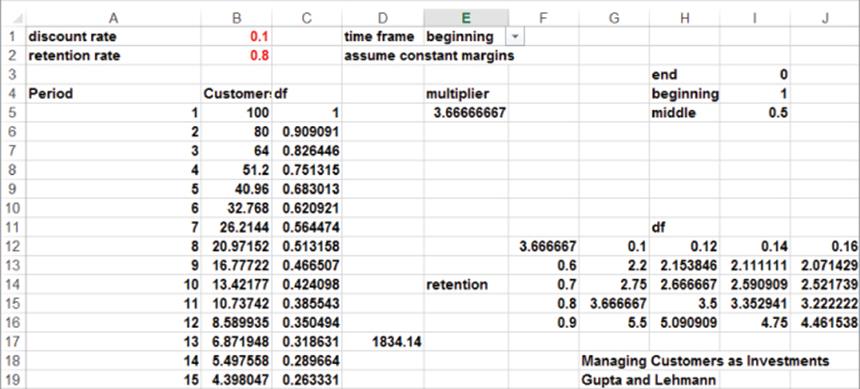
If you move the cursor to cell E1 (refer to Figure 19.1) you see a Data Validation drop-down box, which enables the user to determine if you assume profits are generated at the end, beginning, or middle of a period. If the time period is a month or shorter, then selecting the end, beginning, or middle of the period is of little importance. The drop-down box shows up whenever you click in cell E1. To create this drop-down box, perform the following steps:
1. Place the cursor in cell E1, and from the Data tab, select Data Validation.
2. From the Settings tab, select the List option; then select the cell range H3:H5 as the source.
3. In cell B5 determine the number of customers generating profits during the first period:
· 100 for beginning of year
· 100*( 1– retention rate) for end of year)
· .5*100*(1+ retention rate) for middle of year)
4. Copy the formula B5*retention_rate from B6 to B7:B360 to generate the number of customers for periods 2–360. For example, if you assume beginning-of-year profits, then in period 2 you can retain 80 percent of the customers and have 80 customers left; in period 3 you can retain 80 percent of the 64 customers and have 51.2 customers left.
5. Copy the formula =(1/(1+discount_rate)^A5)*(1+discount_rate)^(VLOOKUP($E$1,lookdis,2,FALSE))from C5 to C6:C364 to generate the discount factor for each year. For example, during year 1 if the annual discount rate is 10 percent then the following are true:
· End-of-year discount factor for year 1 is 1/1.10.
· Beginning-of-year discount factor for year 1 is 1.
· Middle-of-year discount factor for year 1 is ![]() .
.
6. In cell E5 use the formula =SUMPRODUCT(C5:C364,B5:B364)/100 to compute the multiplier by summing up for each period (# of customers left)*(discount factor) and dividing by beginning number of customers.
Figure 19-1: Customer Value template with constant margins
Measuring Sensitivity Analysis with Two-way Tables
Every model has inputs (In the current model the discount rate and retention rate are the inputs.) and output(s). (In the current model the output is the multiplier.) Sensitivity analysis of a model involves determining how “sensitive” model outputs are to changes in model inputs. Sensitivity analysis is important because estimates of the model inputs may be wrong, so you need to have an idea how errors in your input estimates will affect the model's outputs. This can be accomplished by using Excel's best sensitivity tool, the Data Table. In particular, a two-way Data Table enables you to determine how any formula (in this case the multiplier) varies as two inputs (retention n rate and discount rate) are changed. To create the two-way data table, perform the following steps:
1. Begin by listing values of the retention rate (0.6–0.9) in the range F13:F16, and list values of the other input (discount rate) in the range G12:J12.
2. Place in the upper-left corner (cell F12) the output formula. The output formula is simply the multiplier (=E5).
3. Select the table range as F12:J16. Then from the Data tab, choose What-If Analysis and select Data Table ....
4. Select the column input cell as B2 and row input cell as B1. Press OK.
Excel places each retention rate in B2 and each discount rate in B1. For each combination of retention rate and discount rate, Excel computes the output cell (the multiplier.) For example, a 10 percent discount rate and 60 percent retention rate yields a multiplier of 2.2, but a 10 percent discount rate and 90 percent discount factor yields a multiplier of 5.5. This shows the importance of increasing the retention rate!
NOTE
The concept of customer value took off after Frederic Reichfeld pointed out that for a credit card company, an increase in an annual retention rate from 80 percent to 90 percent could double the multiplier (see Loyalty Effect, Reichfeld and Teal, 2001).
An Explicit Formula for the Multiplier
If you assume the per-period profit generated by a customer does not depend on how long he has been a customer, you simply compute the value of the customer as:
![]()
Therefore, suppose the annual retention rate for cable TV subscribers is 80 percent and the annual discount rate is 10 percent. Assuming end-of-year cash flows, the multiplier is 3.666667. Assuming an annual profit margin of $300, a customer's value would equal ($300)*(3.666667) = $1,100.
Now take a closer look at the multiplier. Let i = per period discount rate and r = per period retention rate. If you assume that for an infinite number of periods each customer generates $1 of profit at the beginning of each period, then you can derive an explicit formula for the multiplier. If you begin period 1 with a single customer, then at the beginning of period 1, you receive $1 from one customer; at the beginning of period 2, you receive $1 from r customers; at the beginning of period 3, you receive $1 from r2 customers, and so on. Discounting these profits by 1 / (1 + i) during period 2, 1 / (1 + i)2 during period 3, and so on results in the total profit generated by your initial customer, which may be written as Equation 1:
1 ![]()
Multiplying Equation 1 by r / (1 + i) yields Equation 2:
2 ![]()
Subtracting Equation 2 from Equation 1 yields (1 + i − r) / (1 + i) * Multiplier = 1 or Equation 3:
3 ![]()
Varying Margins
Lehmann and Gupta make a persuasive case that if the retention rate varies with the length of tenure, using an overall average retention rate is sufficient to accurately estimate customer value. For example, if for newer customers the initial retention rate is 70 percent, and in later years retention rate trends to 90 percent, an average retention rate (See Exercise 5 for an example of how to compute a retention rate.) of approximately 80 percent can be used to accurately estimate the multiplier.
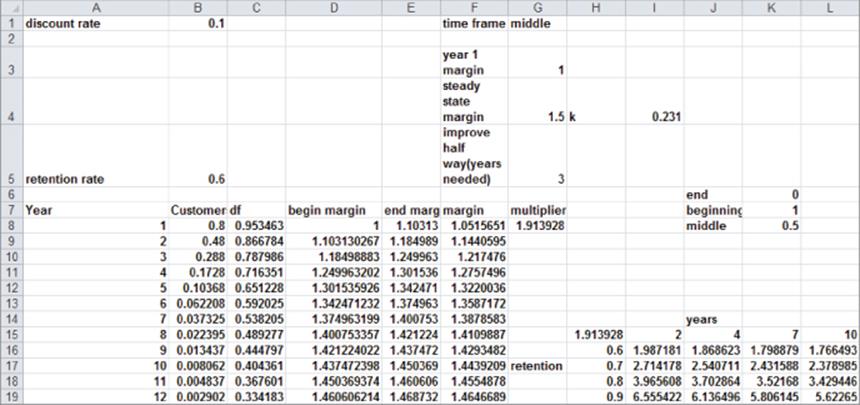
In many cases, however, customer margins tend to increase with the length of a customer's tenure. You can see this occur in the growing margins worksheet (also see Figure 19.2). To handle growing customer margins, values are needed for the following three parameters.
· Year 1 margin per customer: This is the margin at the beginning of year 1, say, $1 in this case.
· Steady state margin per customer: This is the per period profit margin for a customer who is with the company for a long period of time. Assume the steady state margin increases from $1 to $1.50.
· Periods until margin per customer is halfway to the steady state margin ($1.25). Call this T*. Now assume that T* = 3 periods.
Figure 19-2: Customer Value template with increasing margins
Using these parameters, you can compute year n margin as follows:

Here k = − Ln(0.5) / T* = − .69 / T*. Thus for T* = 3, k = 0.231.
Now assume you measure the number of customers and margins mid-year. Copy the formula =year_1_margin+(steady_state_margin-year_1_margin)*(1-EXP(−k*(A8-1))) from D8 to D9:D367 to compute the beginning of period margin. Then copy the formula =year_1_margin+(steady_state_margin-year_1_margin)*(1-EXP(−k*(A8))) from E8 to E9:E367 to compute the end-of-period margin. Column F averages these two numbers to obtain a mid-period margin.
As with the constant margins example, it is very important to verify how robust the multiplier is to varying inputs. In the varying margins example, one of the most relevant issues is to estimate how customer value changes if the firm keeps the customer over different lengths of time. Figure 19.2displays a two-way data table that shows how varying the retention rate and speed of margin change (measured by T*) influences the Customer Value multiplier. As T* increases margins increase more slowly, and the customer value multiplier decreases (but not by a large amount).
DIRECTV, Customer Value, and Friday Night Lights (FNL)
As previously mentioned, the author's favorite TV show was Friday Night Lights (FNL). Although ostensibly a sports show, FNL did a terrific job of showing how everyday people struggle with everyday problems and overcome these problems that are often not of their own making. During the 2006–2007 and 2007–2008 TV seasons, FNL struggled with low ratings on NBC and was about to be canceled when DIRECTV stepped in and saved the show. This enabled FNL to run for three more seasons, which were capped by Kyle Chandler's (Coach Taylor) Emmy® for Best Actor and an Emmy for Best Episode (the show's final episode “Always”). DIRECTV agreed to split production costs with NBC, and DIRECTV obtained the rights to run the show in the fall before NBC ran it during the following spring. In explaining DIRECTV's move, Executive Vice President Eric Shanks spoke about their acquisition:
We have exclusive content around sports with the NFL, college basketball and NASCAR. Why can't that same model work with entertainment? Why can't we go out and get exclusive entertainment properties and use that as a differentiator as well? If fans are passionate enough to ditch cable and come to DIRECTV, we can help keep shows alive.
It costs $2 million to produce an episode of FNL. DIRECTV split the cost with NBC; saving FNL costs DIRECTV $13 million per year. Using your knowledge you can estimate the value of a new subscriber and reverse engineer the number of new subscribers needed to cover the $13 million cost to DIRECTV. The work for this exercise is in the file DirecTV.xls.
NOTE
According to an article on FNL and DIRECTV (http://fueled.com/blog/the-end-of-friday-night-lights-and-how-directv-saved-it/), DIRECTV hoped that showing FNL would generate tens of thousands of new subscribers.
The following information is from DIRECTV's 2008 annual report:
· Monthly churn rate .0151 implies that the chance of retaining a customer for a year is (1 – .0151)12 = .8331.
· Operating profit = $2.4 billion
· Subscribers 16.8 million
· Acquisition Costs $1.9 billion
Now assume (conservatively) that all other DIRECTV costs are variable costs. Then conservatively, a new subscriber would generate (after acquisition costs) at least 4.3 billion/16.8 million = $255 per year in profits. If you assume an annual discount rate of 10 percent mid-year profits and the annual retention rate of .8331, you find a multiplier of 3.60 and can estimate a customer lifetime value of 3.6($255) = $920. Therefore, to recoup the annual production costs of $13 million, FNL would need to create 13,000,000/920 = 14,100 new subscribers. Because FNL averages approximately 6 million viewers per week on NBC, you can see why DIRECTV thought saving the show was a worthwhile investment. Of course, there were other benefits such as a perception that DIRECTV supports “quality TV.” Your analysis assumes that new customers generated by FNL would generate the same profit as current customers. DIRECTV may have actually thought FNL would generate more affluent customers who spend more on sports packages and movies than the typical subscriber.
Estimating the Chance a Customer Is Still Active
A marketing analyst is often given a list of customers and their past purchase history. If you want to predict the company's future profits, you need to predict which customers are still active. In their article, “Counting Your Customers: Who Are They and What Will They Do Next?” (Management Science, p.33 [1987], pp. 1–24), Schmittlein, Morrison, and Colombo provide a simple method to estimate the probability that a customer is still active. The following data is needed:
· N = Number of purchases
· t = Time of last purchase
· T = Time elapsed between acquisition of customer and present time
After defining T* = t / T, the authors show that (T*)n estimates the probability that the customer is still active. For example, suppose that T = 10 and a customer has made a purchase at times 1, 5, 6, and 9. You can estimate the probability that a customer is still active to equal .94 = 0.6561. Section 5.4 of Blattberg, Kim, and Neslin's book Database Marketing (Springer, 2008) contains a more advanced discussion of recent work on determining the probability a customer is still active.
Going Beyond the Basic Customer Lifetime Value Model
Many valuable insights can be gleaned from Gupta and Lehmann's basic customer value model. Following are some ideas that can make the basic customer value concept even more useful to a 21st-century corporation.
· Not all customers generate the same customer value. Several of the author's former students have used multiple regression (see Chapter 10, “Using Multiple Regression to Forecast Sales”) to predict from information such as demographic variables the value generated by a potential customer. This enables companies to focus attention on trying to attract more profitable customers. Banks in particular can profit from this type of analysis. See http://bankblog.optirate.com/bank-and-credit-union-business-strategy-and-customer-life-time-value/#axzz266PyVmgT for more details of how banks can use the concept of customer value to increase profits.
· In addition to trying to estimate the probability that a customer is still active, the corporation wants to predict the value generated in the future by each customer. In his book Customer Lifetime Value: Foundations and Trends in Marketing (Now Publishing, 2008), V. Kumar discusses how a software manufacturer accurately predicted the future value of customers and used this information to allocate marketing resources between customers to maximize future profits.
· The sensitivity analysis of the basic customer value model showed that increasing the retention rate (or equivalently reducing churn) is a key to increasing lifetime customer value. Logistic regression (see Chapter 17, “Logistic Regression”) is a very useful tool to predict who will churn (seehttp://analyticstoday.wordpress.com/2010/03/24/churn-analytics-in-the-telecom-industry/.) Independent variables such as education level, location (rural, urban, or suburban), and customer satisfaction have been found as significant predictors of whether a customer will churn. In an interesting study (before the era of cell phone dominance), Ameritech found that the best predictor of a customer dropping their landline service was that the customer had a repair service call that did not fix the problem. Using the customer lifetime value model, Ameritech could quantify the benefits derived from improved repair service. Once you have identified customers who are likely to churn, preemptive measures (giving coupons, free gifts, etc.) can be used to prevent profitable customers from churning.
Summary
In this chapter you learned the following:
· Given the retention rate, discount rate, and profit per period generated by a customer, the customervalue.xls workbook can be used to easily compute the value of a customer.
· Given N = Number of purchases, t = Time of last purchase, T = Time elapsed between acquisition of customer and present time, and T* = t / T, (T*)n estimates the probability a customer is still active at time T.
Exercises
1. AOL bought customers from CD Now for $60 per customer. CD Now's annual retention rate was 60 percent, and customers generated $15 of profit per year. Assuming an annual discount rate of 12 percent, evaluate AOL's purchase of CD Now customers.
2. It costs Ameritrade $203 to acquire a customer. Ameritrade earned $200 per year from a customer and had an annual retention rate of 95 percent. Assuming cash flows are discounted at 12 percent, estimate the value of a customer and the net of acquisition costs.
3. Assume the annual retention rate for a cell phone subscriber is 70 percent and the customer generates $300 per year in profit. Assuming an annual discount rate of 8 percent, compute the value of a customer.
4. Each year Capital Two retains 75 percent of its customers, and the annual discount rate is 5 percent. What annual retention rate doubles the value of a customer?
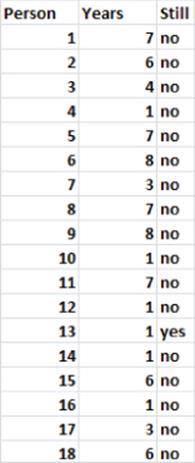
5. The file retentiondata.xlsx gives retention data on a sample of magazine subscribers. Some of this data is shown in Figure 19.3. For example, the first person was a subscriber for 7 years and is no longer a subscriber, while the 13th person has been a subscriber for one year and is still a subscriber. Use this data to estimate the magazine's annual retention rate for a customer.
Figure 19-3: Retention data for Problem 5
6. Assume a customer has been with a company for 10 years and has made purchases at times .2, 1.2, .8, and 3. Estimate the probability the customer is still active.
7. Customers 1 and 2 have been with a company for 12 months. Customer 1 has made four purchases and Customer 2 has made two purchases. Each customer's last purchase was at the end of month 8. Which customer is most likely to still be active? Can you explain this result?
8. Modify Equation 3 if $1 of profit is generated at the end, not the beginning of each period.
All materials on the site are licensed Creative Commons Attribution-Sharealike 3.0 Unported CC BY-SA 3.0 & GNU Free Documentation License (GFDL)
If you are the copyright holder of any material contained on our site and intend to remove it, please contact our site administrator for approval.
© 2016-2026 All site design rights belong to S.Y.A.