Marketing Analytics: Data-Driven Techniques with Microsoft Excel (2014)
Part V. Customer Value
Chapter 20. Using Customer Value to Value a Business
Today many companies raise money via venture capital. To raise money, you need to present a business plan that shows how your idea will generate an acceptable level of cash flow. Because a company's customers generate cash flow, a model of how a company's number of customers evolves, coupled with estimates of per customer profitability and acquisition costs, can help generate reasonable predictions for future cash flows. This chapter illustrates the customer-centric approach to valuation, often called the eyeball approach (see Exercise 4), combining it with a customer-centric model that values cash flows generated by a new health club.
A Primer on Valuation
You can model the profitability of a business as the discounted value of the cash flows generated by the business. During years in which the business receives revenue, computing cash flows requires use of the following accounting relationships:
1 
2 ![]()
3 
4 
You can compute the Net Present Value (NPV) of cash flows using the XNPV function. The syntax XNPV(annual discount rate, cash flows, dates of cash flows) computes the NPV of a sequence of irregularly spaced cash flows as of the first listed date. Some investors are interested in theIRR (Internal Rate of Return) on an investment. The IRR of a sequence of cash flows is the discount rate that makes the NPV of a sequence of cash flows equal to 0. Technical problems can arise if a sequence of cash flows has no IRR or more than one IRR.
If a sequence of cash flows begins with a negative cash flow followed by a sequence of all non-negative cash flows, the sequence of cash flows will have a unique IRR. This condition is satisfied by most new businesses, which begin with a large up-front capital investment. The syntaxXIRR(values, dates, [guess]) computes the IRR of a sequence of irregularly spaced cash flows.
NOTE
Guess is an optional argument (usually in the range -50 percent to 50 percent) that gives Excel a starting point, which is used to start the search for the IRR.
The valuation model in this chapter is based on estimating the size of a firm's customer base during each period. Equation 5 is the key to modeling the size of a firm's future customer base.
5 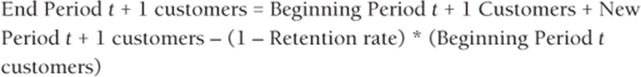
The next section provides a detailed numerical example that estimates the value of a company by combining the customer value concepts of Chapter 19, “Calculating Lifetime Customer Value” with accounting valuation concepts.
Using Customer Value to Value a Business
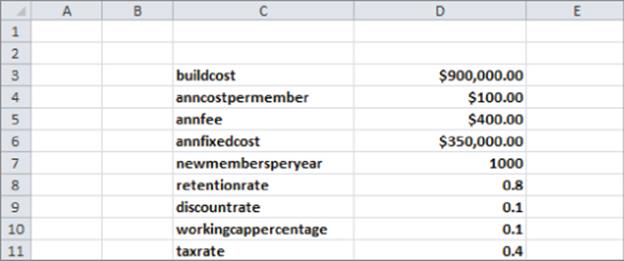
If you want to raise money to start a new business, you must present a business plan that makes a convincing case that your investors will recoup their investment. Suppose you want to start a new health club called The Iron Pit Health Club in the idyllic “small town” of Bloomington, Indiana. You have asked noted Bloomington resident John Cougar Mellencamp to invest in the project. To convince John that the health club is an attractive investment, you are going to project 10 years of cash flows. The retention rate of your members will be a crucial input into your model because if 90 percent of your members quit each year, it is unlikely that the health club will be profitable. The assumptions underlying this valuation analysis are summarized in the following list, also shown in Figure 20.1:
· It will cost $900,000 in capital expense (incurred on 1/1/2014) to build the health club and buy equipment. This capital expense will be depreciated on a straight-line basis for 10 years: 2014–2023. For simplicity you assume the $90,000 (.1 * $900,000) annual depreciation is taken mid-year on July 1.
· Variable costs of $100 per year are associated with each member.
· The annual membership fee is $400.
· Annual fixed costs of $350,000 are incurred by Iron Pit.
· 1,000 new members will join each year.
· Iron Pit has an 80 percent annual retention rate.
· Working capital is 10 percent of annual revenues.
· Profits are taxed at 40 percent.
Figure 20-1: Assumptions for Iron Pit cash flow analysis
As shown in Figure 20.2, the file Ironpit.xlsx contains the calculations of 10 years of cash flows.
Figure 20-2: Iron Pit cash flow analysis
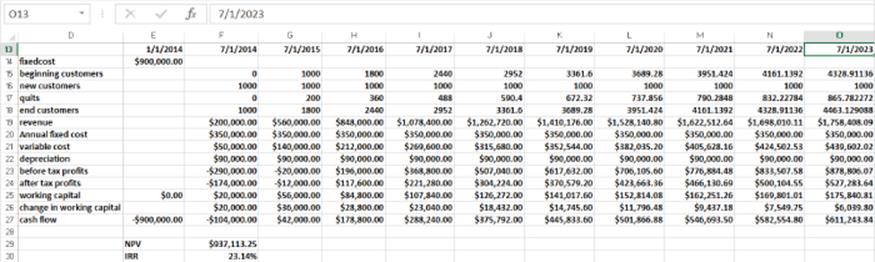
To create this spreadsheet, perform the following steps:
1. In cell E14 enter the fixed cost of $900,000.
2. In cell F15 enter a 0 indicating you have 0 initial customers.
3. Copy the formula =newmembersperyear from F16 to G16:O16 to enter each year's number of new customers.
4. Copy the formula =(1-retentionrate)*F15 from F17 to G17:O17 to compute the number of customers churning each year.
5. Copy the formula =F18 from G15 to H15:O15 to enter each year's beginning number of customers.
6. Copy the formula =0.5*annfee*(F15+F18) from F19 to G19:O19 to compute Iron Pit's annual revenue based on averaging each year's beginning and ending customers.
7. Copy the formula =0.5*annfixedcost from F20 to G20:O20 to enter each year's annual fixed cost.
8. Copy the formula =0.5*(F15+F18)*anncostpermember from F21 to G21:O21 to compute each year's variable cost.
9. Copy the formula =buildcost/10 from F22 to G22:O22 to compute each year's depreciation.
10. Copy the formula =F19-F20-F21-F22 from F23 to G23:O23, and use equation (20.1) to compute each year's before tax profits.
11. Copy the formula =(1-taxrate)*F23 from F24 to G24:O24 and use Equation 2 to compute each year's after-tax profits. Assume Iron Pit is part of a profitable corporation, so even though the 2014 before-tax profit is negative, Iron Pit's loss can contribute a tax shield to the rest of the company.
12. In cell E25 enter an initial working capital level of 0. Copy the formula =workingcappercentage*F19 from F25 to G25:O25 to compute each year's working capital.
13. Copy the formula =F25-E25 from F26 to G26:O26 to compute each year's change in working capital.
14. In cell E28 compute the cash flow due to the initial capital costs with the formula =-E14.
15. Copy the formula =F24-F26+F22 from F27 to G27:O27-and use Equation 4 to compute each year's cash flow.
16. In cell F29 compute the NPV of all cash flows (as of 1/1/2014) with the formula =XNPV(discountrate,E27:O27,E13:O13). Given your assumptions, your health club will generate a cash flow of $4,924,240.41.
17. In cell F30 compute the IRR of the health club's cash flows with the formula =XIRR(E27:O27,E13:O13). Your assumptions yield an IRR of 61.6 percent. This means that the current assumptions imply that John's investment would earn a 61.6 percent annual return.
This analysis shows that for the given assumptions, the health club will yield a great rate of return on investment within a relatively short 10 year period. Of course, the assumptions may be wrong, so you will next examine how large an error in your assumptions will compromise the attractiveness of the health club investment.
Measuring Sensitivity Analysis with a One-way Table
Recall from Chapter 19 that the sensitivity analysis of a model involves determining how “sensitive” model outputs are to changes in model inputs. Of course, John Cougar Mellencamp realizes that the assumptions may not actually pan out. Anticipating John's objection, you can use a one-way Data Table (see Figure 20.3) to determine the sensitivity of Iron Pit's NPV and IRR to the annual retention rate. In Chapter 19 you used a two-way table to measure sensitivity analysis, but you only need a one-way table here because you are varying a single parameter. To create the one-way Data Table, proceed as follows:
1. In the cell range J3:J9 enter reasonable values for the health club's retention rate. (You can choose 70 percent–95 percent.) These values might be derived from the annual retention rates experienced by other health clubs.
2. A one-way Data Table can have more than one output cell. The output cells for a one-way Data Table are listed beginning one row above the first input value and one column to the right of the input values. Your two output cells will be the health club's NPV (enter in cell K2 with the formula =F29) and the health club's IRR (enter in cell L2 with the formula =F30).
3. Select the table range (J2:L10), which includes the input values, output cell formulas, and the range where the Data Table places its calculations.
4. From the Data tab on the ribbon, select What If Analysis from the Data Tools group and then select Data Table .... In a one-way table there is no row input cell because no input values exist in the first row of the table. Because the values in the first column of the table range are retention rates, choose D8 as the column input cell.
5. Click OK and you see the one-way Data Table shown in Figure 20.3.
Figure 20-3: Iron Pit sensitivity analysis
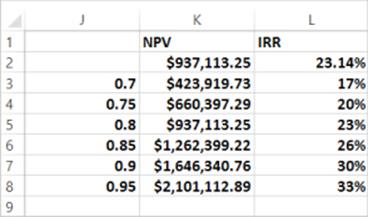
You find, for example, that increasing the annual retention rate from 70 percent to 90 percent doubles the NPV of Iron Pit and increases the IRR from 17 percent to 33 percent. This Data Table shows that even if the retention rate were a relatively low 70 percent, the investment would still be a good one. This sensitivity analysis should make John feel much better about investing in Iron Pit.
Using Customer Value to Estimate a Firm's Market Value
Gupta and Zeithaml (Marketing Science, 2006, pp. 718–739) used a customer-centric approach similar to the Iron Pit analysis to value the future cash flows generated by Amazon.com, TD Ameritrade, Capital One, eBay, and E*TRADE. Their method parallels the Iron Pit analysis (see Exercise 3 for an example). Their method closely approximated the actual market values of E*TRADE, Ameritrade, and Capital One. Rust, Lemon and Zeithaml (Journal of Marketing, 2004, pp. 109–126) used a customer value approach to estimate the value of American Airlines and found their value came close to American Airlines' actual market value.
The key to both these papers was the method used to model the evolution of each company's number of customers. The authors used S curves (see Chapter 26, “Using S Curves to Forecast Sales of a New Product”) to model the evolution of each firm's customers.
Summary
In this chapter you learned the following:
· A firm's customers drive the firm's revenues and profits. Therefore, if you can build a model that accurately generates a firm's number of customers, you can model the firm's future cash flows and estimate the firm's value. Key relationships used in this type of model include the following equations:
(1) Before-Tax Profits = Revenues – (Variable and Nondepreciated Costs) – Depreciation
(2) After-Tax Profits = (1 – Tax Rate) * Before-Tax Profits
(3) Working Capital = Current Assets – Current Liabilities will be modeled as a fixed percentage of revenue.
(4) Cash Flow = After-Tax Profits + Depreciation – Change in Working Capital
(5) End Period t + 1 Customers = Beginning Period t + 1 Customers + New Period t + 1 Customers – (1– Retention rate) * (Beginning Period t Customers)
· The Excel XNPV and XIRR functions can determine the NPV or IRR of a stream of irregularly spaced cash flows.
Exercises
1. Assume that for N years the number of new customers will grow at G percent per year, and thereafter the number of new customers will drop by D percent per year. Modify the Ironpit.xlsx file to incorporate this customer dynamic.
2. Modify the Ironpit.xlsx analysis to incorporate an annual growth rate in membership fees, annual fixed cost, and annual costs per customer.
3. A nice way to value new companies is to say Company Value = NPV of customer value from all current and future customers. Gupta and Lehmann (2006) used this approach to value Amazon.com as of March 2002. Using a method (S curves) (to be discussed in Chapter 26, “Using S Curves to Forecast Sales of a New Product”), they projected the total number of customers N(t) to have tried Amazon.com by the end of month t to be as given in file newamazondata.xls. In this file t = 1 is March 1997 and so on. For example, through the end of March 1997, 1.39 million people had tried Amazon.com; through April 1997, 1.81 million people had tried Amazon.com and so on.
You are given the following information (as of March 1997):
· Cost of acquiring customer: $7.70
· Monthly profit margin from customer: $1.29
· Tax rate: 38 percent
· Annual retention rate: 70 percent
· Costs and revenues grow at 2.5 percent annually.
· Discount profits at 10 percent per year
(a) Assume the profit during the month is based on the ending number of customers. Use this information to get a value of Amazon.com as of March 2002. Market value at the beginning of March 2002 was $5.4 billion. For each month you might have the following columns:
· N(t) = Total number of customers who have tried Amazon.com by end of month t
· Quits = Number of customers leaving Amazon.com during each month
· New customers
· Ending customers
· Acquisition costs
· Profit margin
· After-tax profits
(b) Run 420 total months (35 years) and determine whether you believe that at the beginning of March 2002 Amazon.com was fairly valued.
4. Why do you think that our customer-centric approach to valuation is often called the eyeball approach?
5. For the Iron Pit example, suppose that during year 1 Iron Pit would gain 2,000 new customers, but each year the number of new customers dropped 10 percent. Would this increase or decrease the attractiveness of the investment?
6. In your analysis of Iron Pit, you assumed the annual fee was $400. How would you determine whether the assumed $400 annual fee was appropriate?
7. Use a one-way Data Table to analyze how sensitive the attractiveness of the investment is to a change in the assumption that working capital = 10 percent of annual revenue.
All materials on the site are licensed Creative Commons Attribution-Sharealike 3.0 Unported CC BY-SA 3.0 & GNU Free Documentation License (GFDL)
If you are the copyright holder of any material contained on our site and intend to remove it, please contact our site administrator for approval.
© 2016-2026 All site design rights belong to S.Y.A.