Marketing Analytics: Data-Driven Techniques with Microsoft Excel (2014)
Part VIII. Retailing
Chapter 29: Market Basket Analysis and Lift
Chapter 30: RFM Analysis and Optimizing Direct Mail Campaigns
Chapter 31: Using the SCANPRO Model and Its Variants
Chapter 32: Allocating Retail Space and Sales Resources
Chapter 33: Forecasting Sales from Few Data Points
Chapter 29. Market Basket Analysis and Lift
Many retailers use scanners to create data that lists (among other things) the items purchased by each customer on a given transaction. This data often can be mined for useful information that can lead to increased profits. For example, Bloomingdale's found that women who purchased cosmetics often bought handbags, which led to their decision to place handbags and cosmetics together in an attempt to increase total store sales. In this chapter, you study how to use market basket analysis to identify pairs or sets of products that customers tend to purchase together and how this knowledge can help the retailer increase profits. You'll then learn how to use the Evolutionary Solver to both ease the computational burden of finding products that tend to be purchased together and to lay out a store so that products with high lifts are located near each other to optimize sales.
Computing Lift for Two Products
On a given visit to a store, a consumer's market basket is simply the list of products purchased by the customer. Market basket analysis is therefore concerned with extracting information from consumers' market baskets that can be used to increase a retailer's profit. Most of the time, market basket analysis draws actionable insights after looking at the association between products bought during a given transaction. For example, for most supermarket customers there is a positive association between the purchases of cereal and bananas because a shopper who purchases cereal is more likely than a typical shopper to purchase bananas.
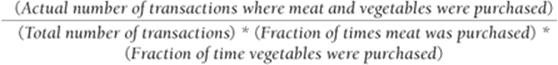
Lift is probably the most commonly used tool in market basket analysis. The concept of lift enables the analyst to easily identify combinations of items (like handbags and makeup or cereal and bananas) that tend to be purchased together. The lift for a combination of purchase items and/or day of week is defined by Equation 1:
1 ![]()
A two-way product lift therefore is simply a lift involving two products and can easily be computed in Excel. It can be generalized to situations involving the computation of lifts involving more than two items or other transaction attributes (such as day of week).
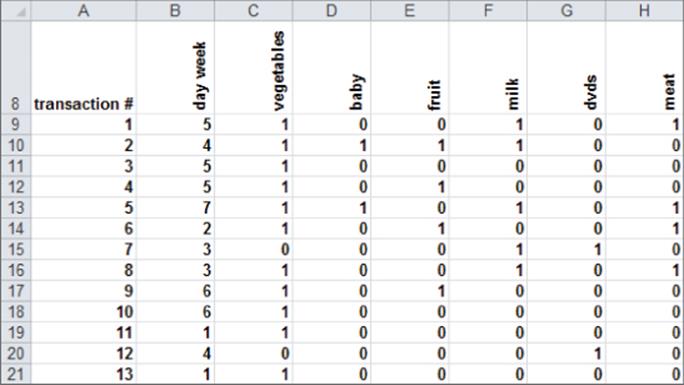
To practice computing lift, you'll use the superstore transaction data in the file marketbasket.xls. Figure 29.1 shows a subset of the data. The day of the week is denoted by 1 = Monday, 2 = Tuesday … 7 = Sunday. For example, the first transaction represents a person who bought vegetables, meat, and milk on a Friday.
Figure 29-1: Market basket data
For the superstore data, the lift for meat and vegetables would equal:
To be more specific, suppose that in 1,000 transactions, 300 involved a meat purchase, 400 involved a vegetable purchase, and 200 involved a purchase of meat and vegetables. Independence of meat and vegetable purchases implies that the likelihood of a transaction involving meat is 0.30 irrespective of a transaction involving a vegetable purchase. Thus independence implies that 1,000 (0.40) (0.30) = 120 transactions should involve purchase of meat and vegetables. Because 200 transactions involved a purchase of meat and vegetables, knowing that a transaction involves meat makes it 1.67 times (200/120) more likely that a transaction involves vegetables. This is consistent with Equation 1, which tells you that the lift for vegetables and meat is
![]()
Product combinations with lifts much greater than 1 indicate items tend to be purchased together. This is valuable information for the retailer because placing products with large lifts near each other in a store display can increase sales based on the assumption that the sales of one product will stimulate sales of the other product. Because handbags and makeup have a large lift, this explains why Bloomingdale's placed handbags and makeup together.
Promoting cross-selling of products with high lifts can also stimulate profits. Therefore, in the Bloomingdale's example, giving a customer who purchases at least $50 of makeup a coupon for 20 percent off a handbag would likely yield increased profits.
Creating Named Ranges
Returning to the superstore data, you can now try to find the lift for all two-product combinations. Before you begin computing all these lifts, though, it is convenient to create a few named ranges. You can use the Name box to assign the name data to the range B9:H2936, which contains all the transactions. Simply select the range B8:H296 and choose INSERT NAME CREATE to name each column of data by its heading. For example, you can call Column B day_week, Column C vegetables, and so on (refer to marketbasket.xls file for the rest of the heading names).
Now perform the following steps to determine the fraction of all transactions involving each type of product and the fraction of transactions taking place on each day of the week. This information is needed to compute the denominator of 1.
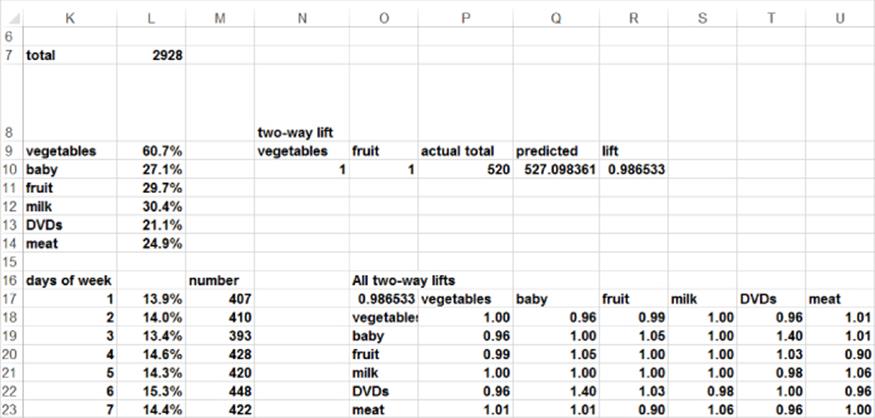
1. In cell L7 compute the total number of transactions with the formula =COUNT(B:B). This formula counts how many numbers occur in Column B, which gives you the number of transactions.
2. Copy the formula =COUNTIF(INDIRECT(K9),1)/$L$7 from L9 to cells L10:L14 to compute the fraction of transactions involving each product. Recall that COUNTIF counts the number of entries in a range matching a given number or text string (in this case 1). Any cell reference within anINDIRECT function is evaluated as the contents of the cell. Thus INDIRECT(K9) becomes vegetables. This enables you to copy your COUNTIF statement and pick off the range names. A neat trick! Thus 60.7 percent of all transactions involve vegetables, and so on.
3. Copy the formula =COUNTIF(day_week,K17)/COUNT(day_week) from L17 to L18:L23 to determine the fraction of all transactions occurring on each day of the week. For example, 13.9 percent of all transactions occur on Monday, and so on. These calculations will be used in the next section when you compute three-way lifts.
Calculating Lifts for Multiple Two-way Product Combinations Simultaneously
Now you can use a two-way data table to compute the lift for any combination of two products.
1. Enter the range names for any two products in the range N9:O9. To ease the selection of products you can use the drop-down list in cells N9 and O9.
2. In cell Q10 use the formula =IF(N9<>O9,VLOOKUP(N9,K9:L14,2,FALSE)*L7*VLOOKUP(O9,K9:L14,2,FALSE),0) to compute the predicted number of transactions involving the two products assuming independence. This formula computes the denominator of Equation 1. If you choose the same product twice, enter a 0.
3. In cell P10 use the array formula =SUM((INDIRECT(N9)=1)*(INDIRECT(O9)=1)) to compute the number of times the combination of vegetables and fruit occur together. After typing in the formula, press Control+Shift+Enter instead of just Enter. This formula creates two arrays:
· An array containing 1 whenever the entry in the vegetable column is 1 and 0 otherwise.
· An array containing 1 whenever the entry in the fruit column is 1 and 0 otherwise.
This formula causes the arrays to be pairwise multiplied and then the entries in the resulting array are added together. The pairwise multiplication yields the number of transactions involving both fruits and vegetables (520).
4. In cell R10 compute the total lift for these categories with the formula =IF(Q10=0,1,P10/Q10). If you chose the same item twice, simply set the lift to equal 1. Otherwise, divide actual occurrence of fruits and vegetables together by the predicted number of occurrences (assuming fruits and vegetables are purchased independently.)
The lift for fruits and vegetables does not indicate a lack of independence (.99 is near 1).
Taking this one step further, you can use a two-way data table to compute the lift for all two-product combinations simultaneously.
1. In cell O17 place the formula for lift (=R10) that you want to recalculate. R10 contains the lift for a generic two-product combination.
2. Select the table range O17:U23.
3. Select What-If Analysis from the Data Tools Group on the Data tab and choose Data Table ....
4. From the Data Table dialog box enter N9 as the row input cell and O9 as the column input cell.
After clicking, you now have the lift for each two-product combination (see Figure 29.2.) For example, DVDs and baby goods have a relatively large lift of 1.4.
NOTE
The lift matrix is symmetric; that is, the entry in row I and Column J of the lift matrix equals the entry in row J and Column I.
Figure 29-2: Computing lifts for market basket example
Computing Three-Way Lifts
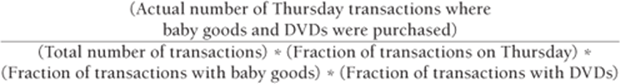
To illustrate how the concept of lift applies to three or more attributes associated with a transaction, consider calculating the lift for the purchase of baby goods and DVDs on Thursday. This lift would be computed as follows:
You can use the same concept to compute for the superstore data the lift of an arbitrary combination of two products and a day of the week. See Figure 29.3 and the Initial worksheet in the marketbasketoptimize.xls file.
Figure 29-3: Finding three-way lifts
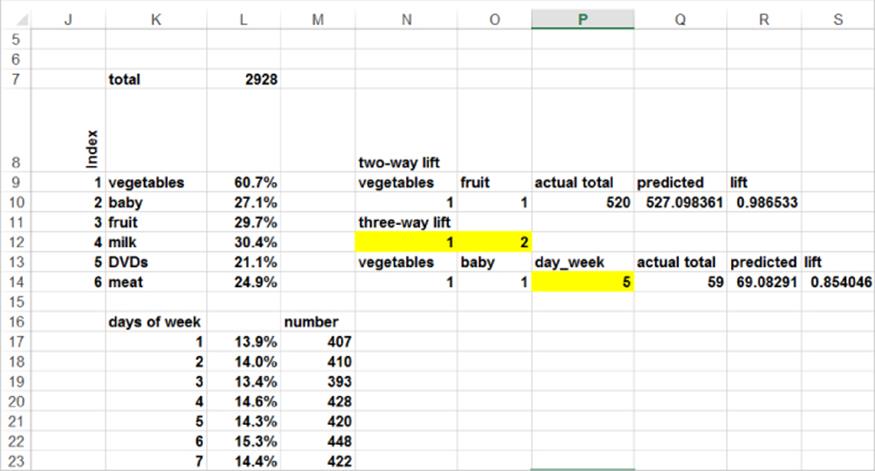
Complete the following steps:
1. In cell Q14 use the array formula =SUM((INDIRECT(P13)=$P$14)*(INDIRECT(N13)=1)*(INDIRECT(O13)=1)) to compute the actual number of transactions involving vegetables and baby goods on Friday. This formula computes three arrays:
· An array containing a 1 if the day of the week matches the number in P14 (here a 5) and a 0 otherwise.
· An array containing a 1 if the vegetables column contains a 1 and 0 otherwise.
· An array containing a 1 if the baby column contains a 1 and 0 otherwise.
2. For each row of data the array formula in Q14 creates a new array. Create the new array element in any row by multiplying the three listed arrays. A 1 is obtained in a row of the product array if and only if baby goods and vegetables were bought on Friday.
3. Sum up the entries in the product array to yield the actual number of Friday transactions where baby goods and vegetables were purchased.
4. In cell R14 compute the predicted number of transactions involving baby goods and vegetables purchased on Friday with the following formula:
IF(N13<>O13,VLOOKUP(N13,K9:L14,2,FALSE)*L7*VLOOKUP(O13,K9:L14,2,FALSE)*VLOOKUP(P14,K17:L23,2),0)
5. If you enter the same product class twice, this formula yields a 0. Otherwise, multiply (total number of transactions) * (fraction of baby transactions) * (fraction of vegetable transactions) * (fraction of Friday transactions). This gives a predicted number of Monday meat and vegetable transactions (assuming independence).
6. Finally, in cell S14, compute the lift with the formula =IF(R14=0,1,Q14/R14).
The lift for vegetables and baby goods on Friday is .85. This means that on Fridays vegetables and baby goods are bought together less frequently than expected.
Optimizing the Three-Way Lift
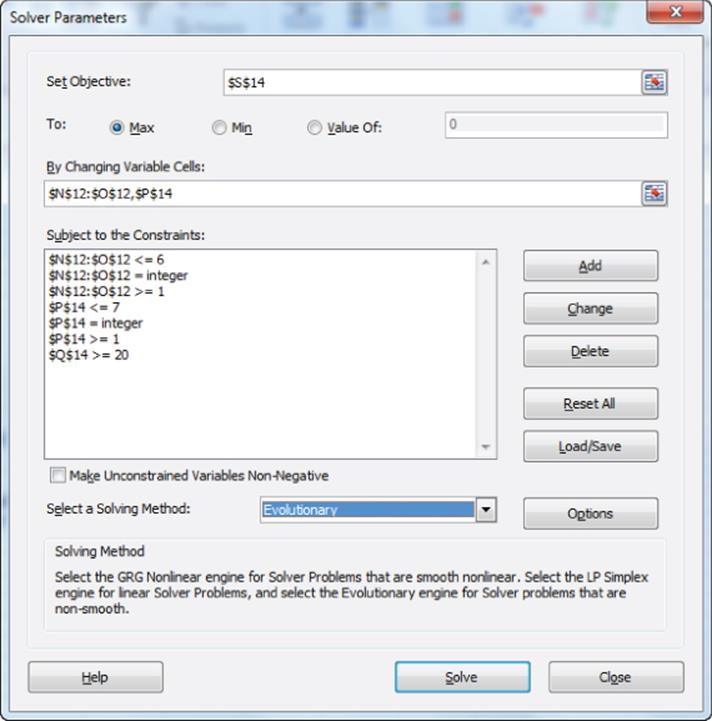
In an actual situation with many products, there would be a huge number of three-way lifts. For example, with 1,000 products, you can expect 1,0003 = 1 billion three-way lifts! Despite this, a retailer is often interested in finding the largest three-way lifts. Intelligent use of the Evolutionary Solver can ease this task. To illustrate the basic idea, you can use the Evolutionary Solver to determine the combination of products and day of the week with maximum lift.
1. Use Evolutionary Solver with the changing cells being the day of the week (cell P14) and an index reflecting the product classes (cells N12 and O12). Cells N12 and O12 are linked with lookup tables to cells N13:O13. For instance, a 1 in cell N12 makes N13 be vegetables. Figure 29.4shows the Evolutionary Solver window.
2. Maximize lift (S14), and then choose N12 and O12 (product classes) to be integers between 1 and 6. P14 is an integer between 1 and 7.
3. Add a constraint that Q14 >= 20 to ensure you count only combinations that occur a reasonable number of times.
4. Set the Mutation Rate to .5.
Figure 29-4: Solver window for maximizing three-way lift
You can find the maximum lift combination, as shown in Figure 29.5.
Figure 29-5: Maximum three-way lift
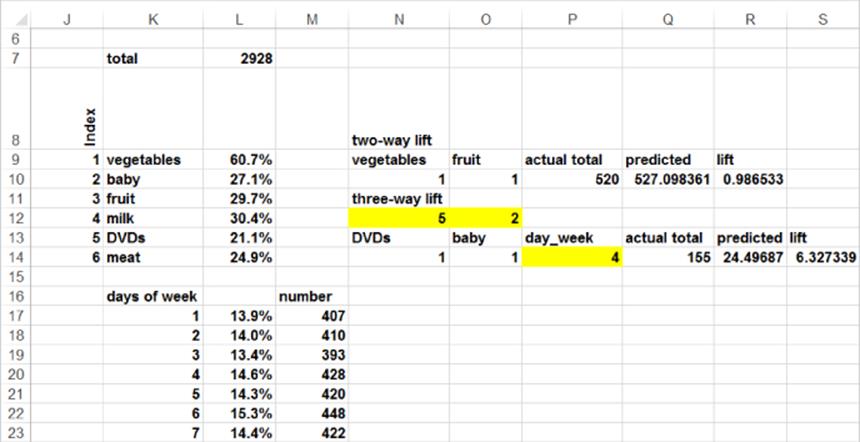
The three-way lift, as shown in Figure 29.5, indicates that roughly 6.32 times more people, as expected under an independence assumption, buy DVDs and baby goods on Thursday. This indicates that on Thursdays placing DVDs (often an impulse purchase) in the baby sections will increase profits.
A Data Mining Legend Debunked!
Most of you are probably familiar with one or more “urban legends” that are untrue but are widely believed. Two popular (and untrue) urban legends are:
· There are alligators in the New York City sewers.
· Walt Disney had his body frozen so that in the future medical science can bring him back to life.
For years a popular “data mining legend” (certainly believed by the author!) stated that Wal-Mart found that DVDs, beer, and baby goods on Friday had an incredibly large lift. The rationale for this result is that young families often “stock up for a weekend at home with their babies.” The legend then states that Wal-Mart increased profits on Fridays by placing DVDs in the baby and alcoholic beverage sections of the store. As pointed out at http://www.dssresources.com/newsletters/66.php, this story is untrue.
However, one true data mining legend appears at one of Wal-Mart's well-known competitors: As detailed at http://www.forbes.com/sites/kashmirhill/2012/02/16/how-target-figured-out-a-teen-girl-was-pregnant-before-her-father-did/, Target uses market basket analysis to spot pregnant mothers. This information is then used to send coupons for baby products to the prospective mothers. Target looks for large lifts involving women who were signed up for its baby registry. Whenever a customer uses a credit card, fills out a coupon or survey, redeems a coupon, or uses a customer help line, Target assigns the customer a Target Guest ID. Once a customer has a Guest ID Target has a record of the customer's purchases and demographic information. For women in their baby registry who have Guest IDs, Target can combine information from the two databases. Target found large lifts (during the second trimester of pregnancy) involving the purchases of unscented lotions and supplements such as calcium, magnesium, and zinc. Therefore, women who buy these product combinations are sent coupons for other products that pregnant women often purchase.
Using Lift to Optimize Store Layout
As you learned at the beginning of this chapter, handbags and makeup are often purchased together. This information led Bloomingdale's to stimulate impulse buying by placing handbags next to makeup. This suggests that to maximize revenues a store should be laid out so products with high lift are placed near each other. Given a lift matrix for different product categories, you can use the Evolutionary Solver to locate product categories to maximize the total lift of proximate product categories. To illustrate the idea, consider a grocery store that stocks the six product categories shown inFigure 29.6. In rows 8 through 13, the two-way lifts are shown. The work is in the file marketlayout.xlsx.
1. In the cell range G16:I17, determine the locations of the product categories that maximize the lifts of adjacent product categories. Assume that customers can travel only in a north–south or east–west direction. This assumption is reasonable because any two store aisles are either parallel or perpendicular to each other. This implies, for example, that location A1 is adjacent to A2 and B1, whereas location A2 is adjacent to B2, A1, and A3.
2. Enter a trial assignment of product categories to locations in cell range G16:I17.
3. In cell range G21:G26, compute the lift for adjacent products for each location. For example, in cell G21 the formula =INDEX(lifts,G17,G16)+INDEX(lifts,G17,H17) adds (Lift for products assigned to A1 and B1) + (Lift for products assigned to A1 and A2). This gives the total lift for products adjacent to A1. In cell G27 the formula =SUM(G21:G26) calculates the total lift generated by adjacent product categories.
4. Use the Solver window, as shown in Figure 29.7, to find the store layout that maximizes the total lift for adjacent product categories.
The target cell is to maximize the total lift for adjacent products (cell G27). The changing cells are the range G16:I17, which describe the location for each product category. The only entered constraint is G16:I17 AllDifferent. When a range of n changing cells is selected as AllDifferent, Excel knows to assign the changing cells the integers 1, 2, …, n with each value assigned exactly once. In the example, exactly one cell in the range G16:I17 is assigned one of the integers 1, 2, 3, 4, 5, and 6. This is equivalent to having Excel try out all 6! = 720 permutations of the integers 1–6. Each permutation corresponds to a store layout. You can find the maximum sum of lifts for adjacent categories equals 16.9 and the optimal store layout is summarized in the cell range K19:M20.
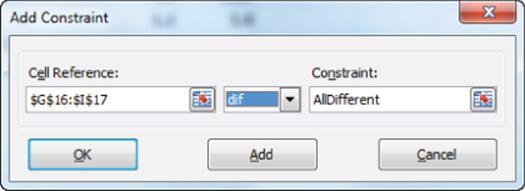
5. To make a range of changing cells AllDifferent, select Add from the right side of the Solver window, and fill in the Add Constraint dialog box, as shown in Figure 29.8.
Figure 29-6: Optimizing store layout
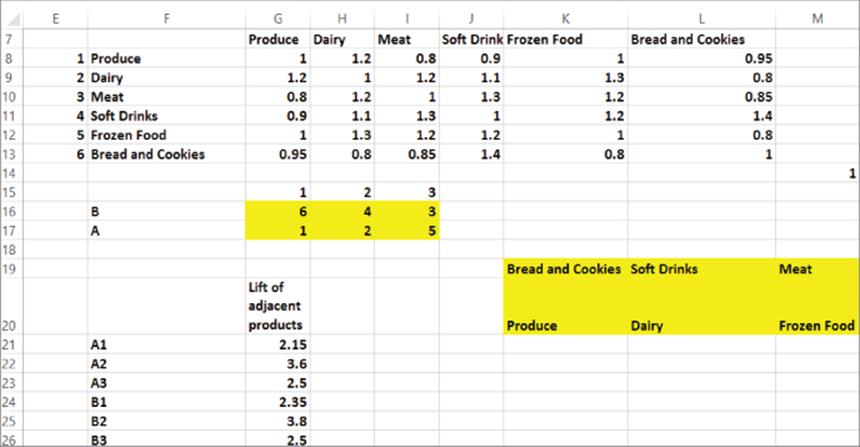
Figure 29-7: Optimizing store layout
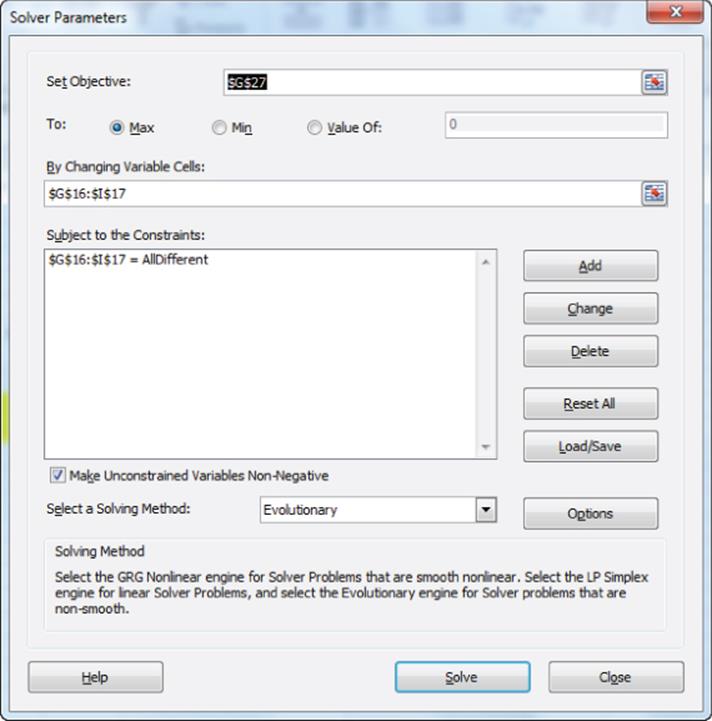
Figure 29-8: Adding AllDifferent constraints
The marketing consulting firm Design Forum (located in Dayton, Ohio) used this approach to develop store layouts for convenience stores, resulting in increased sales.
To see other ways that the concept of lift can be used to increase profits see Exercises 4–8.
Summary
In this chapter, you learned the following:
· The lift for a combination of products or other attributes is defined by:
![]()
· A larger lift (much greater than 1) for two products means, for example, that the two products are often bought together, so they should be located near each other and provide opportunities for cross-selling.
· Using the AllDifferent option for changing cells, you can use the Evolutionary Solver to determine a store layout that maximizes the lift associated with adjacent product categories.
Exercises
1. The file marketbasketdata.xls contains sales transactions at ITZIs, an upscale grocery store.
(a) Determine all two-product lifts and list the five largest lifts.
(b) Determine the largest three-product lifts.
2. For the file marketbasket.xls, find the second-largest two-product and day-of-week lifts.
3. How could Amazon.com use the concept of lift to make book or music recommendations?
4. A virtual lift includes a nonproduct element such as a demographic attribute (age, gender, income, and so on). How could a retailer use knowledge of virtual lifts to increase profits?
5. An intertemporal two-product lift looks at sales of two products at different points in time (say Product 1 at time x and Product 2 at time x + 6 months). How could an insurance company use intertemporal lifts to increase profits?
6. True Value hardware stores are considering dropping 3M's higher quality, higher priced painter's tape for the cheaper FROGTAPE. How could a 3M salesperson use market basket analysis to keep True Value from dropping 3M's painter's tape?
7. Research the reasons why Netflix created the (great!!) House of Cards TV series starring Kevin Spacey and Robin Wright. How did the concept of lift factor into Neflix's decision to make the show?
All materials on the site are licensed Creative Commons Attribution-Sharealike 3.0 Unported CC BY-SA 3.0 & GNU Free Documentation License (GFDL)
If you are the copyright holder of any material contained on our site and intend to remove it, please contact our site administrator for approval.
© 2016-2026 All site design rights belong to S.Y.A.