Excel 2016 All-in-One For Dummies (2016)
Book III
Formulas and Functions
Chapter 4
Financial Formulas
In This Chapter
![]() Using basic investment functions
Using basic investment functions
![]() Using basic depreciation functions
Using basic depreciation functions
![]() Using basic currency conversion functions
Using basic currency conversion functions
Money! There’s nothing quite like it. You can’t live with it, and you certainly can’t live without it. Many of the spreadsheets that you work with exist only to let you know how much of it you can expect to come in or to pay out. Excel contains a fair number of sophisticated financial functions for determining such things as the present, future, or net present value of an investment; the payment, number of periods, or the principal or interest part of a payment on an amortized loan; the rate of return on an investment; or the depreciation of your favorite assets.
By activating the Analysis ToolPak add-in, you add more than 30 specialized financial functions that run the gamut from those that calculate the accrued interest for a security paying interest periodically and only at maturity, all the way to those that calculate the internal rate of return and the net present value for a schedule of nonperiodic cash flows.
Financial Functions 101
The key to using any of Excel’s financial functions is to understand the terminology used by their arguments. Many of the most common financial functions, such as PV (Present Value), NPV (Net Present Value), FV (Future Value), PMT (Payment), and IPMT (Interest Payment) take similar arguments:
· PV is the present value that is the principal amount of the annuity.
· FV is the future value that represents the principal plus interest on the annuity.
· PMT is the payment made each period in the annuity. Normally, the payment is set over the life of the annuity and includes principal plus interest without any other fees.
· RATE is the interest rate per period. Normally, the rate is expressed as an annual percentage.
· NPER is the total number of payment periods in the life of the annuity. You calculate this number by taking the Term (the amount of time that interest is paid) and multiplying it by the Period (the point in time when interest is paid or earned) so that a loan with a 3-year term with 12 monthly interest payments has 3 x 12, or 36 payment periods.
 When using financial functions, keep in mind that the fv, pv, and pmt arguments can be positive or negative, depending on whether you’re receiving the money (as in the case of an investment) or paying out the money (as in the case of a loan). Also keep in mind that you want to express the rate argument in the same units as the nper argument, so that if you make monthly payments on a loan and you express the nper as the total number of monthly payments, as in 360 (30 x 12) for a 30-year mortgage, you need to express the annual interest rate in monthly terms as well. For example, if you pay an annual interest rate of 7.5 percent on the loan, you express the rate argument as 0.075/12 so that it is monthly as well.
The PV, NPV, and FV Functions
The PV (Present Value), NPV (Net Present Value), and FV (Future Value) functions all found on the Financial button’s drop-down menu on the Ribbon’s Formulas tab (Alt+MI) enable you to determine the profitability of an investment.
Calculating the Present Value
The PV, or Present Value, function returns the present value of an investment, which is the total amount that a series of future payments is worth presently. The syntax of the PV function is as follows:
=PV(rate,nper,pmt,[fv],[type])
The fv and type arguments are optional arguments in the function (indicated by the square brackets). The fv argument is the future value or cash balance that you want to have after making your last payment. If you omit the fv argument, Excel assumes a future value of zero (0). The typeargument indicates whether the payment is made at the beginning or end of the period: Enter 0 (or omit the type argument) when the payment is made at the end of the period, and use 1 when it is made at the beginning of the period.
Figure 4-1 contains several examples using the PV function. All three PV functions use the same annual percentage rate of 1.25 percent and term of 10 years. Because payments are made monthly, each function converts these annual figures into monthly ones. For example, in the PV function in cell E3, the annual interest rate in cell A3 is converted into a monthly rate by dividing by 12 (A3/12). The annual term in cell B3 is converted into equivalent monthly periods by multiplying by 12 (B3 x 12).
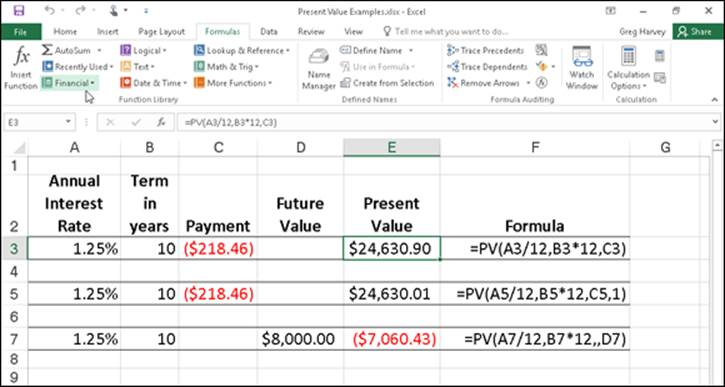
Figure 4-1: Using the PV function to calculate the present value of various investments.
Note that although the PV functions in cells E3 and E5 use the rate, nper, and pmt ($218.46) arguments, their results are slightly different. This is caused by the difference in the type argument in the two functions: the PV function in cell E3 assumes that each payment is made at the end of the period (the type argument is 0 whenever it is omitted), whereas the PV function in cell E5 assumes that each payment is made at the beginning of the period (indicated by a type argument of 1). When the payment is made at the beginning of the period, the present value of this investment is $0.89 higher than when the payment is made at the end of the period, reflecting the interest accrued during the last period.
The third example in cell E7 (shown in Figure 4-1) uses the PV function with an fv argument instead of the pmt argument. In this example, the PV function states that you would have to make monthly payments of $7,060.43 for a 10-year period to realize a cash balance of $8,000, assuming that the investment returned a constant annual interest rate of 1 1/4 percent. Note that when you use the PV function with the fv argument instead of the pmt argument, you must still indicate the position of the pmt argument in the function with a comma (thus the two commas in a row in the function) so that Excel doesn’t mistake your fv argument for the pmt argument.
Calculating the Net Present Value
The NPV function calculates the net present value based on a series of cash flows. The syntax of this function is
=NPV(rate,value1,[value2],[…])
where value1, value2, and so on are between 1 and 13 value arguments representing a series of payments (negative values) and income (positive values), each of which is equally spaced in time and occurs at the end of the period. The NPV investment begins one period before the period of the value1 cash flow and ends with the last cash flow in the argument list. If your first cash flow occurs at the beginning of the period, you must add it to the result of the NPV function rather than include it as one of the arguments.
Figure 4-2 illustrates the use of the NPV function to evaluate the attractiveness of a five-year investment that requires an initial investment of $30,000 (the value in cell G3). The first year, you expect a loss of $22,000 (cell B3); the second year, a profit of $15,000 (cell C3); the third year, a profit of $25,000 (cell D3); the fourth year, a profit of $32,000 (cell E3); and the fifth year, a profit of $38,000 (cell F3). Note that these cell references are used as the value arguments of the NPV function.
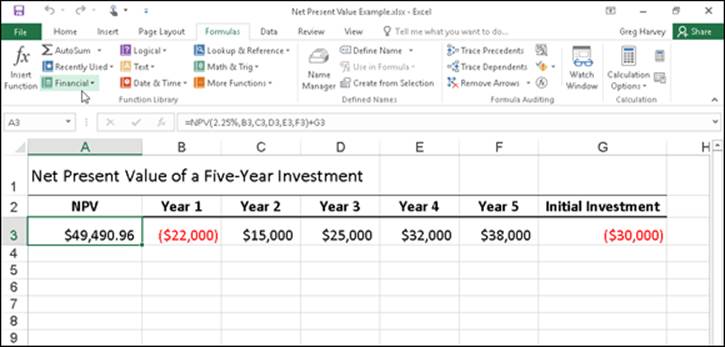
Figure 4-2: Using the NPV function to calculate the net present value of an investment.
Unlike when using the PV function, the NPV function doesn’t require an even stream of cash flows. The rate argument in the function is set at 2.25 percent. In this example, this represents the discount rate of the investment — that is, the interest rate that you may expect to get during the five-year period if you put your money into some other type of investment, such as a high-yield money-market account. This NPV function in cell A3 returns a net present value of $49,490.96, indicating that you can expect to realize a great deal more from investing your $30,000 in this investment than you possibly could from investing the money in a money-market account at the interest rate of 2.25 percent.
Calculating the Future Value
The FV function calculates the future value of an investment. The syntax of this function is
=FV(rate,nper,pmt,[pv],[type])
The rate, nper, pmt, and type arguments are the same as those used by the PV function. The pv argument is the present value or lump-sum amount for which you want to calculate the future value. As with the fv and type arguments in the PV function, both the pv and type arguments are optional in the FV function. If you omit these arguments, Excel assumes their values to be zero (0) in the function.
You can use the FV function to calculate the future value of an investment, such as an IRA (Individual Retirement Account). For example, suppose that you establish an IRA at age 43 and will retire 22 years from now at age 65 and that you plan to make annual payments into the IRA at the beginning of each year. If you assume a rate of return of 2.5 percent a year, you would enter the following FV function in your worksheet:
=FV(2.5%,22,-1500,,1)
Excel then indicates that you can expect a future value of $44,376.64 for your IRA when you retire at age 65. If you had established the IRA a year prior and the account already has a present value of $1,538, you would amend the FV function as follows:
=FV(2.5%,22,-1500,-1538,1)
In this case, Excel indicates that you can expect a future value of $47,024.42 for your IRA at retirement.
The PMT Function
The PMT function on the Financial button’s drop-down menu on the Formulas tab of the Ribbon calculates the periodic payment for an annuity, assuming a stream of equal payments and a constant rate of interest. The PMT function uses the following syntax:
=PMT(rate,nper,pv,[fv],[type])
As with the other common financial functions, rate is the interest rate per period, nper is the number of periods, pv is the present value or the amount the future payments are worth presently, fv is the future value or cash balance that you want after the last payment is made (Excel assumes a future value of zero when you omit this optional argument as you would when calculating loan payments), and type is the value 0 for payments made at the end of the period or the value 1 for payments made at the beginning of the period. (If you omit the optional type argument, Excel assumes that the payment is made at the end of the period.)
The PMT function is often used to calculate the payment for mortgage loans that have a fixed rate of interest. Figure 4-3 shows you a sample worksheet that contains a table using the PMT function to calculate loan payments for a range of interest rates (from 2.75 percent to 4.00 percent) and principals ($150,000 to $159,000). The table uses the initial principal that you enter in cell B2, copies it to cell A7, and then increases it by $1,000 in the range A8:A16. The table uses the initial interest rate that you enter in cell B3, copies to cell B6, and then increases this initial rate by 1/4 of a percent in the range C6:G6. The term in years in cell B4 is a constant factor that is used in the entire loan payment table.
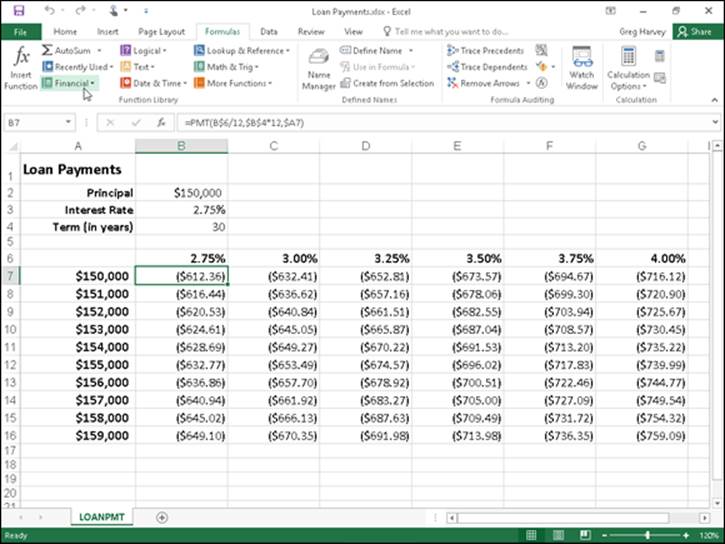
Figure 4-3: Loan Payments table using the PMT function to calculate various loan payments.
To get an idea of how easy it is to build this type of loan payment table with the PMT function, follow these steps for creating it in a new worksheet:
1. Enter the titles Loan Payments in cell A1, Principal in cell A2, Interest Rate in cell A3, and Term (in years) in cell A4.
2. Enter $150,000 in cell B2, enter 2.75% in cell B3, and enter 30 in cell B4.
These are the starting values with which you build the Loan Payments table.
3. Position the cell pointer in B6 and then build the formula =B3.
By creating a linking formula that brings forward the starting interest rate value in B3 with the formula, you ensure that the interest rate value in B6 will immediately reflect any change that you make in cell B3.
4. Position the cell pointer in cell C6 and then build the formula =B6+.25%.
By adding 1/4 of a percent to the interest rate to the value in B6 with the formula =B6+0.25% in C6 rather than creating a series with the AutoFill handle, you ensure that the interest rate value in cell C6 will always be 1/4 of a percent larger than any interest rate value entered in cell B6.
5. Drag the Fill handle in cell C6 to extend the selection to the right to cell G6 and then release the mouse button.
6. Position the cell pointer in cell A7 and then build the formula =B2.
Again, by using the formula =B2 to bring the initial principal forward to cell A7, you ensure that cell A7 always has the same value as cell B2.
7. Position the cell pointer in A8 active and then build the formula =A7+1000.
Here too, you use the formula =A7+1000 rather than create a series with the AutoFill feature so that the principal value in A8 will always be $1,000 greater than any value placed in cell A7.
8. Drag the Fill handle in cell A8 down until you extend the selection to cell A16 and then release the mouse button.
9. In cell B7, click the Insert Function button on the Formula bar, select Financial from the Or Select a Category drop-down list, and then double-click the PMT function in the Select a Function list box.
The Function Arguments dialog box that opens allows you to specify the rate, nper, and pv arguments. Be sure to move the Function Arguments dialog box to the right so that no part of it obscures the data in columns A and B of your worksheet before proceeding with the following steps for filling in the arguments.
10. Click cell B6 to insert B6 in the Rate text box and then press F4 twice to convert the relative reference B6 to the mixed reference B$6 (column relative, row absolute) before you type /12.
You convert the relative cell reference B6 to the mixed reference B$6 so that Excel does not adjust the row number when you copy the PMT formula down each row of the table, but it does adjust the column letter when you copy the formula across its columns. Because the initial interest rate entered in B3 (and then brought forward to cell B6) is an annual interest rate, but you want to know the monthly loan payment, you need to convert the annual rate to a monthly rate by dividing the value in cell B6 by 12.
11. Click the Nper text box, click cell B4 to insert this cell reference in this text box, and then press F4 once to convert the relative reference B4 to the absolute reference $B$4 before you type *12.
You need to convert the relative cell reference B4 to the absolute reference $B$4 so that Excel adjusts neither the row number nor the column letter when you copy the PMT formula down the rows and across the columns of the table. Because the term is an annual period, but you want to know the monthly loan payment, you need to convert the yearly periods to monthly periods by multiplying the value in cell B4 by 12.
12. Click the Pv text box, click A7 to insert this cell reference in this text box, and then press F4 three times to convert the relative reference A7 to the mixed reference $A7 (column absolute, row relative).
You need to convert the relative cell reference A7 to the mixed reference $A7 so that Excel won’t adjust the column letter when you copy the PMT formula across each column of the table, but will adjust the row number when you copy the formula down across its rows.
13. Click OK to insert the formula =PMT(B$6/12,$B$4*12,$A7) in cell B7.
Now you’re ready to copy this original PMT formula down and then over to fill in the entire Loan Payments table.
14. Drag the Fill handle on cell B7 down until you extend the fill range to cell B16 and then release the mouse button.
After you’ve copied the original PMT formula down to cell B16, you’re ready to copy it to the right to G16.
15. Drag the Fill handle to the right until you extend the fill range B7:B16 to cell G16 and then release the mouse button.
After copying the original formula with the Fill handle, be sure to widen columns B through G sufficiently to display their results. (You can do this in one step by dragging through the headers of these columns and then double-clicking the right border of column G.)
After you’ve created a loan table like this, you can then change the beginning principal or interest rate, as well as the term to see what the payments would be under various other scenarios. You can also turn on the Manual Recalculation so that you can control when the Loan Payments table is recalculated.
For information on how to switch to manual recalculation and use this mode to control when formulas are recalculated, see Book III, Chapter 1. For information on how to protect the worksheet so that users can input new values only into the three input cells (B2, B3, and B4) to change the starting loan amount, interest rate, and the term of the loan, see Book IV, Chapter 1.
Depreciation Functions
Excel lets you choose from four different depreciation functions, each of which uses a slightly different method for depreciating an asset over time. These built-in depreciation functions found on the Financial button’s drop-down menu on the Formulas tab of the Ribbon include the following:
· SLN(cost,salvage,life) to calculate straight-line depreciation
· SYD(cost,salvage,life,per) to calculate sum-of-years-digits depreciation
· DB(cost,salvage,life,period,[month]) to calculate declining balance depreciation
· DDB(cost,salvage,life,period,[factor]) to calculate double-declining balance depreciation
As you can see, with the exception of the optional month argument in the DB function and the optional factor argument in the DDB function, all the depreciation functions require the cost, salvage, and life arguments, and all but the SLN function require a period argument as well:
· Cost is the initial cost of the asset that you’re depreciating.
· Salvage is the value of the asset at the end of the depreciation (also known as the salvage value of the asset).
· Life is the number of periods over which the asset is depreciating (also known as the useful life of the asset).
· Per or period is the period over which the asset is being depreciated. The units that you use in the period argument must be the same as those used in the life argument of the depreciation function so that if you express the life argument in years, you must also express the periodargument in years.
Note that the DB function accepts an optional month argument. This argument is the number of months that the asset is in use in the first year. If you omit the month argument from your DB function, Excel assumes the number of months of service to be 12.
When using the DDB function to calculate the double-declining balance method of depreciation, you can add an optional factor argument. This argument is the rate at which the balance declines in the depreciation schedule. If you omit this optional factor argument, Excel assumes the rate to be 2 (thus, the name double-declining balance).
Figure 4-4 contains a Depreciation table that uses all four depreciation methods to calculate the depreciation of office furniture originally costing $50,000 to be depreciated over a 10-year period, assuming a salvage value of $1,000 at the end of this depreciation period.
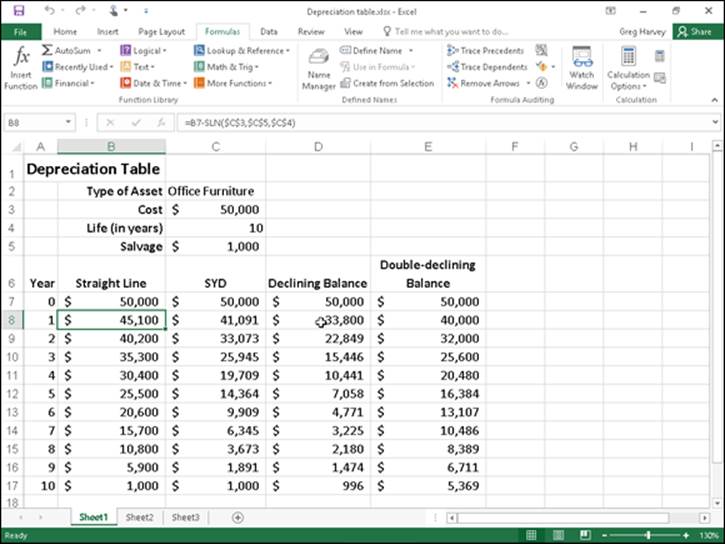
Figure 4-4: A Depreciation table showing 10-year depreciation of an asset using various methods.
The Formula bar shown in Figure 4-4 shows the SLN formula that I entered into cell B8:
=B7-SLN($C$3,$C$5,$C$4)
This formula subtracts the amount of straight-line depreciation to be taken in the first year of service from the original cost of $50,000. (This value is brought forward from cell C3 by the formula =C3.) After creating this original formula in cell B8, I then used the Fill handle to copy it down to cell B17, which contains the final salvage value of the asset in the 10th year of service.
Cell C8 contains a similar formula for calculating the sum-of-years-digits depreciation for the office furniture. This cell contains the following formula:
=C7-SYD($C$3,$C$5,$C$4,$A8)
This formula subtracts the amount of sum-of-years-digits depreciation to be taken at the end of the first year from the original cost of $50,000 in cell C7 (also brought forward from cell C3 by the formula =C3). After creating this original formula in cell C8, I again used the Fill handle to copy it down to cell C17, which also contains the final salvage value of the asset in the 10th year of service.
I used the same basic procedure to create the formulas using the DB and DDB depreciation methods in the cell ranges D8:D17 and E8:E17, respectively. Cell D8 contains the following DB formula:
=D7-DB($C$3,$C$5,$C$4,$A8)
Cell E8 contains the following DDB formula:
=E7-DDB($C$3,$C$5,$C$4,$A8)
Note that, like the SYD function, both of these depreciation functions require the use of a period argument, which is supplied by the list of years in the cell range A8:A17. Note also that the value in cell C4, which supplies the life argument to the SYD, DB, and DDB functions, matches the year units used in this cell range.
Analysis ToolPak Financial Functions
By activating the Analysis ToolPak add-in (see Book I, Chapter 2), you add a whole bunch of powerful financial functions to the Financial button’s drop-down menu on the Formulas tab of the Ribbon. Table 4-1 shows all the financial functions that are added to the Insert Function dialog box when the Analysis ToolPak is activated. As you can see from this table, the Analysis ToolPak financial functions are varied and quite sophisticated.
Table 4-1 Financial Functions in the Analysis ToolPak
|
Function |
What It Calculates |
|
ACCRINT(issue,first_interest,settlement,rate,[par],frequency,[basis],[calc_methd]) |
Calculates the accrued interest for a security that pays periodic interest. |
|
ACCRINTM(issue,maturity,rate,[par],[basis]) |
Calculates the accrued interest for a security that pays interest at maturity. |
|
AMORDEGRC(cost,date_purchased,first_period,salvage,period,rate,[basis]) and AMORLINC(cost,date_purchased,first_period,salvage,period,rate,[basis]) |
Used in French accounting systems for calculating depreciation. AMORDEGRC and AMORLINC return the depreciation for each accounting period. AMORDEGRC works like AMORLINC except that it applies a depreciation coefficient in the calculation that depends upon the life of the assets. |
|
COUPDAYBS(settlement,maturity,frequency,[basis]) |
Calculates the number of days from the beginning of a coupon period to the settlement date. |
|
COUPDAYS(settlement,maturity,frequency,[basis]) |
Calculates the number of days in the coupon period. |
|
COUPDAYSNC(settlement,maturity,frequency,[basis]) |
Calculates the number of days from the settlement date to the next coupon date. |
|
COUPNCD(settlement,maturity,frequency,[basis]) |
Calculates a number that represents the next coupon date after a settlement date. |
|
COUPNUM(settlement,maturity,frequency,[basis]) |
Calculates the number of coupons payable between the settlement date and maturity date, rounded up to the nearest whole coupon. |
|
COUPPCD(settlement,maturity,frequency,[basis]) |
Calculates a number that represents the previous coupon date before the settlement date. |
|
CUMIPMT(rate,nper,pv,start_period,end_period,type) |
Calculates the cumulative interest paid on a loan between the start_period and end_period. The type argument is 0 when the payment is made at the end of the period and 1 when it’s made at the beginning of the period. |
|
CUMPRINC(rate,nper,pv,start_period,end_period,type) |
Calculates the cumulative principal paid on a loan between the start_period and end_period. The type argument is 0 when the payment is made at the end of the period and 1 when it’s made at the beginning of the period. |
|
DISC(settlement,maturity,pr,redemption,[basis]) |
Calculates the discount rate for a security. |
|
DOLLARDE(fractional_dollar,fraction) |
Converts a dollar price expressed as a fraction into a dollar price expressed as a decimal number. |
|
DOLLARFR(decimal_dollar,fraction) |
Converts a dollar price expressed as a decimal number into a dollar price expressed as a fraction. |
|
DURATION(settlement,maturity,coupon,yld,frequency,[basis]) |
Calculates the Macauley duration for an assumed par value of $100. (Duration is defined as the weighted average of the present value of the cash flows and is used as a measure of the response of a bond price to changes in yield.) |
|
EFFECT(nominal_rate,npery) |
Calculates the effective annual interest rate given the nominal interest rate and the number of compounding periods per year. |
|
INTRATE(settlement,maturity,investment,redemption,[basis]) |
Calculates the interest rate for a fully invested security. |
|
MDURATION(settlement,maturity,coupon,yld,frequency,[basis]) |
Calculates the modified Macauley duration for a security with an assumed part value of $100. |
|
NOMINAL(effect_rate,npery) |
Calculates the nominal annual interest rate given the effect rate and the number of compounding periods per year. |
|
ODDFPRICE(settlement,maturity,issue,first_coupon,rate,yld,redemption,frequency,[basis]) |
Calculates the price per $100 face value of a security having an odd (short or long) first period. |
|
ODDFYIELD(settlement,maturity,issue,first_coupon,rate,pr,redemption,frequency,[basis]) |
Calculates the yield of a security that has an odd (short or long) first period. |
|
ODDLPRICE(settlement,maturity, last_interest,rate,yld,redemption,frequency,[basis]) |
Calculates the price per $100 face value of a security having an odd (short or long) last coupon period. |
|
ODDLYIELD(settlement,maturity,last_interest,rate,pr,redemption,frequency,[basis]) |
Calculates the yield of a security that has an odd (short or long) last period. |
|
PRICE(settlement,maturity,rate,yld,redemption,frequency,[basis]) |
Calculates the price per $100 face value of a security that pays periodic interest. |
|
PRICEDISC(settlement,maturity,discount,redemption,[basis]) |
Calculates the price per $100 face value of a discounted security. |
|
PRICEMAT(settlement,maturity,issue,rate,yld,[basis]) |
Calculates the price per $100 face value of a security that pays interest at maturity. |
|
RECEIVED(settlement,maturity,investment,discount,[basis]) |
Calculates the amount received at maturity for a fully invested security. |
|
TBILLEQ(settlement,maturity,discount) |
Calculates the bond-equivalent yield for a Treasury bill. |
|
TBILLPRICE(settlement,maturity,discount) |
Calculates the price per $100 face value for a Treasury bill. |
|
TBILLYIELD(settlement,maturity,pr) |
Calculates the yield for a Treasury bill. |
|
XIRR(values,dates,[guess]) |
Calculates the internal rate of return for a schedule of cash flows that are not periodic. |
|
XNPV(rate,values,dates) |
Calculates the net present value for a schedule of cash flows that are not periodic. |
|
YIELD(settlement,maturity,rate,pr,redemption,frequency,[basis]) |
Calculates the yield on a security that pays periodic interest (used to calculate bond yield). |
|
YIELDDISC(settlement,maturity,pr,redemption,[basis]) |
Calculates the annual yield for a discounted security. |
|
YIELDMAT(settlement,maturity,issue,rate,pr,[basis]) |
Calculates the annual yield of a security that pays interest at maturity. |
You may note in Table 4-1 that many of the Analysis ToolPak financial functions make use of an optional basis argument. This optional basis argument is a number between 0 and 4 that determines the day count basis to use in determining the fractional part of the year:
· 0 (or omitted) to base it on the U.S. (NASD) method of 30/360 (see the coverage on the DAYS360 function in Book III, Chapter 3 for details on the U.S. method)
· 1 to base the fraction on actual days/actual days
· 2 to base the fraction on actual days/360
· 3 to base the fraction on actual days/365
· 4 to base the fraction on the European method of 30/360 (see the DAYS360 coverage in Book III, Chapter 3 for details on the European method)
For detailed information on the other required arguments in the Analysis ToolPak financial functions shown in this table, select the function from the Financial button’s drop-down list and then click the Help on This Function link in the lower-left corner of its Function Arguments dialog box.
All materials on the site are licensed Creative Commons Attribution-Sharealike 3.0 Unported CC BY-SA 3.0 & GNU Free Documentation License (GFDL)
If you are the copyright holder of any material contained on our site and intend to remove it, please contact our site administrator for approval.
© 2016-2026 All site design rights belong to S.Y.A.