Microsoft Excel 2016 BIBLE (2016)
Part III
Creating Charts and Graphics
Chapter 21
Visualizing Data Using Conditional Formatting
IN THIS CHAPTER
1. Getting an overview of Excel's conditional formatting feature
2. Using the graphical conditional formats
3. Using conditional formatting formulas
4. Finding tips for using conditional formatting
This chapter explores the topic of conditional formatting, one of Excel's most versatile features. You can apply conditional formatting to a cell so that the cell looks different, depending on its contents.
Conditional formatting is a useful tool for visualizing numeric data. In some cases, conditional formatting may be a viable alternative to creating a chart.
About Conditional Formatting
Conditional formatting enables you to apply cell formatting selectively and automatically, based on the contents of the cells. For example, you can apply conditional formatting in such a way that all negative values in a range have a light-yellow background color. When you enter or change a value in the range, Excel examines the value and checks the conditional formatting rules for the cell. If the value is negative, the background is shaded; otherwise, no formatting is applied.
Conditional formatting is an easy way to quickly identify erroneous cell entries or cells of a particular type. You can use a format (such as bright-red cell shading) to make particular cells easy to identify.
Figure 21.1 shows a worksheet with nine ranges, each with a different type of conditional formatting rule applied.
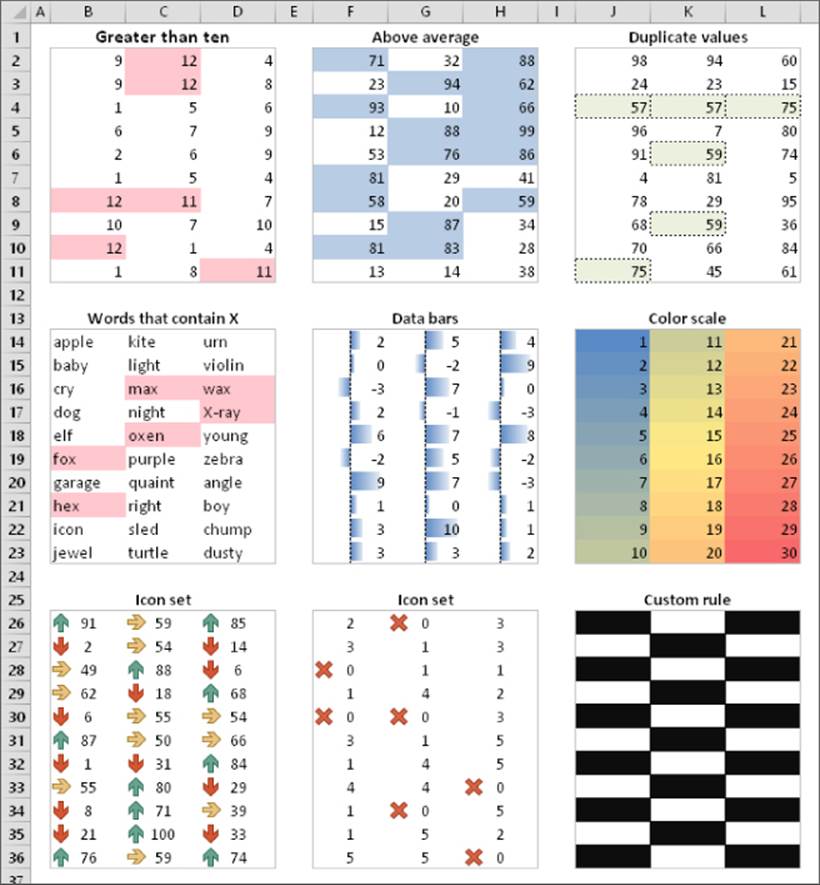
Figure 21.1 This worksheet demonstrates a few conditional formatting rules.
Here's a brief explanation of each:
· Greater than ten: Values greater than ten are highlighted with a different background color. This rule is just one of many numeric-value-related rules that you can apply.
· Above average: Values that are higher than the average value are highlighted.
· Duplicate values: Values that appear in the range more than once are highlighted.
· Words that contain X: If the cell contains X (upper- or lowercase), the cell is highlighted.
· Data bars: Each cell displays a horizontal bar, the length of which is proportional to its value.
· Color scale: The background color varies, depending on the value of the cells. You can choose from several different color scales or create your own.
· Icon set: This is one of several icon sets. It displays a small graphic in the cell. The graphic varies, depending on the cell value.
· Icon set: This is another icon set, with all but one icon in the set hidden.
· Custom rule: The rule for this checkerboard pattern is based on a formula:
=MOD(ROW(),2)=MOD(COLUMN(),2)
 This workbook, named conditional formatting examples.xlsx, is available on this book's website at www.wiley.com/go/excel2016bible.
Specifying Conditional Formatting
To apply a conditional formatting rule to a cell or range, select the cells and then use one of the commands from the Home ![]() Styles
Styles ![]() Conditional Formatting drop-down list to specify a rule. The choices are
Conditional Formatting drop-down list to specify a rule. The choices are
· Highlight Cell Rules: Examples include highlighting cells that are greater than a particular value, between two values, contain specific text string, contain a date, or are duplicated.
· Top Bottom Rules: Examples include highlighting the top ten items, the items in the bottom 20%, and items that are above average.
· Data Bars: Applies graphic bars directly in the cells, proportional to the cell's value.
· Color Scales: Applies background color, proportional to the cell's value.
· Icon Sets: Displays icons directly in the cells. The icons depend on the cell's value.
· New Rule: Enables you to specify other conditional formatting rules, including rules based on a logical formula.
· Clear Rules: Deletes all the conditional formatting rules from the selected cells.
· Manage Rules: Displays the Conditional Formatting Rules Manager dialog box, in which you create new conditional formatting rules, edit rules, or delete rules.
Formatting types you can apply
When you select a conditional formatting rule, Excel displays a dialog box specific to that rule. These dialog boxes have one thing in a common: a drop-down list with common formatting suggestions.
Figure 21.2 shows the dialog box that appears when you choose Home ![]() Styles
Styles ![]() Conditional Formatting
Conditional Formatting ![]() Highlight Cells Rules
Highlight Cells Rules ![]() Between. This particular rule applies the formatting if the value in the cell falls between two specified values. In this case, you enter the two values (or specify cell references) and then use choices from the drop-down list to set the type of formatting to display if the condition is met.
Between. This particular rule applies the formatting if the value in the cell falls between two specified values. In this case, you enter the two values (or specify cell references) and then use choices from the drop-down list to set the type of formatting to display if the condition is met.
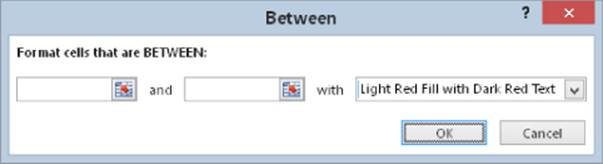
Figure 21.2 One of several different conditional formatting dialog boxes.
The formatting suggestions in the drop-down list are just a few of thousands of different formatting combinations. If none of Excel's suggestions are what you want, choose the Custom Format option to display the Format Cells dialog box. You can specify the format in any or all of the four tabs: Number, Font, Border, and Fill.
Note
The Format Cells dialog box used for conditional formatting is a modified version of the standard Format Cells dialog box. It doesn't have the Alignment and Protection tabs, and some of the Font formatting options are disabled. The dialog box also includes a Clear button that clears any formatting already selected.
Making your own rules
For maximum control, Excel provides the New Formatting Rule dialog box, shown in Figure 21.3. Access this dialog box by choosing Home ![]() Styles
Styles ![]() Conditional Formatting
Conditional Formatting ![]() New Rules.
New Rules.
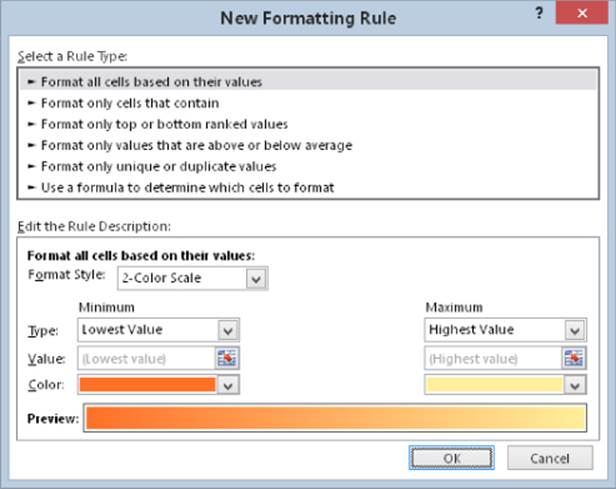
Figure 21.3 Use the New Formatting Rule dialog box to create your own conditional formatting rules.
Use the New Formatting Rule dialog box to re-create all the conditional format rules available via the Ribbon, as well as new rules. First, select a general rule type from the list at the top of the dialog box. The bottom part of the dialog box varies, depending on your selection at the top. After you specify the rule, click the Format button to specify the type of formatting to apply if the condition is met. An exception is the first rule type (Format All Cells Based on Their Values), which doesn't have a Format button. (It uses graphics rather than cell formatting.)
Here is a summary of the rule types:
· Format all cells based on their values: Use this rule type to create rules that display data bars, color scales, or icon sets.
· Format only cells that contain: Use this rule type to create rules that format cells based on mathematical comparisons (greater than, less than, greater than or equal to, less than or equal to, equal to, not equal to, between, not between). You can also create rules based on text, dates, blanks, nonblanks, and errors.
· Format only top- or bottom-ranked values: Use this rule type to create rules that involve identifying cells in the top n, top n%, bottom n, and bottom n%.
· Format only values that are above or below average: Use this rule type to create rules that identify cells that are above average, below average, or within a specified standard deviation from the average.
· Format only unique or duplicate values: Use this rule type to create rules that format unique or duplicate values in a range.
· Use a formula to determine which cells to format: Use this rule type to create rules based on a logical formula. (See “Creating Formula-Based Rules,” later in this chapter.)
Conditional Formats That Use Graphics
This section describes the three conditional formatting options that display graphics: data bars, color scales, and icon sets. These types of conditional formatting can be useful for visualizing the values in a range.
Using data bars
The data bars conditional format displays horizontal bars directly in the cell. The length of the bar is based on the value of the cell, relative to the other values in the range.
A simple data bar
Figure 21.4 shows an example of data bars. It's a list of tracks on 39 Bob Dylan albums, with the length of each track in column D. I applied data bar conditional formatting to the values in column D. You can tell at a glance which tracks are longer.
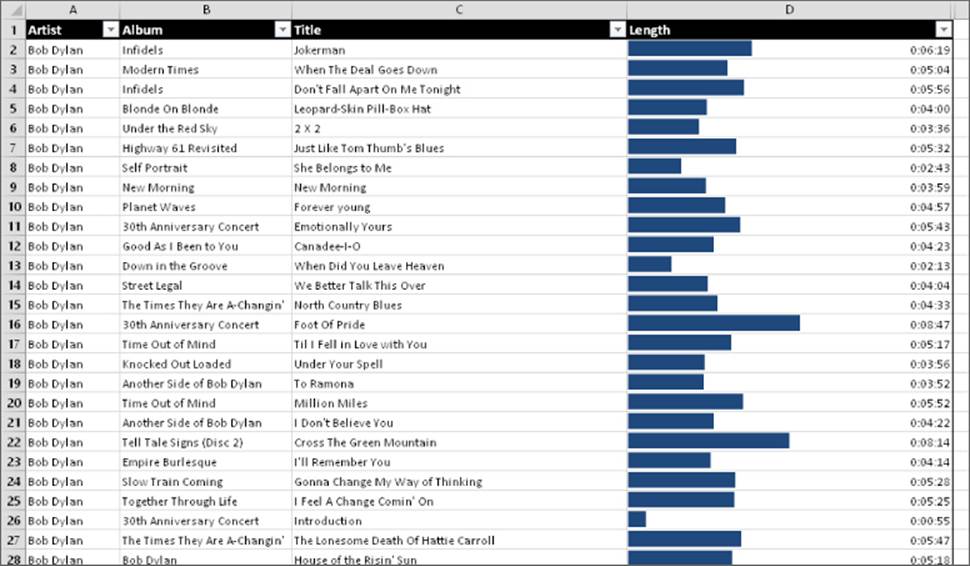
Figure 21.4 The length of the data bars is proportional to the track length in the cell in column D.
The examples in the section are available on this book's website at www.wiley.com/go/excel2016bible. The workbook is named data bars examples.xlsx.
Tip
When you adjust the column width, the bar lengths adjust accordingly. The differences among the bar lengths are more prominent when the column is wider.
Excel provides quick access to 12 data bar styles via Home ![]() Styles
Styles ![]() Conditional Formatting
Conditional Formatting ![]() Data Bars. For additional choices, click the More Rules option, which displays the New Formatting Rule dialog box. Use this dialog box to
Data Bars. For additional choices, click the More Rules option, which displays the New Formatting Rule dialog box. Use this dialog box to
· Show the bar only. (Hide the numbers.)
· Specify Minimum and Maximum values for the scaling.
· Change the appearance of the bars.
· Specify how negative values and the axis are handled.
· Specify the direction of the bars.
Note
Oddly, if you add data bars using one of the 12 data bar styles, the colors used for data bars are not theme colors. If you apply a new document theme, the data bar colors do not change. However, if you add the data bars by using the New Formatting Rule dialog box, the colors you choose are theme colors.
Using data bars in lieu of a chart
Using the data bars conditional formatting can sometimes serve as a quick alternative to creating a chart. Figure 21.5 shows a three-column range (in B3:D14) with data bars conditional formatting in column D. (Column D contains references to the values in column C.) The conditional formatting in column D uses the Show Bars Only option, so the values are not displayed.
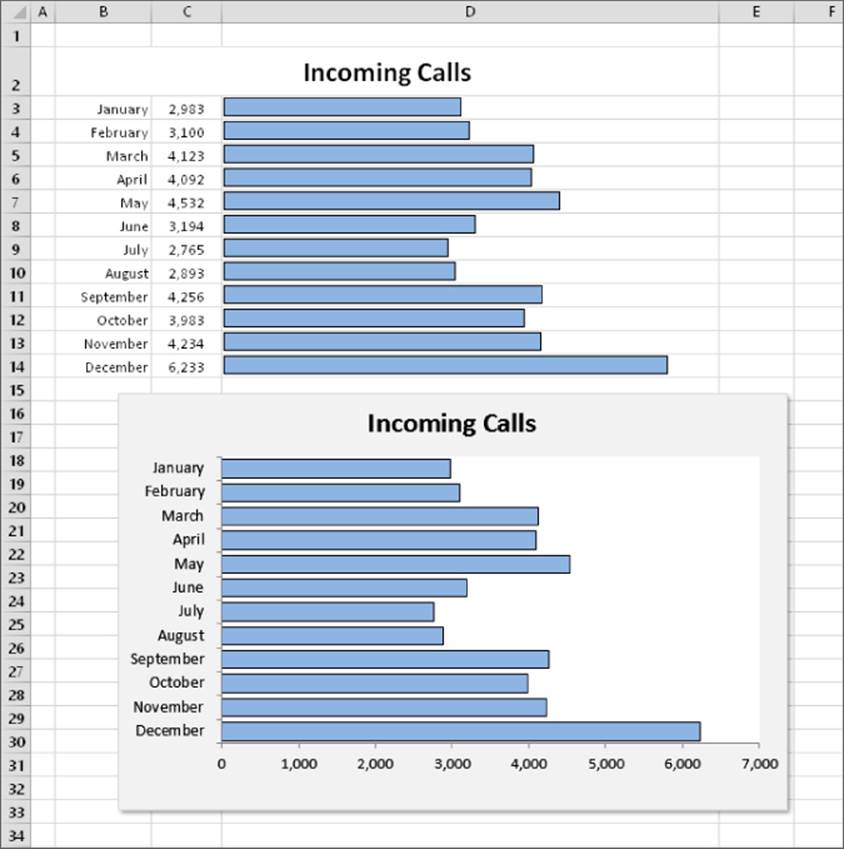
Figure 21.5 Comparing data bars conditional formatting (top) with a bar chart.
Figure 21.5 also shows an actual bar chart created from the same data. The bar chart takes about the same amount of time to create and is a lot more flexible. But for a quick-and-dirty chart, data bars may be a good option — especially when you need to create several such charts.
Using color scales
The color scale conditional formatting option varies the background color of a cell based on the cell's value, relative to other cells in the range.
A color scale example
Figure 21.6 shows examples of color scale conditional formatting. The example on the left depicts monthly sales for three regions. Conditional formatting was applied to the range B4:D15. The conditional formatting uses a three-color scale, with red for the lowest value, yellow for the midpoint, and green for the highest value. Values in between are displayed using a color within the gradient. It's clear that the Central region consistently has lower sales volumes, but the conditional formatting doesn't help identify monthly difference for a particular region.
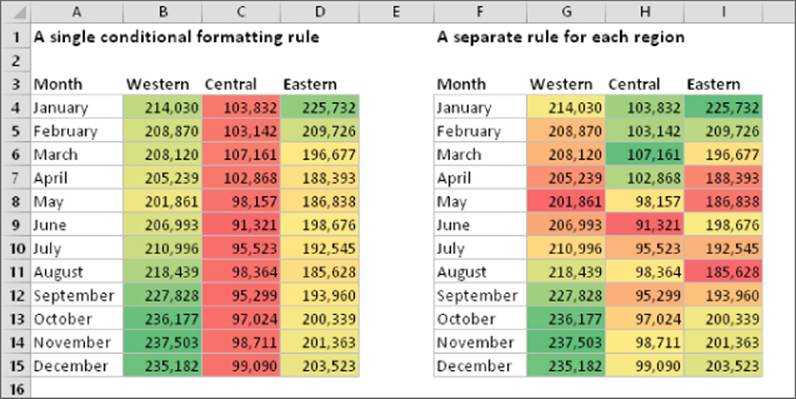
Figure 21.6 Two examples of color scale conditional formatting.
The example on the right shows the same data, but conditional formatting was applied to each region separately. This approach facilitates comparisons within a region and can identify high or low sales months.
Neither one of these approaches is necessarily better. The way you set up conditional formatting depends entirely on what you're trying to visualize.
This workbook, named color scale example.xlsx, is available on this book's website at www.wiley.com/go/excel2016bible.
Excel provides four two-color scale presets and four three-color scales presets, which you can apply to the selected range by choosing Home ![]() Styles
Styles ![]() Conditional Formatting
Conditional Formatting ![]() Color Scales.
Color Scales.
To customize the colors and other options, choose Home ![]() Styles
Styles ![]() Conditional Formatting
Conditional Formatting ![]() Color Scales
Color Scales ![]() More Rules. The New Formatting Rule dialog box, shown in Figure 21.7, appears. Adjust the settings, and watch the Preview box to see the effects of your changes.
More Rules. The New Formatting Rule dialog box, shown in Figure 21.7, appears. Adjust the settings, and watch the Preview box to see the effects of your changes.
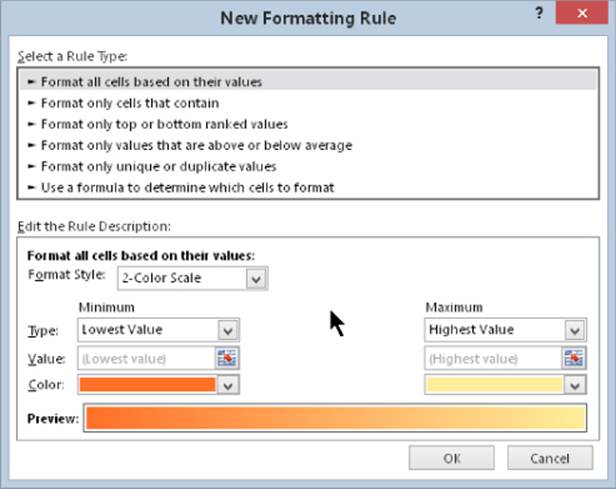
Figure 21.7 Use the New Formatting Rule dialog box to customize a color scale.
An extreme color scale example
It's important to understand that color scale conditional formatting uses a gradient. For example, if you format a range using a two-color scale, you'll get a lot more than two colors. You'll also get colors within the gradient between the two specified colors.
Figure 21.8 shows an extreme example that uses color scale conditional formatting on a range of more than 6,000 cells. The worksheet contains average daily temperatures for an 18-year period. Each row contains 365 (or 366) temperatures for the year. The columns are narrow so the entire year can be visualized.
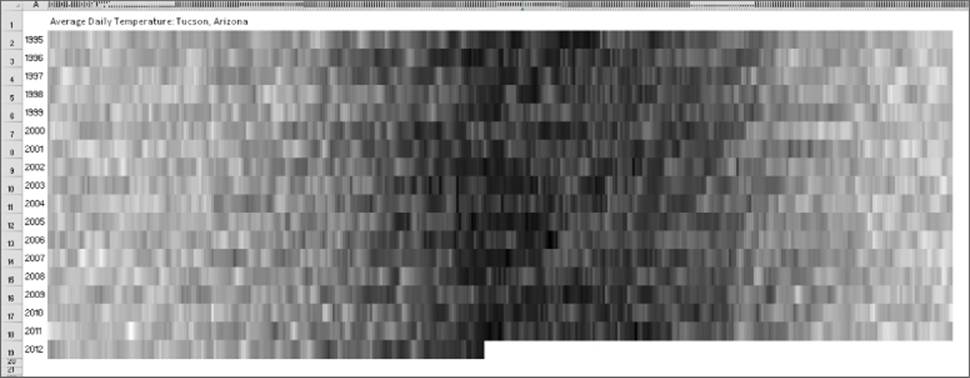
Figure 21.8 This worksheet uses color scale conditional formatting to display daily temperatures.
This workbook, named extreme color scale.xlsx, is available on this book's website at www.wiley.com/go/excel2016bible. The workbook contains a second example of extreme color scale.
Using icon sets
Yet another conditional formatting option is to display an icon in the cell. The icon displayed depends on the value of the cell.
To assign an icon set to a range, select the cells and choose Home ![]() Styles
Styles ![]() Conditional Formatting
Conditional Formatting ![]() Icon Sets. Excel provides 20 icon sets to choose from. The number of icons in the sets ranges from three to five. You can't create a custom icon set.
Icon Sets. Excel provides 20 icon sets to choose from. The number of icons in the sets ranges from three to five. You can't create a custom icon set.
An icon set example
Figure 21.9 shows an example that uses an icon set. The symbols graphically depict the status of each project, based on the value in column C.
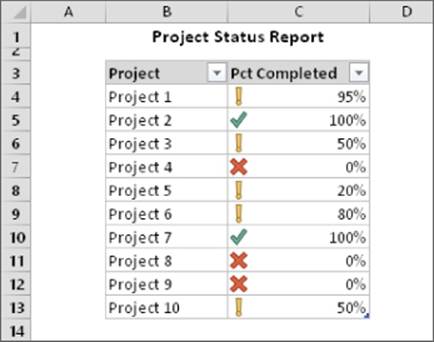
Figure 21.9 Using an icon set to indicate the status of projects.
The icon set examples in this section are available on this book's website at www.wiley.com/go/excel2016bible. The workbook is named icon set examples.xlsx.
By default, the symbols are assigned using percentiles. For a three-symbol set, the items are grouped into three percentiles. For a four-symbol set, they're grouped into four percentiles. And for a five-symbol set, the items are grouped into five percentiles.
If you would like more control over how the icons are assigned, choose Home ![]() Styles
Styles ![]() Conditional Formatting
Conditional Formatting ![]() Icon Sets
Icon Sets ![]() More Rules to display the New Formatting Rule dialog box. To modify an existing rule, choose Home
More Rules to display the New Formatting Rule dialog box. To modify an existing rule, choose Home ![]() Styles
Styles ![]() Conditional Formatting
Conditional Formatting ![]() Manage Rules. Then select the rule to modify and click the Edit Rule button.
Manage Rules. Then select the rule to modify and click the Edit Rule button.
Figure 21.10 shows how to modify the icon set rules such that only projects that are 100% completed get the check mark icons. Projects that are 0% completed get the X icon. All other projects get no icon.
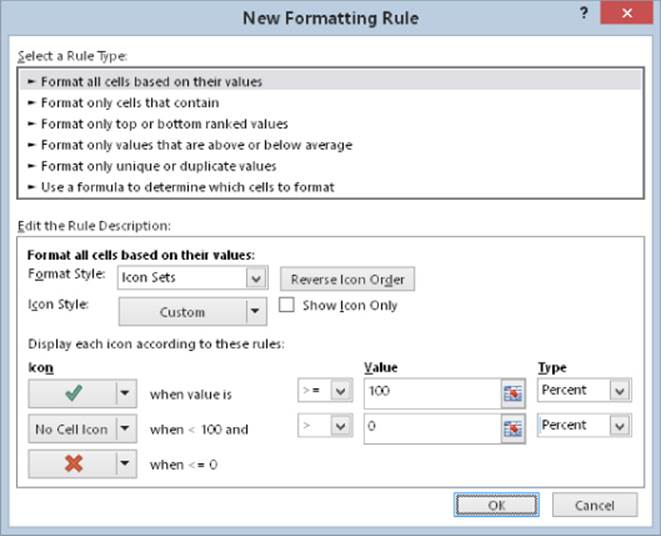
Figure 21.10 Changing the icon assignment rule.
Figure 21.11 shows project status list after making this change.
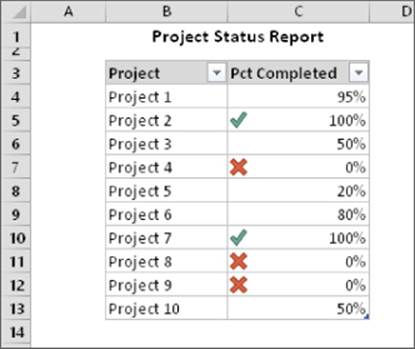
Figure 21.11 Using a modified rule and eliminating an icon makes the table more readable.
Another icon set example
Figure 21.12 shows a table that contains two test scores for each student. The Change column contains a formula that calculates the difference between the two tests. The Trend column uses an icon set to display the trend graphically.
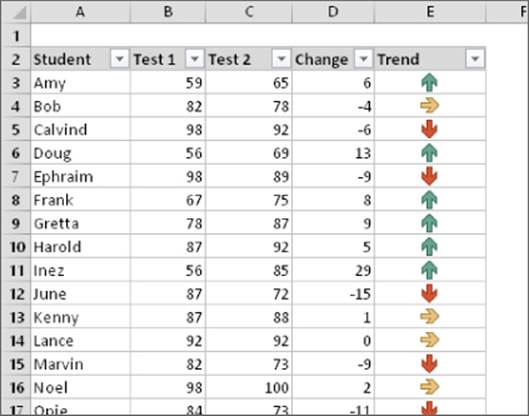
Figure 21.12 The arrows depict the trend from Test 1 to Test 2.
This example uses the icon set named 3 Arrows, and I customized the rule:
· Up Arrow: When value is >= 5
· Level Arrow: When value < 5 and > –5
· Down Arrow: When value is <= –5
In other words, a difference of no more than five points in either direction is considered an even trend. An improvement of at least five points is considered a positive trend, and a decline of five points or more is considered a negative trend.
Note
The Trend column contains a formula that references the Change column. I used the Show Icon Only option in the Trend column, which also centers the icon in the column.
In some cases, using icon sets can cause your worksheet to look a bit cluttered. Displaying an icon for every cell in a range might result in visual overload.
Figure 21.13 shows a portion of the test results table after hiding the level arrow by choosing No Cell Icon in the Edit Formatting Rule dialog box.
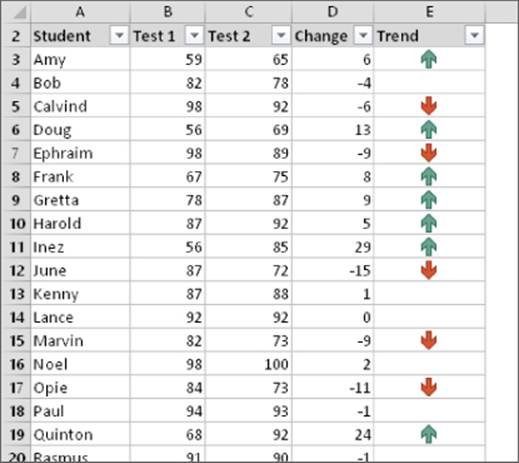
Figure 21.13 Hiding one of the icons makes the table less cluttered.
Creating Formula-Based Rules
Excel's conditional formatting feature is versatile, but sometimes it's just not quite versatile enough. Fortunately, you can extend its versatility by writing conditional formatting formulas.
The examples later in this section describe how to create conditional formatting formulas to
· Identify text entries
· Identify dates that fall on a weekend
· Format cells that are in odd-numbered rows or columns (for dynamic alternate row or columns shading)
· Format groups of rows (for example, shade every two groups of rows)
· Display a sum only when all precedent cells contain values
Some of these formulas may be useful to you. If not, they may inspire you to create other conditional formatting formulas.
This book's website at www.wiley.com/go/excel2016bible contains all the examples in this section. The file is named conditional formatting formulas.xlsx.
To specify conditional formatting based on a formula, select the cells and then choose Home ![]() Styles
Styles ![]() Conditional Formatting
Conditional Formatting ![]() New Rule. The New Formatting Rule dialog box appears. Click the rule type Use a Formula to Determine Which Cells to Format, and then specify the formula.
New Rule. The New Formatting Rule dialog box appears. Click the rule type Use a Formula to Determine Which Cells to Format, and then specify the formula.
You can type the formula directly into the box or enter a reference to a cell that contains a logical formula. As with normal Excel formulas, the formula you enter here must begin with an equal sign (=).
Note
The formula must be a logical one that returns either TRUE or FALSE. If the formula evaluates to TRUE, the condition is satisfied and the conditional formatting is applied. If the formula evaluates to FALSE, the conditional formatting is not applied.
Understanding relative and absolute references
If the formula that you enter into the Conditional Formatting dialog box contains a cell reference, that reference is considered a relative reference based on the upper-left cell in the selected range.
For example, suppose that you want to set up a conditional formatting condition that applies shading to cells in range A1:B10 only if the cell contains text. None of Excel's conditional formatting options can do this task, so you need to create a formula that will returnTRUE if the cell contains text and FALSE otherwise. Follow these steps:
1. Select the range A1:B10 and ensure that cell A1 is the active cell.
2. Choose Home ![]() Styles
Styles ![]() Conditional Formatting
Conditional Formatting ![]() New Rule. The New Formatting Rule dialog box appears.
New Rule. The New Formatting Rule dialog box appears.
3. Click the Use a Formula to Determine Which Cells to Format rule type.
4. Enter the following formula into the Formula box:
=ISTEXT(A1)
5. Click the Format button. The Format Cells dialog box appears.
6. From the Fill tab, specify the cell shading that will be applied if the formula returnsTRUE.
7. Click OK to return to the New Formatting Rule dialog box (see Figure 21.14).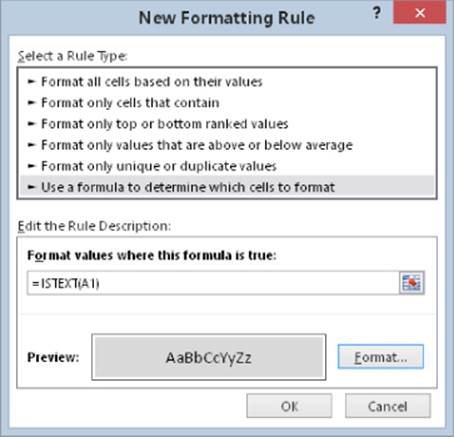
Figure 21.14 Creating a conditional formatting rule based on a formula.
8. Click OK to close the New Formatting Rule dialog box.
Notice that the formula entered in step 4 contains a relative reference to the upper-left cell in the selected range.
Generally, when entering a conditional formatting formula for a range of cells, you'll use a reference to the active cell, which is typically the upper-left cell in the selected range. One exception is when you need to refer to a specific cell. For example, suppose that you select range A1:B10, and you want to apply formatting to all cells in the range that exceed the value in cell C1. Enter this conditional formatting formula:
=A1>$C$1
In this case, the reference to cell C1 is an absolute reference; it will not be adjusted for the cells in the selected range. In other words, the conditional formatting formula for cell A2 looks like this:
=A2>$C$1
The relative cell reference is adjusted, but the absolute cell reference is not.
Conditional formatting formula examples
Each of these examples uses a formula entered directly into the New Formatting Rule dialog box, after selecting the Use a Formula to Determine Which Cells to Format rule type. You decide the type of formatting that you apply conditionally.
Identifying weekend days
Excel provides a number of conditional formatting rules that deal with dates, but it doesn't let you identify dates that fall on a weekend. Use this formula to identify weekend dates:
=OR(WEEKDAY(A1)=7,WEEKDAY(A1)=1)
This formula assumes that a range is selected and that cell A1 is the active cell.
Highlighting a row based on a value
Figure 21.15 shows a worksheet that contains a conditional formula in the range A3:G28. If a name entered in cell B1 is found in the first column, the entire row for that name is highlighted.
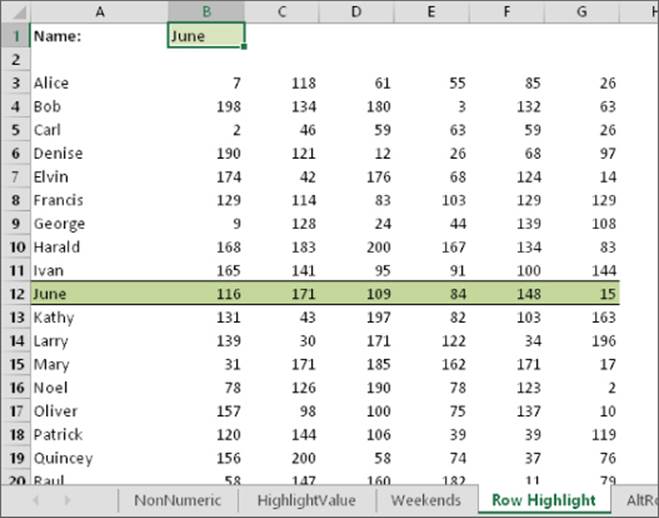
Figure 21.15 Highlighting a row, based on a matching name.
The conditional formatting formula is
=$A3=$B$1
Notice that a mixed reference is used for cell A3. Because the column part of the reference is absolute, the comparison is always done using the contents of column A.
Displaying alternate-row shading
The conditional formatting formula that follows was applied to the range A1:D18, as shown in Figure 21.16, to apply shading to alternate rows:
=MOD(ROW(),2)=0
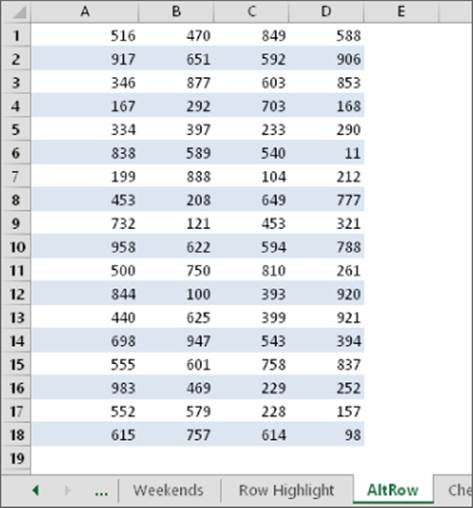
Figure 21.16 Using conditional formatting to apply formatting to alternate rows.
Alternate row shading can make your spreadsheets easier to read. If you add or delete rows within the conditional formatting area, the shading is updated automatically.
This formula uses the ROW function (which returns the row number) and the MOD function (which returns the remainder of its first argument divided by its second argument). For cells in even-numbered rows, the MOD function returns 0, and cells in that row are formatted.
For alternate shading of columns, use the COLUMN function instead of the ROW function.
Creating checkerboard shading
The following formula is a variation on the example in the preceding section. It applies formatting to alternate rows and columns, creating a checkerboard effect:
=MOD(ROW(),2)=MOD(COLUMN(),2)
Shading groups of rows
Here's another row shading variation. The following formula shades alternate groups of rows. It produces four shaded rows, followed by four unshaded rows, followed by four more shaded rows, and so on:
=MOD(INT((ROW()-1)/4)+1,2)=1
Figure 21.17 shows an example.
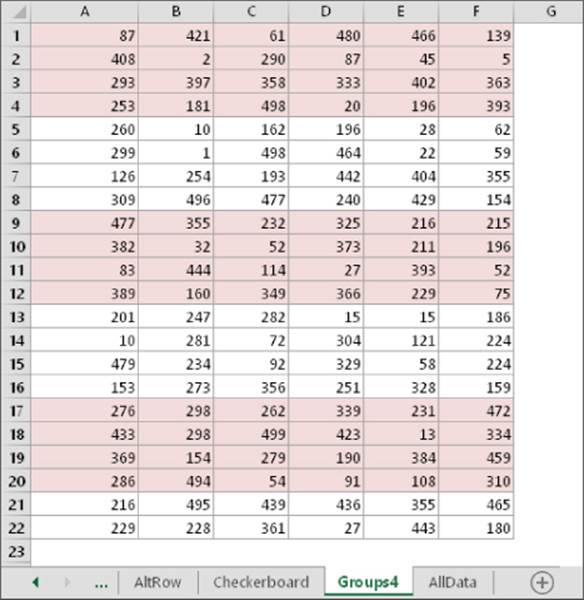
Figure 21.17 Conditional formatting produces these groups of alternating shaded rows.
For different sized groups, change the 4 to some other value. For example, use this formula to shade alternate groups of two rows:
=MOD(INT((ROW()-1)/2)+1,2)=1
Displaying a total only when all values are entered
Figure 21.18 shows a range with a formula that uses the SUM function in cell C6. Conditional formatting is used to display the sum only when the four cells above aren't blank. The conditional formatting formula for cell C6 (and cell C5, which contains a label) is
=COUNT($C$2:$C$5)=4
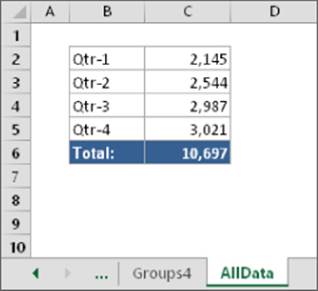
Figure 21.18 The sum is displayed only when all four values have been entered.
This formula returns TRUE only if C2:C5 contains no empty cells. The conditional formatting applied is a dark background color. The text color is white, so it's legible only when the conditional formatting rule is satisfied.
Figure 21.19 shows the worksheet when one of the values is missing.
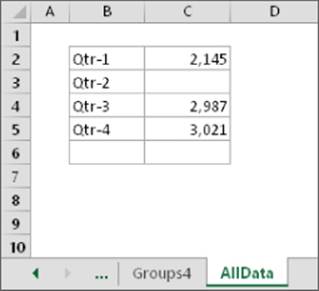
Figure 21.19 A missing value causes the sum to be hidden.
Creating a Gantt Chart
In Chapter 20, “Learning Advanced Charting,” I described how to create a Gantt chart to display a project schedule graphically. Creating such a display is easier if you use conditional formatting rather than an actual chart. Figure 21.20 shows a Gantt chart created using conditional formatting.
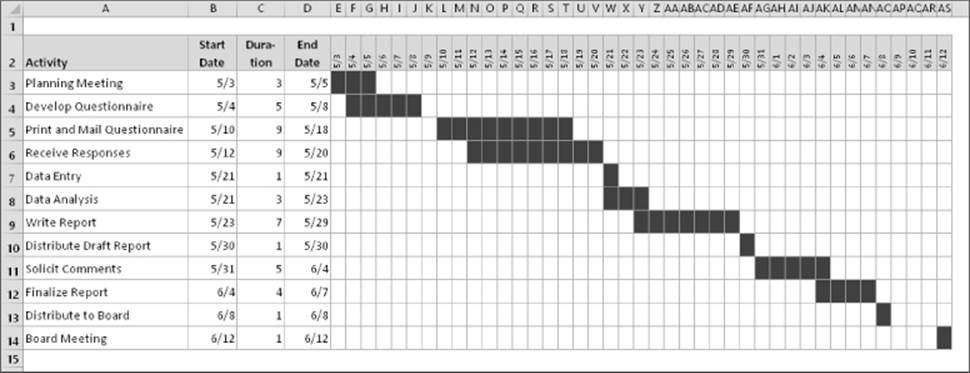
Figure 21.20 A Gantt chart created using conditional formatting.
The icon set examples in this section are available on this book's website at www.wiley.com/go/excel2016bible. The workbook is named conditional formatting gantt chart.xlsx.
Each activity has a start date (Column B) and a duration (Column C). Formulas in Column D calculate the end date for each activity. Row 2 contains consecutive dates that cover the time period for the project.
To add the conditional formatting, select range E3:AS14 and choose Home ![]() Styles
Styles ![]() Conditional Formatting
Conditional Formatting ![]() New Rule. In the New Formatting Rule dialog box, select the Use a Formula option, and enter the following formula:
New Rule. In the New Formatting Rule dialog box, select the Use a Formula option, and enter the following formula:
=AND(E$2>=$B3,E$2<=$D3)
Then click Format and specify a color for the fill.
The conditional formatting is applied only when the corresponding date in Row 2 is greater than or equal to the start date and is less than or equal to the end date.
You can extend this technique to use any number of rows and columns.
Working with Conditional Formats
This section describes some additional information about conditional formatting that you may find useful.
Managing rules
The Conditional Formatting Rules Manager dialog box is useful for checking, editing, deleting, and adding conditional formats. First select any cell in the range that contains conditional formatting. Then choose Home ![]() Styles
Styles ![]() Conditional Formatting
Conditional Formatting ![]() Manage Rules.
Manage Rules.
You can specify as many rules as you like by clicking the New Rule button. Cells can even use data bars, color scales, and icon sets at the same time — although I can't think of a good reason to do so.
Copying cells that contain conditional formatting
Conditional formatting information is stored with a cell much like standard formatting information is stored with a cell. As a result, when you copy a cell that contains conditional formatting, you also copy the conditional formatting.
Tip
To copy only the formatting (including conditional formatting), copy the cells and then use the Paste Special dialog box and select the Formats option. Or choose Home ![]() Clipboard
Clipboard ![]() Paste
Paste ![]() Formatting (R).
Formatting (R).
If you insert rows or columns within a range that contains conditional formatting, the new cells have the same conditional formatting.
Deleting conditional formatting
When you press Delete to delete the contents of a cell, you don't delete the conditional formatting for the cell (if any). To remove all conditional formats (as well as all other cell formatting), select the cell and then choose Home ![]() Editing
Editing ![]() Clear
Clear ![]() Clear Formats. Or choose Home
Clear Formats. Or choose Home ![]() Editing
Editing ![]() Clear
Clear ![]() Clear All to delete the cell contents and the conditional formatting.
Clear All to delete the cell contents and the conditional formatting.
To remove only conditional formatting (and leave the other formatting intact), choose Home ![]() Styles
Styles ![]() Conditional Formatting
Conditional Formatting ![]() Clear Rules.
Clear Rules.
Locating cells that contain conditional formatting
You can't always tell, just by looking at a cell, whether it contains conditional formatting. You can, however, use the Go to Special dialog box to select such cells.
1. Choose Home ![]() Editing
Editing ![]() Find & Select
Find & Select ![]() Go to Special. The Go to Special dialog box appears.
Go to Special. The Go to Special dialog box appears.
2. In the Go to Special dialog box, select the Conditional Formats option.
3. To select all cells on the worksheet containing conditional formatting, select the All option; to select only the cells that contain the same conditional formatting as the active cell, select the Same option.
4. Click OK. Excel selects the cells for you.
Note
The Excel Find and Replace dialog box includes a feature that allows you to search your worksheet to locate cells that contain specific formatting. This feature does not locate cells that contain formatting resulting from conditional formatting.
All materials on the site are licensed Creative Commons Attribution-Sharealike 3.0 Unported CC BY-SA 3.0 & GNU Free Documentation License (GFDL)
If you are the copyright holder of any material contained on our site and intend to remove it, please contact our site administrator for approval.
© 2016-2026 All site design rights belong to S.Y.A.